The purpose of this project is to analyze Kickstarter campaign data to make informed decisions for future campaign planning for Theater projects.
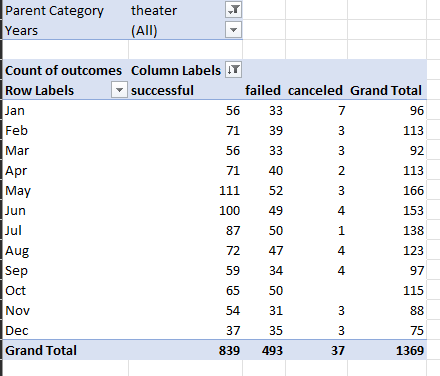
We first looked at the effect that launch date had on the outcomes of historical theater Kickstarter campaigns. To analyze this date, we relied on a pivot table to display the number of successful, failed, and canceled campaigns for each month.
See the pivot table below:
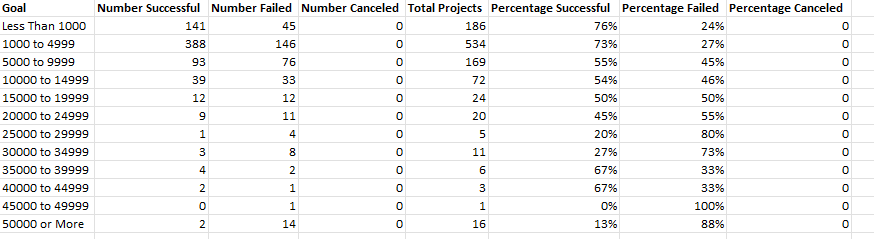
Secondly, we looked at the effect of goal size on theater Kickstarter campaign outcomes. We harnessed the power of Excel functions, COUNTIFS() and SUM(), to accurately import and compile data into a table to see which monetary goal range was the most successful.
See the table below:
- What are two conclusions you can draw about the Outcomes based on Launch Date?
Theater Kickstarter campaigns were most successful when launched in May and June, and least successful when launched in December.
- What can you conclude about the Outcomes based on Goals?
Goal amount had a substantial effect on the outcome of theater Kickstarter campaigns. Campaigns were less than 50% successful with goals of less than $20,000 and were 100% successful with goals in the $45,000 - $49,999 range. Ninety percent of Kickstarter campaigns at the $50,000 range and above were successful as well.
- What are some limitations of this dataset?
One limitation is that the dataset doesn't go into more detail on the genre of plays. I'm sure there are some genres that are more popular than others and that would effect the success of the Kickstarter campaign.
- What are some other possible tables and/or graphs that we could create?
We could look at the effect that Kickstarter campaign length has on success by using the DAYS() function to calculate the number of days each campaign ran. We would need to calculate descriptive statistics for the Successful and Unsuccessful outcome groups and create a box and whisker plot from those statistics. This would allow us to evaluate the effect of time on outcomes.