
Hello and welcome to The Three Musketeer's data pipeline, built to deliver a user interface for Deloton customers as well as a data warehoue for Deloton employees to access using an API and Tableau. The CEO of Deloton also receives a Daily Report.
- General Info
- Project Roadmap
- Usage
- Credits & Acknowledgments
- Further Development
- Ways to Contribute
- Legacy Contributions
This repo contains everything required to build a full ETL pipeline which collects data from live bike ride outputs and returns meaningful and insightful forms of data visualisation and functionality in the form of 5 key deliverables:
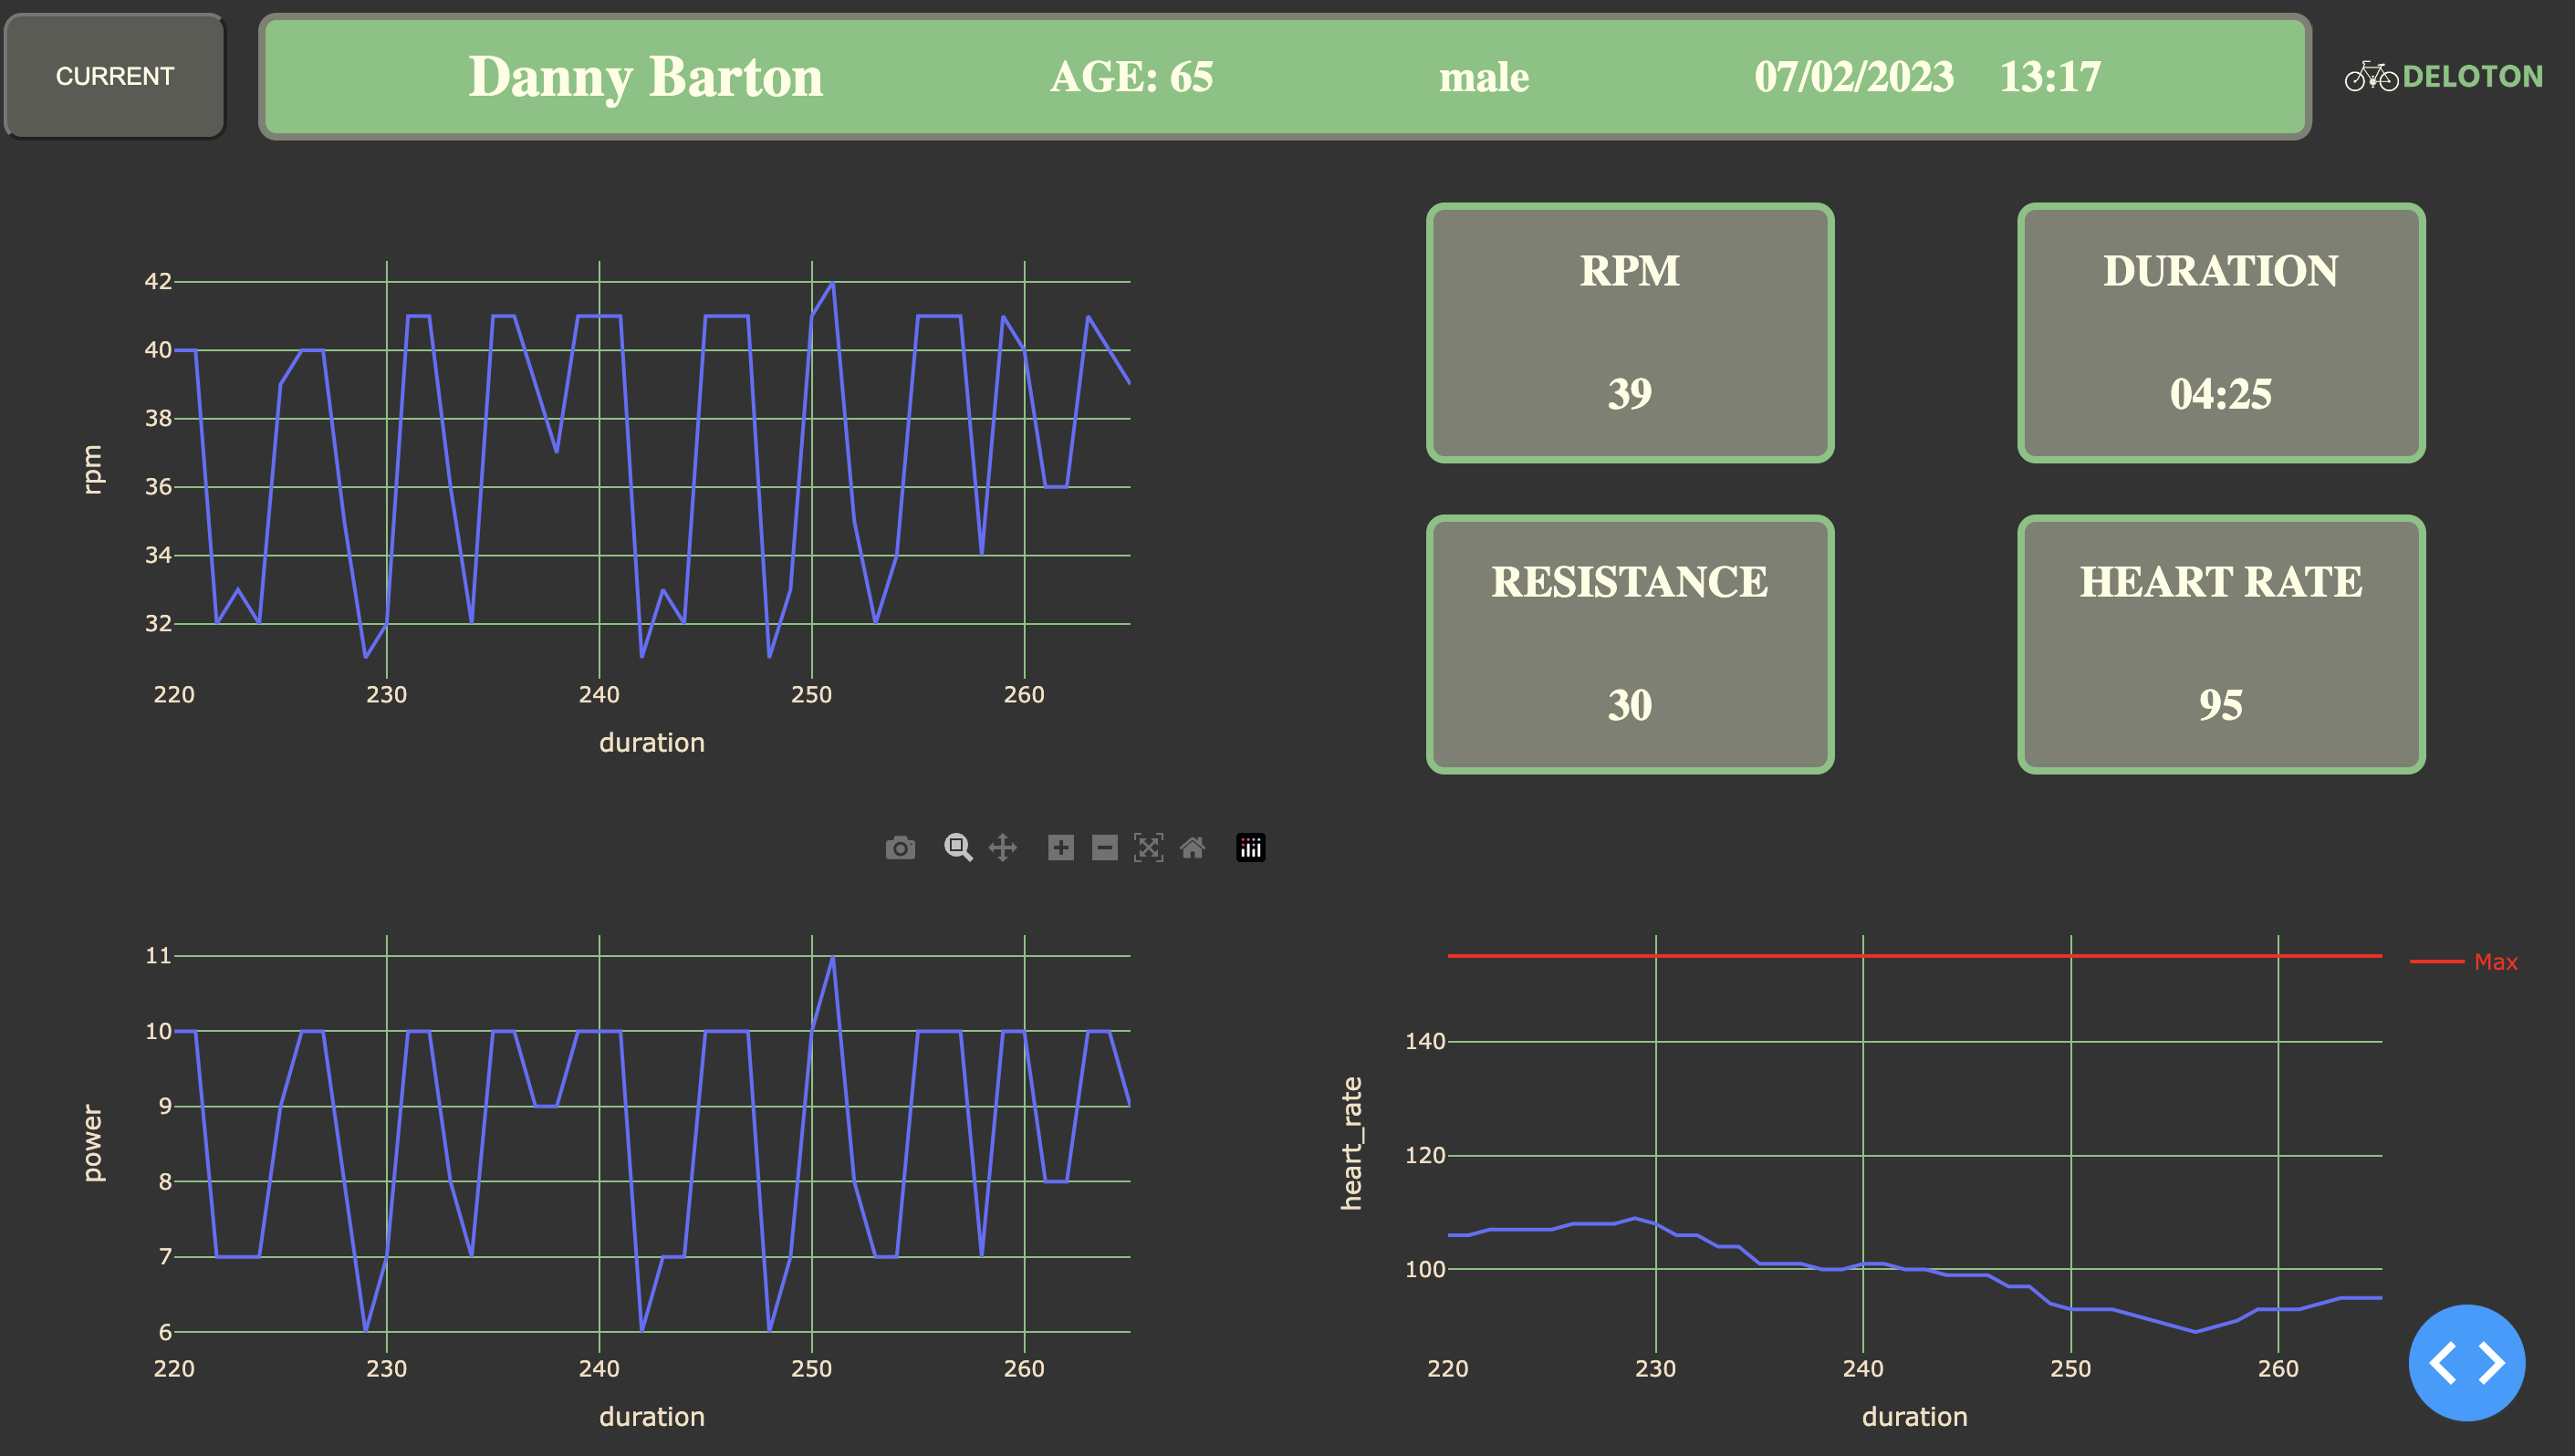
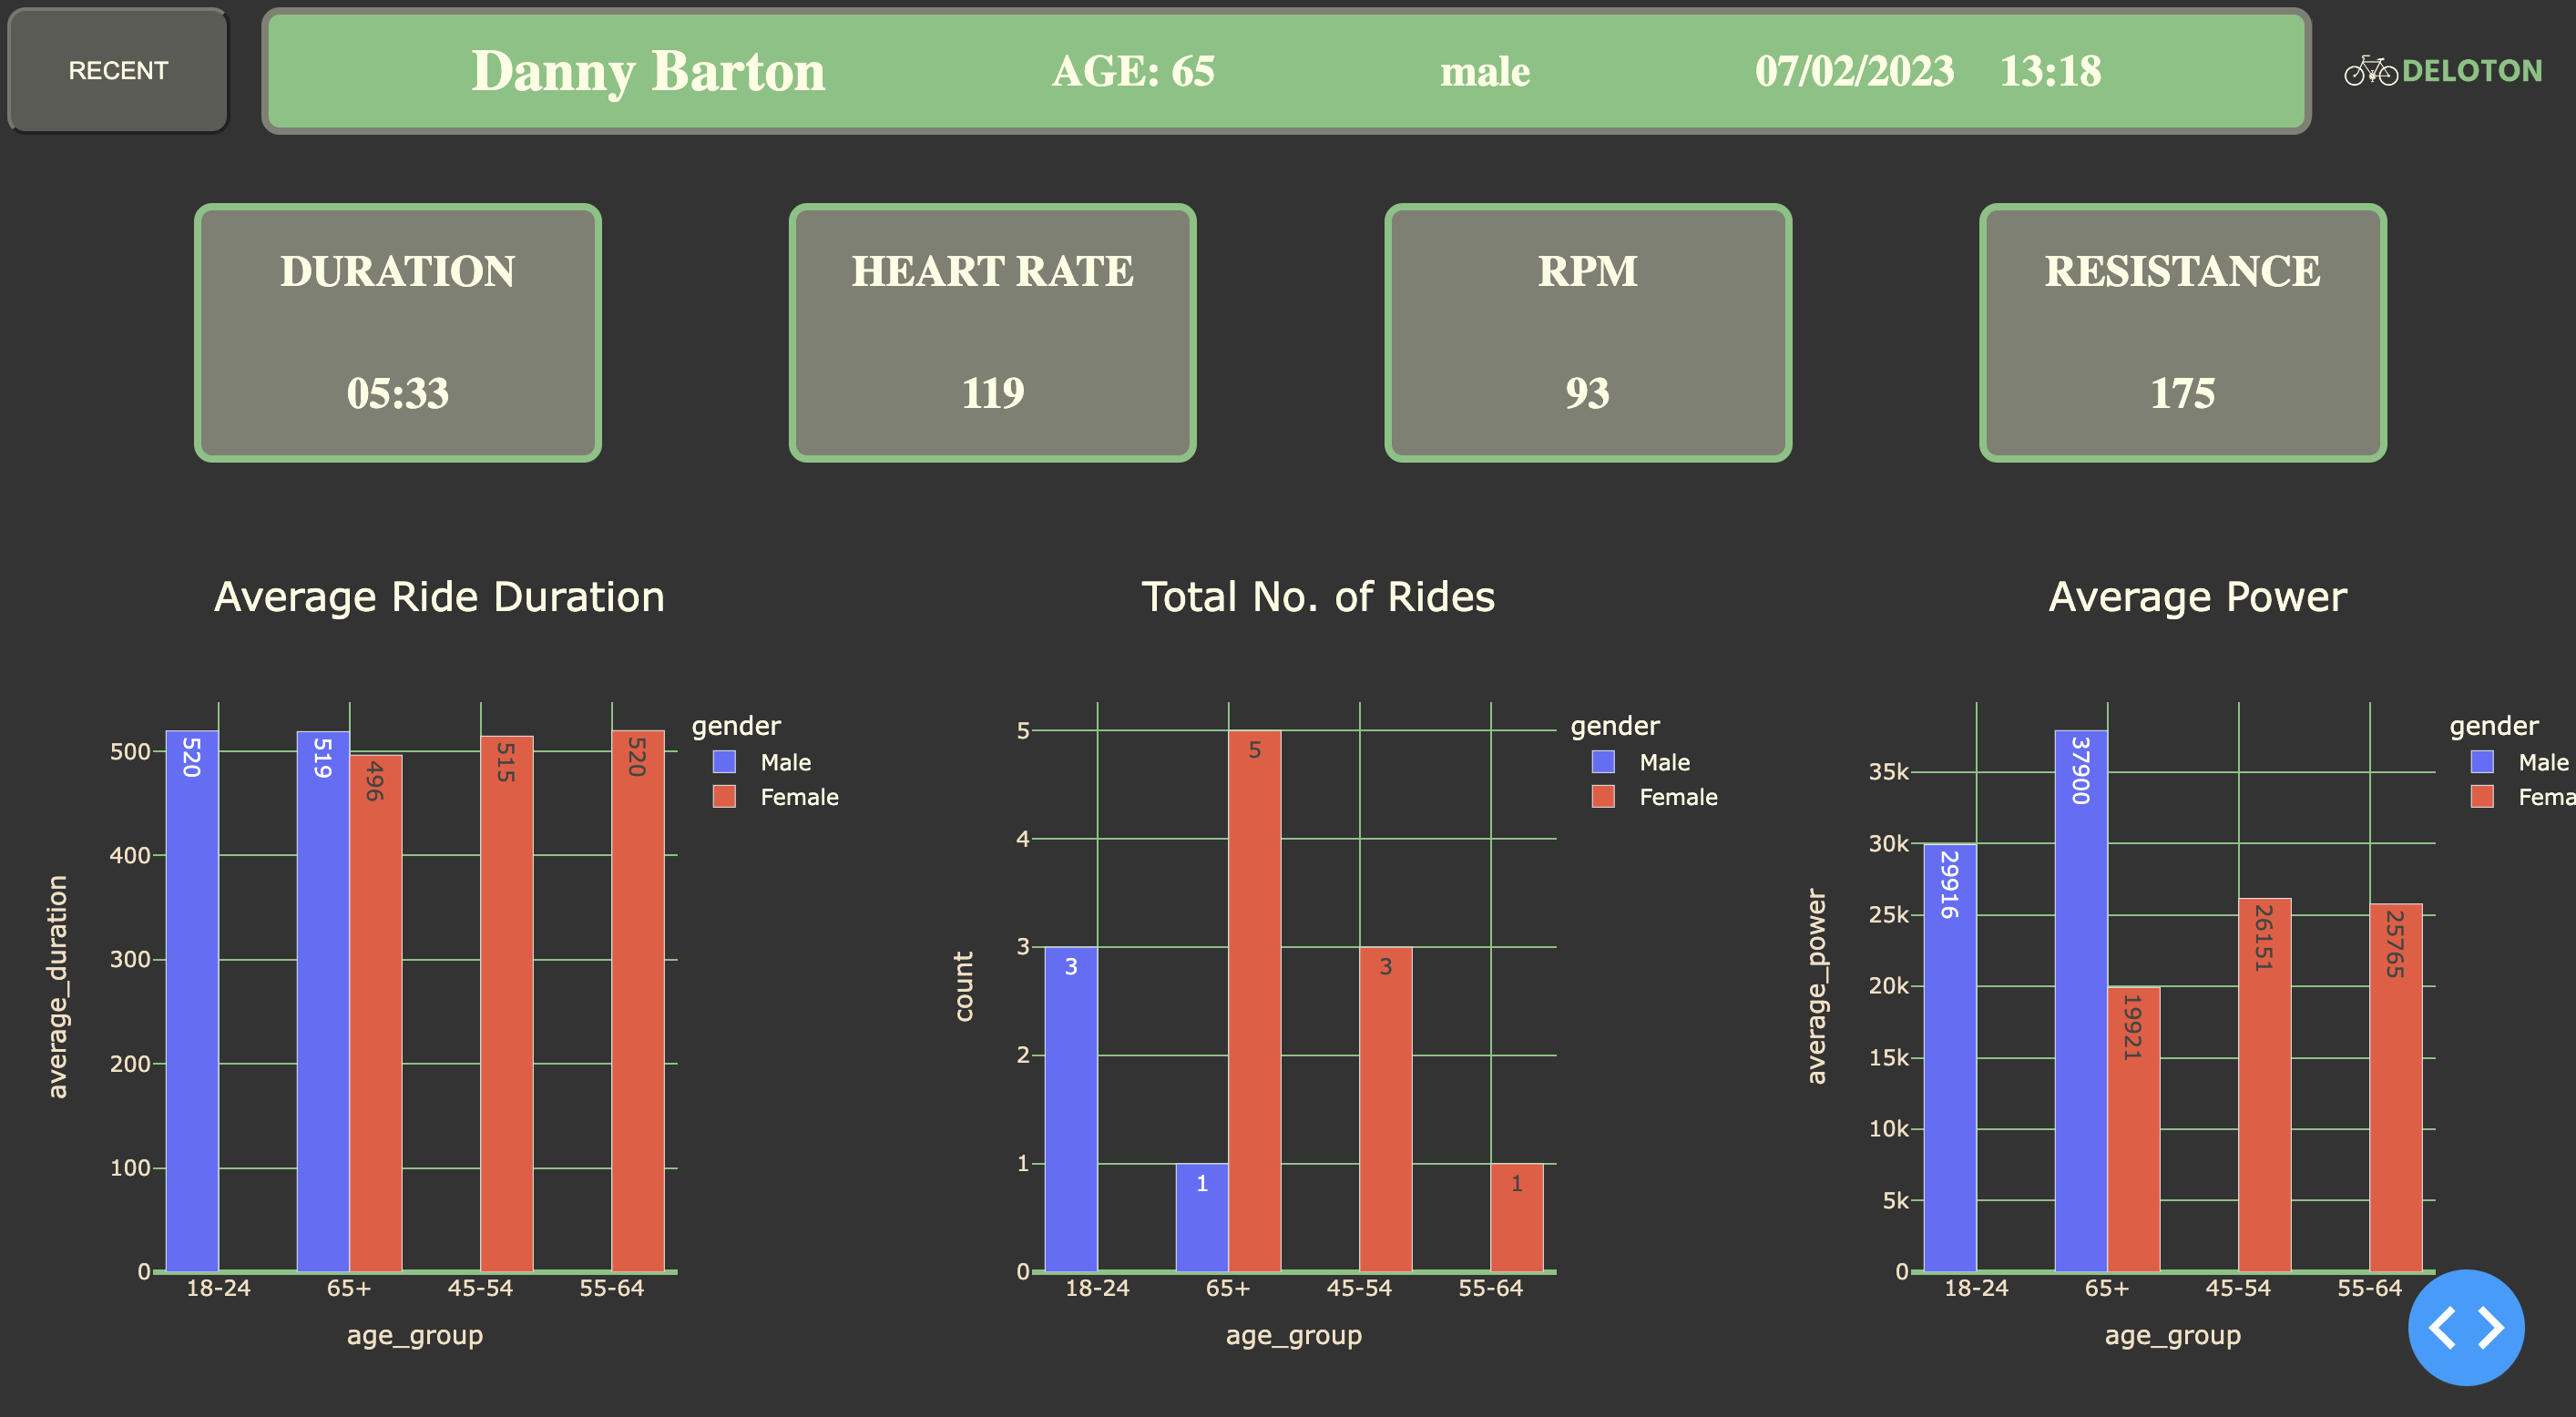
- Real-time dashboard display of current user ride and recent ride history
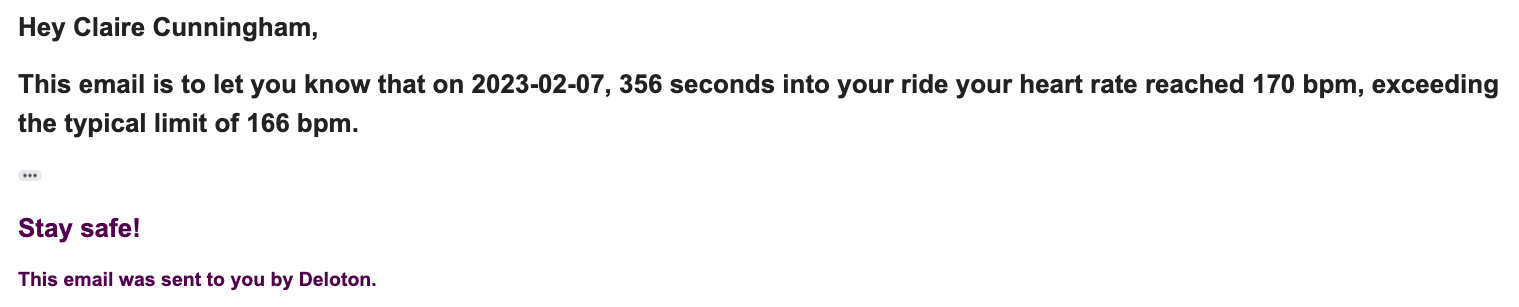
- Automated email service for excessively high heart rate
- Long term storage of user data for prospective business analysis
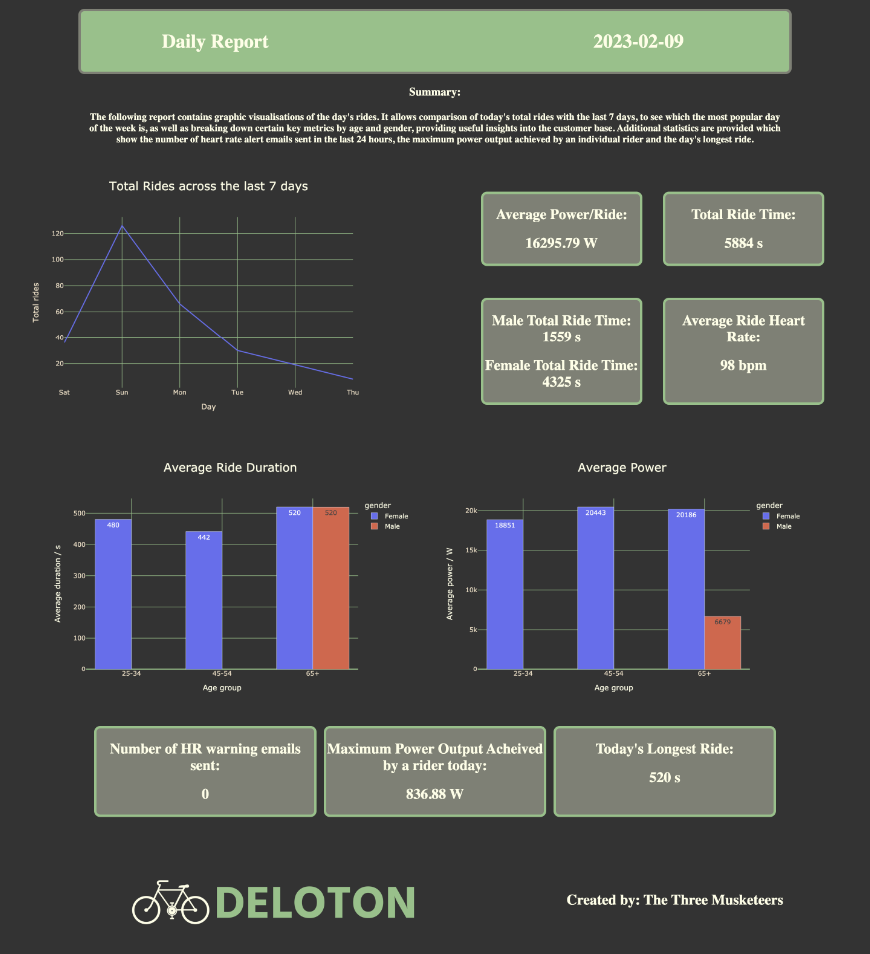
- Automated daily report summarising key metrics
- RESTful API
- Tableau integration to perform data querying and dashboard creation
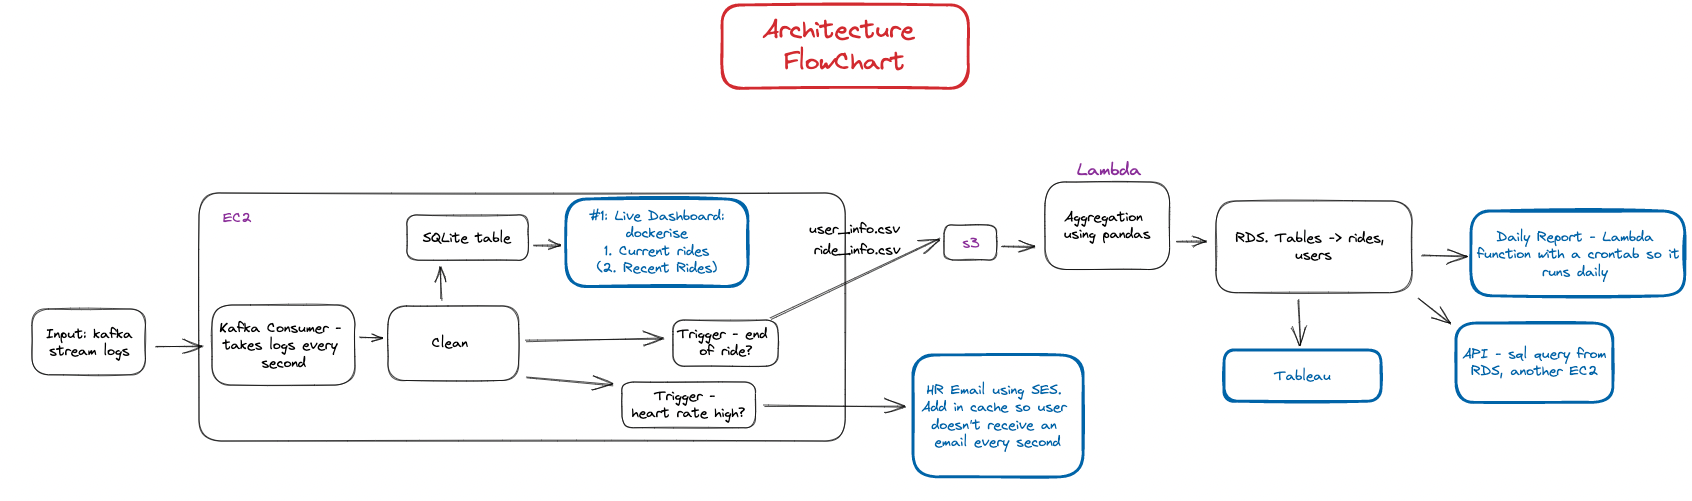
- Kafka consumer polls the Deloton topic receiving two logs per second.
- Combines the two logs into one containing all the data for that second of the ride. Passes into SQLite table ready for querying from the Live Dashboard. Also creates user information table to store the current users details
- When user heart rate exceeds heart rate limit during the ride, calculated as a function of the user's age, email alert sent using Amazon simple email service (SES)
- At the end of the current ride, two csv files (user_info & ride_info) sent to s3 bucket. Tables are wiped for the next ride's data
- AWS Lambda function reads csv files from s3 bucket and extracts key metrics (using Pandas) for long term storage in AWS RDS PostgreSQL table
- RDS comprised of two tables, users and rides, joined by user_id
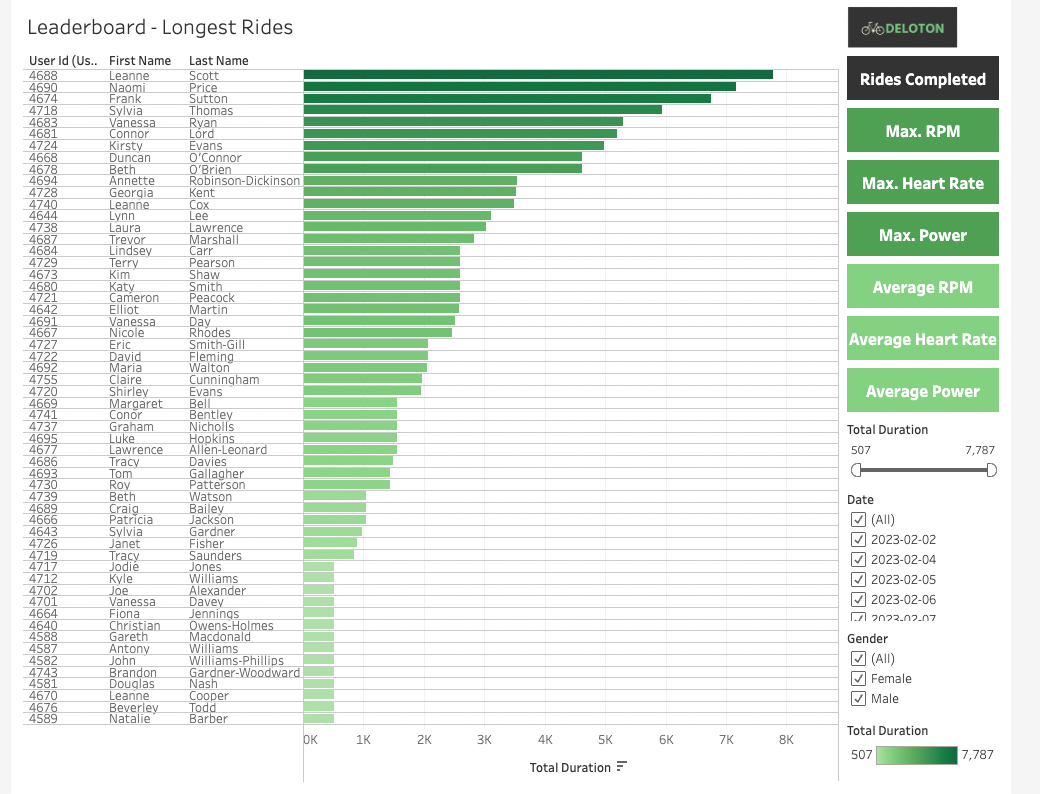
- Tableau dashboard connected to RDS schemas and visuals created from it, live streaming the information
- API hosted using AWS API Gateway, integrated with AWS Lambda Functions
- Daily report hosted on AWS Lambda, extracting key metrics and formatted as an insightful summary, ran daily using Crontab
- You will find the live dashboard up and running here: Live Dashboard
- Top left button allows user to switch between viewing the current ride (user details along with their current performance) and recent ride details. If you would like to host run the dashboard yourself:
- Create your own EC2 instance and run the following commands
NOTE: python3.10 is required for the most up to date version of pandas. The link to install this new version into your EC2 instance can be found here
sudo yum install gitsudo git clone git@github.com:sebjshaw/Deloton-Project.gitcd Deloton-Projectsudo pip3.10 install -r requirements.txtsudo amazon-linux-extras install redis6sudo pip3.10 install sqlalchemysudo pip3.10 install psycopg2-binary./run_files.sh
API can search the following endpoints:
GET /ride/:id
Get a ride with a specific ID
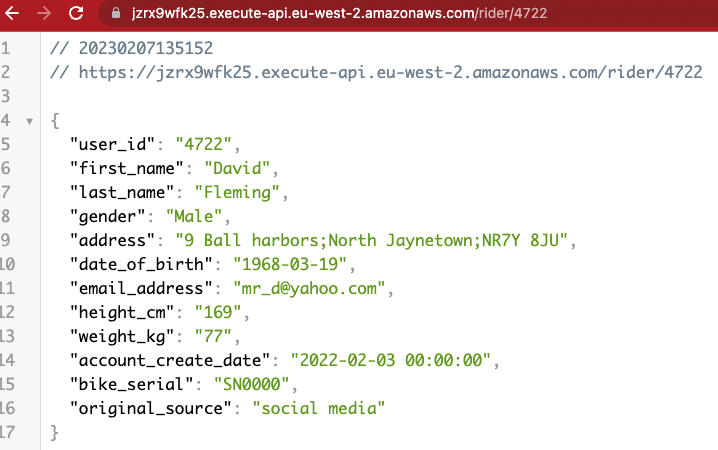
GET /rider/:user_id
Get rider information (e.g. name, gender, age, avg. heart rate, number of rides)
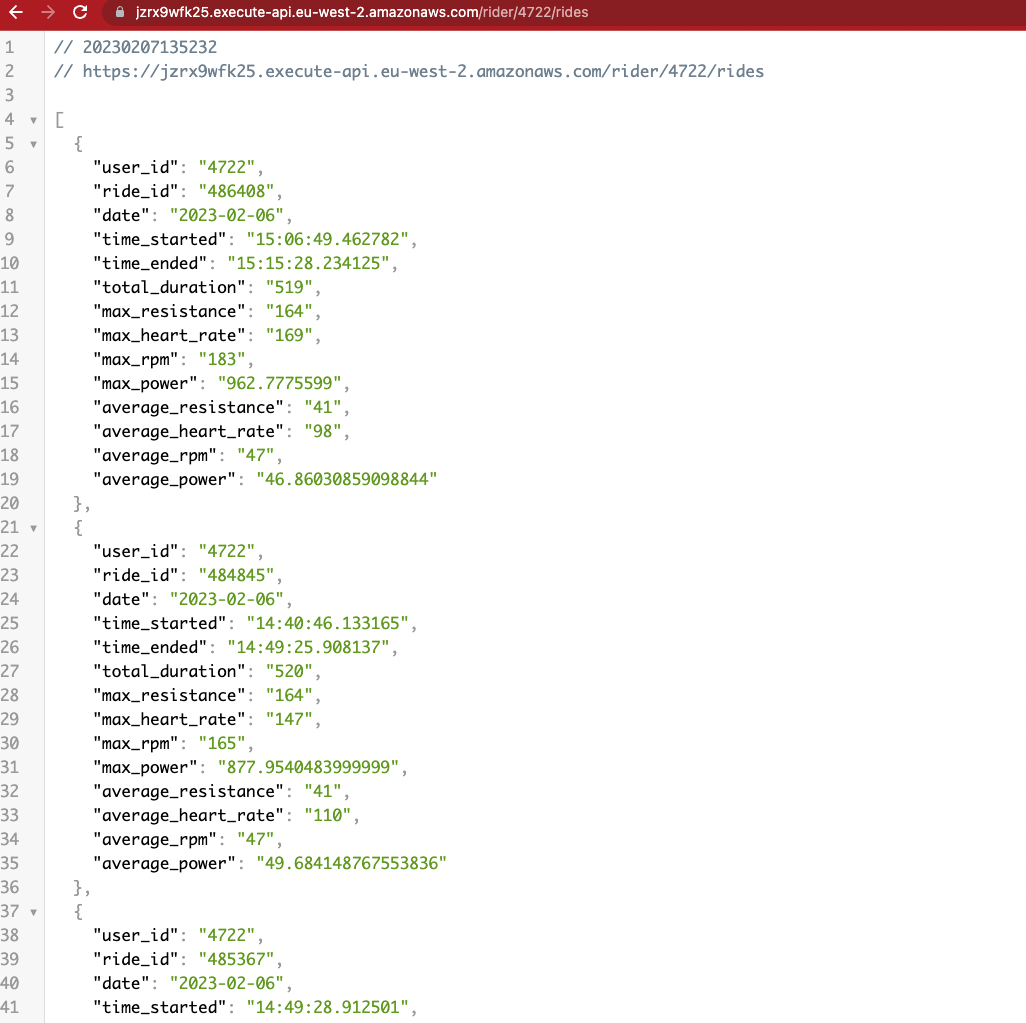
GET /rider/:user_id/rides
Get all rides for a rider with a specific ID
DELETE /ride/:id
Delete a with a specific ID
GET /daily
Get all of the rides in the current day
GET /daily?date=01-01-2020
Get all rides for a specific date
16:45 every day, a daily report is generated and sent off to the Deloton CEO's email detailing main findings over the last 24 hours. Included in email as a link to today's report as well as a link to a list of past reports. Both links will download a html file for the CEO to view in their browser. This process is automated using a Crontab
- EC2 hosting Kafka data stream automatically alerts user when their heart rate exceeds a certain level
- Heart Rate Level calculated by age
- Currently, emails sent to this address: three.musketeers.deloton@gmail.com, as user emails are not real
- Create a Tableau Cloud account if not done already (Tableau).
- Following link to Deloton-Project prompts a login with AWS RDS credentials. Postgres account login details provided on day of presentation.
- Dashboard consists of eight pages, each of which a leaderboard for the top users for that measured metric i.e. Number of rides completed by user, Highest average heart rate per ride per user.
- User may navigate via the buttons on the righthand side of each page
- Filters by gender, minimum & maximum value, and date of ride for interactability
Direct contributors to the repository:
- Seb Shaw: sebjshaw
- Dominic Lawson: DomLaw82
- Alexander Skowronski: AlexSkowronski2
Resources used:
- Pandas
- Amazon Web Services
- API Gateway
- EC2
- ECR
- Lambda
- S3
- RDS
- SES
- Tableau Cloud
Suggestions for additional features
- Button to change the theme of the dashboard between light-mode and dark-mode
- Backtrack kafka logs to find user info when starting the EC2 middway through a ride
- Authentication layer
- Customise the summary in the report to be a bespoke overview of that specific days metrics and insights.
- Have a !!WARNING!! at the top of the page if there are more than 5 heart rate emails sent in one day
- Having a dedicated email address for sending heart rate exceeding limit email to a user's email that they have verified.
- Age bin filter on Tableau dashboard for filtering specific ages of users, suggested bins could be: under 18s, 18-25, 25-35, 35-45, 45-55, over 55s
- Perhaps adding in resistance dashboard onto Tableau dashboard
- Parse through postcodes of users and have a map indicating where a current ride is happening or heat map of existing ride locations
- Clone repo and create a new branch:
bash $ git checkout https://github.com/alichtman/stronghold -b name_for_new_branch - Make changes and test
- Submit Pull Request with comprehensive description of changes
Welcome to the first edit - Alex Another edit - this time Seb Another edit - Seb again