Outline
This package is created with the goal of simplifying data processing and analysis. https://github.com/sergiinichenko/dataNodes
- a set of nodes for loading and reading data
- data processing node for cleaning and removing NaN data
- separate and combine data for convenience of work
- plot the data
- show data in a table format
- Python 3.x
- PyQt5 or PySide2 (using wrapper QtPy)
- matplotlib>=3.4.0
- pandas>=1.2.0
pip install -i https://test.pypi.org/simple/ datanodesOr download the source code from gitlab
git clone https://github.com/sergiinichenko/dataNodesOr download the source code from gitlab
git clone https://github.com/sergiinichenko/dataNodesTo be able to run the DataNodes you have to create a minimal python script and run it, e.g. datanodes.py file
# the datanodes.py file
import sys, os
from PyQt5.QtWidgets import QApplication
from datanodes.core.main_window import MainWindow

if __name__ == '__main__':
    app = QApplication(sys.argv)
    wnd = MainWindow()
    sys.exit(app.exec_())
Then you can use any python IDE to run the script (VSCode, Spyder3, etc.) or run it from the console by running:
python3 datanodes.pyThis script will start the DataNodes.
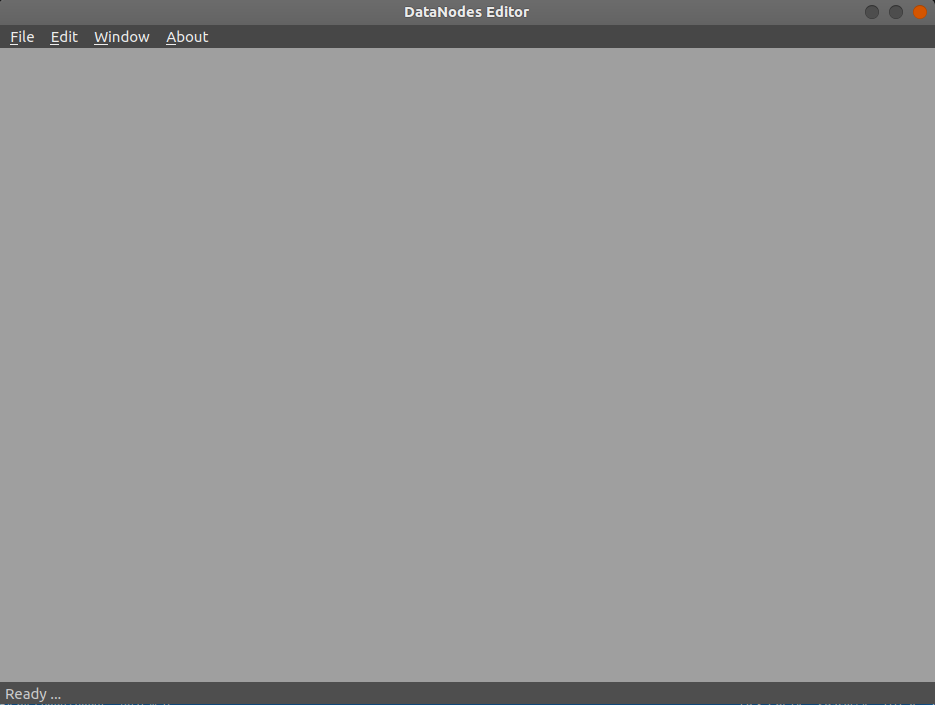
Once you run the DataNodes you will see the empty screen of the DataNodes editor window.
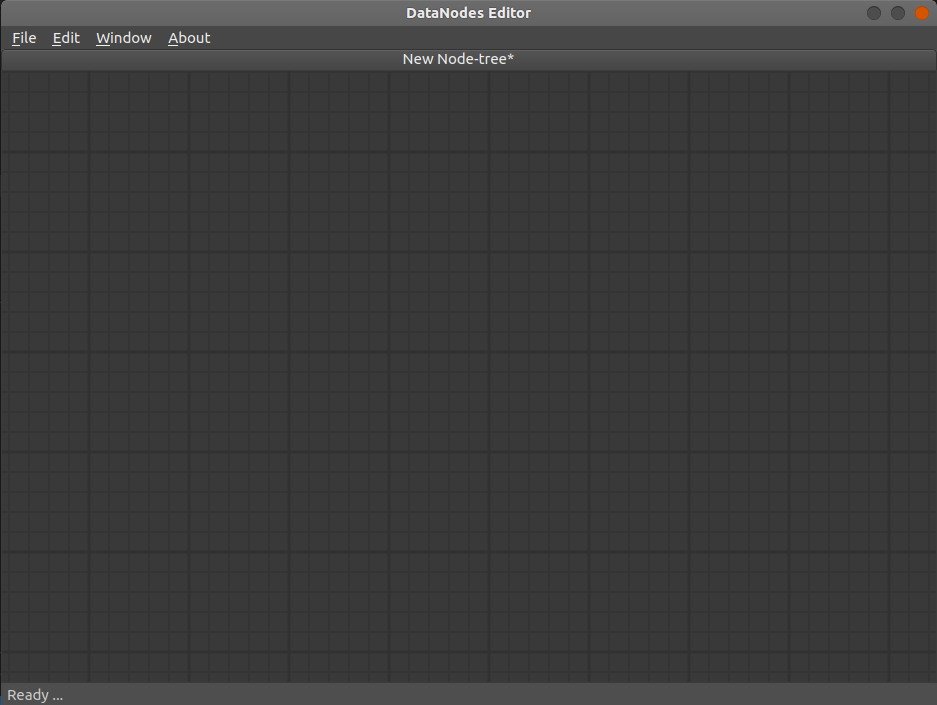
You can use ether the main menu to creat new file (File > New) or by using the "Ctrl+N" shortcut. You can create any number of new files which will appear as new tabs in the main editor window. Here you see how the new file looks like. It allows you to zoom-in and zoom-out using your mouse wheel and to pan around using your mouse middle button.
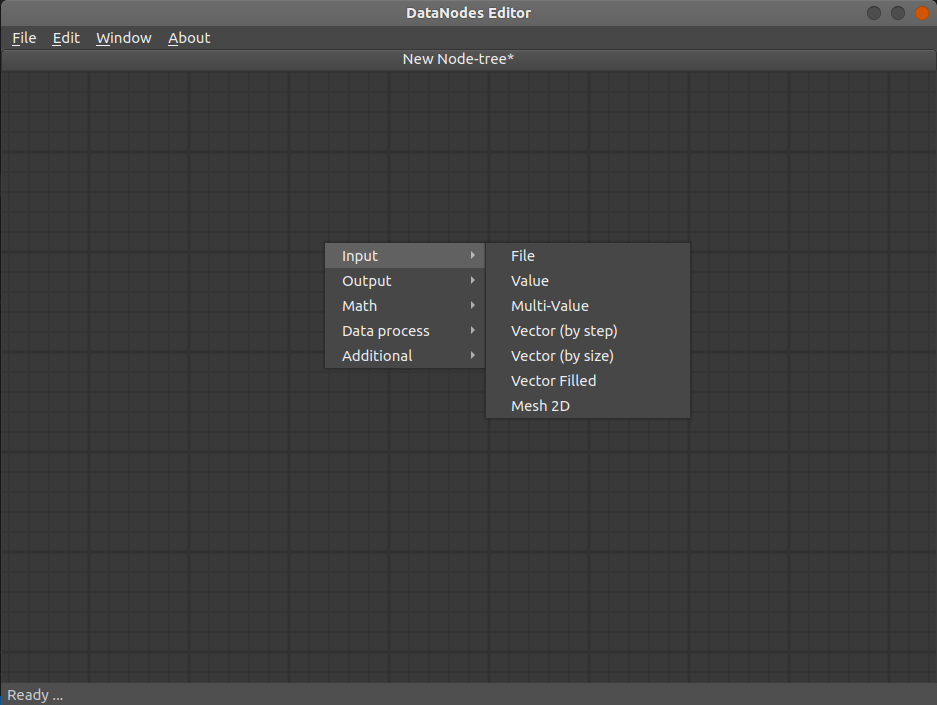
To start working with the data in the DanaNodes you need a source of data. You can drop one of the input nodes into the editor window to start working. There are a number of options among which is the File Input node. To create new File Input node press the right mouse button to call the context menu. From the context menu select (Input > File).
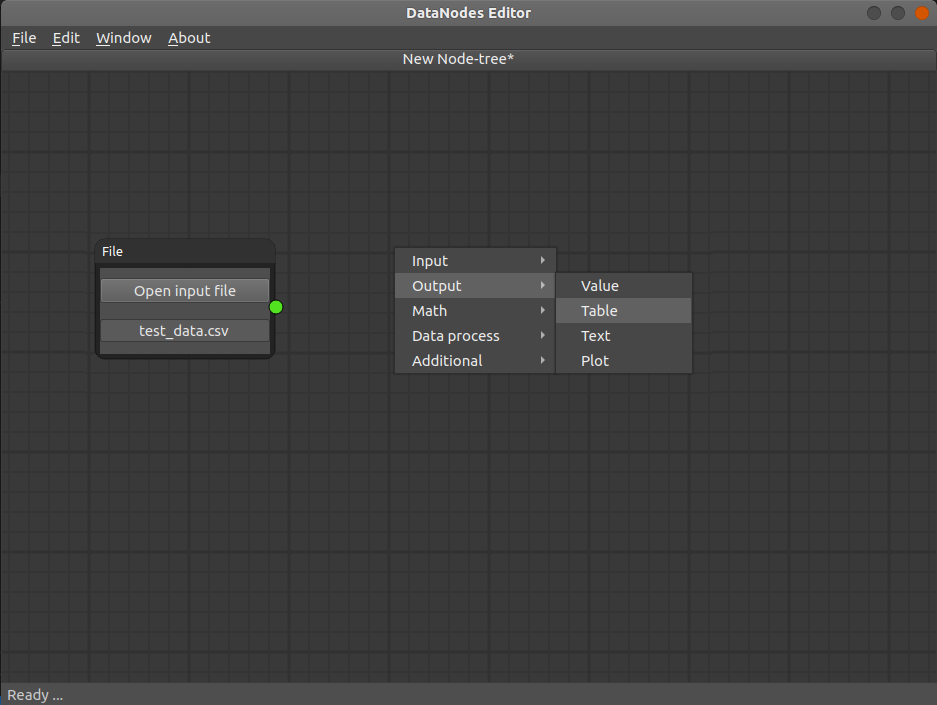
This will create the Input File node which will have a yellow round color to it and an exclamation mark. This means that the node does not have currently any input files to read the data from. Press (Open input file) button on the File Input node and select the test_data.csv which can be downloaded from this repository (in the example folder). Now to see the data that is read by the File Input node you can use the Table Output node. Call the context menu (right mouse click) and select (Output > Table). The newly created Table Output node will as well have a yellow tint to it and an exlamation mark. This is due to the fact that there is no input data provided to this node.
And here we come to the main concept of the DataNodes package: the data between the nodes is being transfered from the output "socket(s)", located on the right side, of one node to the input "socket(s)" of another node(s), located on the left side, through an edge(s).
To see this concept in action you have to connect the output socket of Input File node (yellow dot on the right side of the File Input node) to the input socket of the Table Input node (yellow dot on the left side of the Table Output node). Press once with a left mouse button on the output socket of the File Input node and you will see and edge that is being dragged from the socket to the mouse cursor. Now move the mouse cursor to the input socket of the Table Output node and press left mouse button again. The edge will snap to the socket and the two nodes will connect through the newly created edge. And the data will be transfered from the File Input node to the Table Output node.
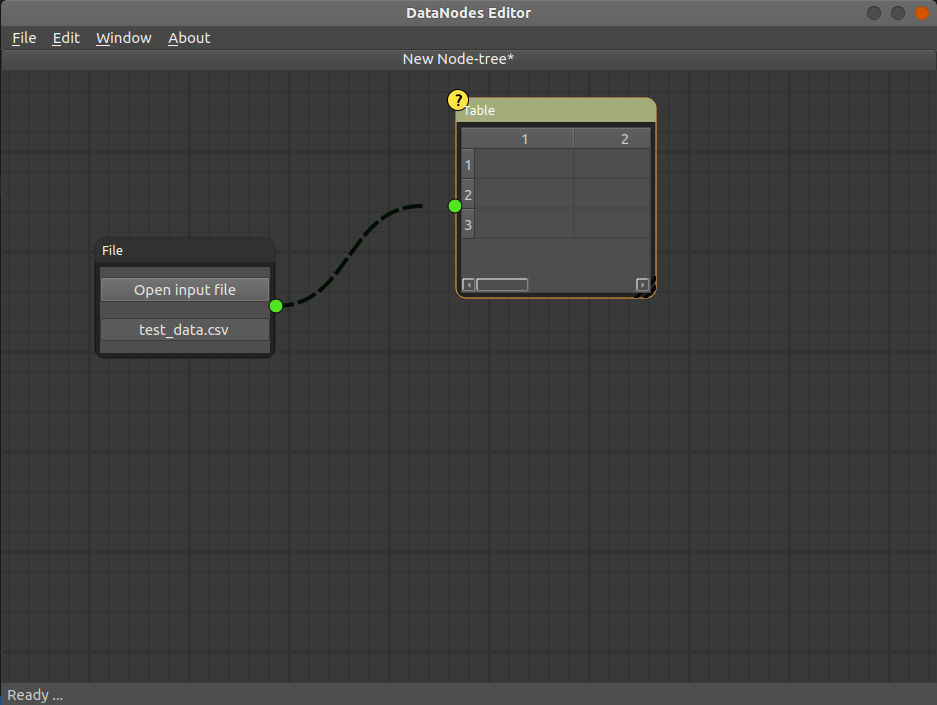
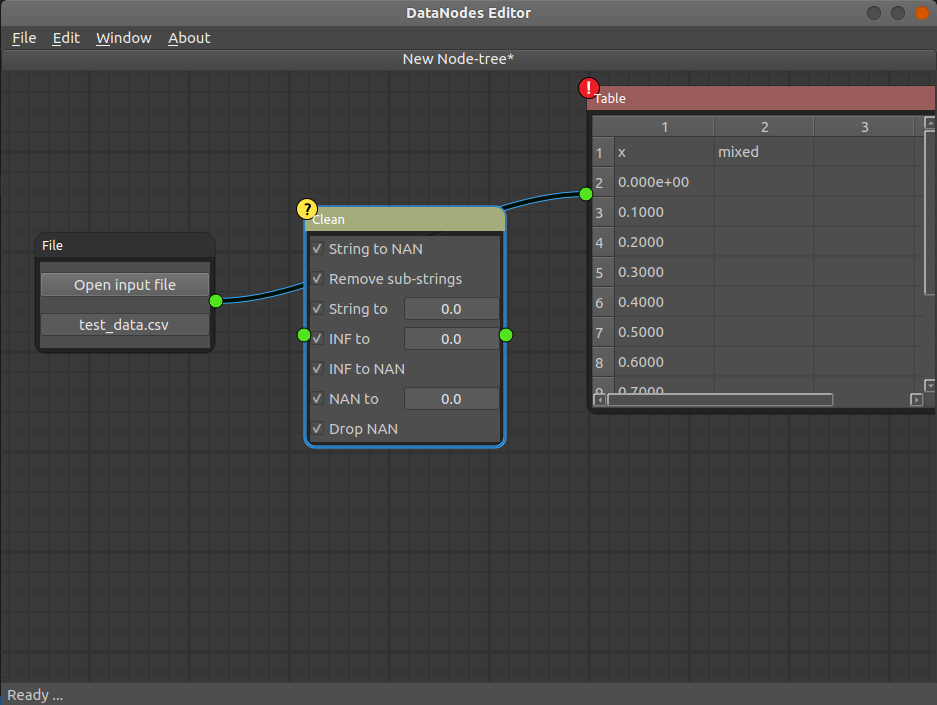
But you will not see the data currently. That is because the data that you are reading from the file with a File Input node is not "perfect" and contains some entries that have to be "cleaned" before using. That is why the Table Output node is highlightened red.
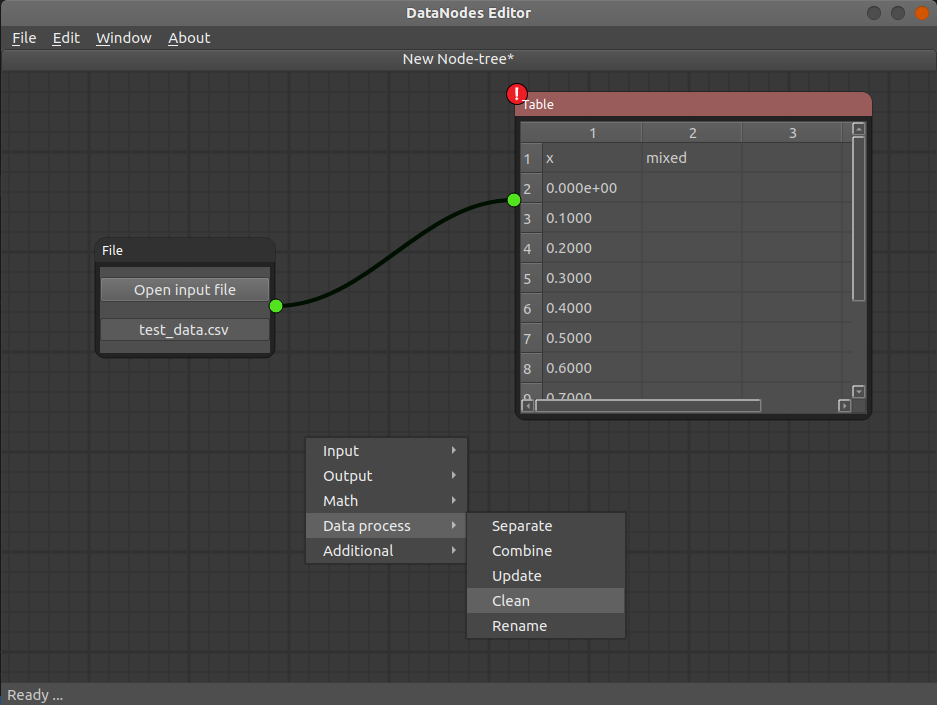
To clean the data you have to use the Clean node. Add it to the editor by calling the context menu and selectig (Data Process > Clean)
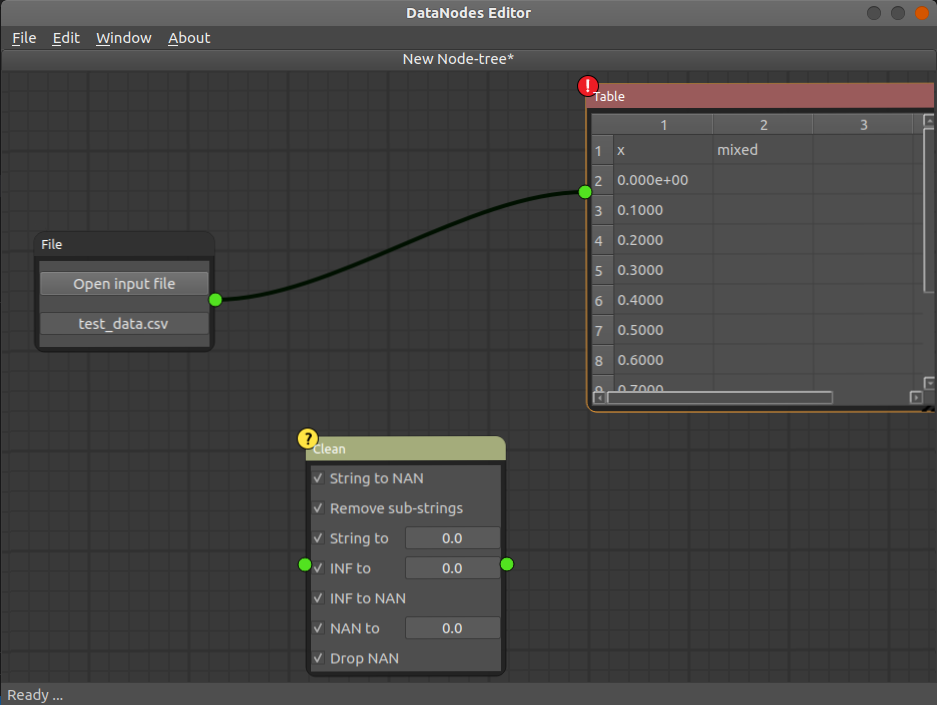
The Clean node is added to the editor. But we have to locate it between our nodes to clean the data from the File Input node before going to the Table Output node.
To do that we could create two new edges from the File Input node to the Clean node, and then from the Clean node to the Table Output node.
But there is a faster way to do it. You just drag the Clean node (by pressing left mouse button on the header of the Clean node and dragging it) on the already existing edge between the File Input node and Table Output nodes. When you will drag the Clean node above the edge it will highlight blue indicating that it is ready to be dropped. When you release the Clean node it will "cut into" the edge and will create two new edges insted of the existing one.
Now, to see the data, deselect the "Drop NAN" checkbox in the Clean node. The details of the Clean node will be explained later in a detailed manual that is being prepared.
But what this node does is it goes through each entry in the data and "fixes" the entries. E.g. it removes substring from the entries of the data if there are some (e.g. entry "123tot" will be fixed to "123"), converts strings to a fixed number (e.g. entry "bad data" will be converted to "0.0"), infinite numbers will be converted to either a number or NaN.
But in our case the data will be cleaned and prepared for later work.
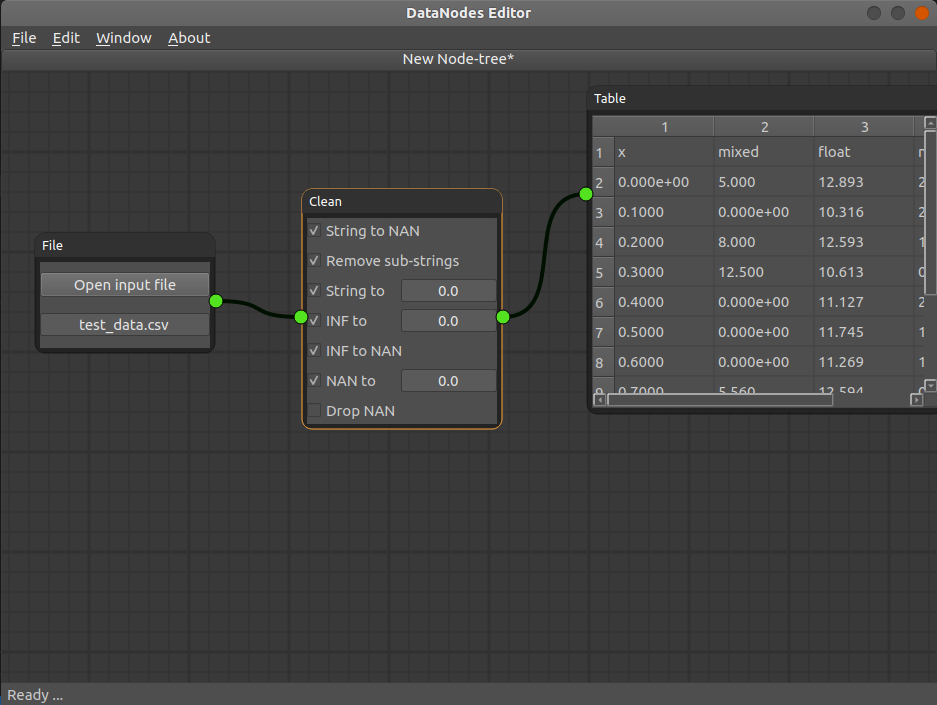
Now you should see the data in the table.
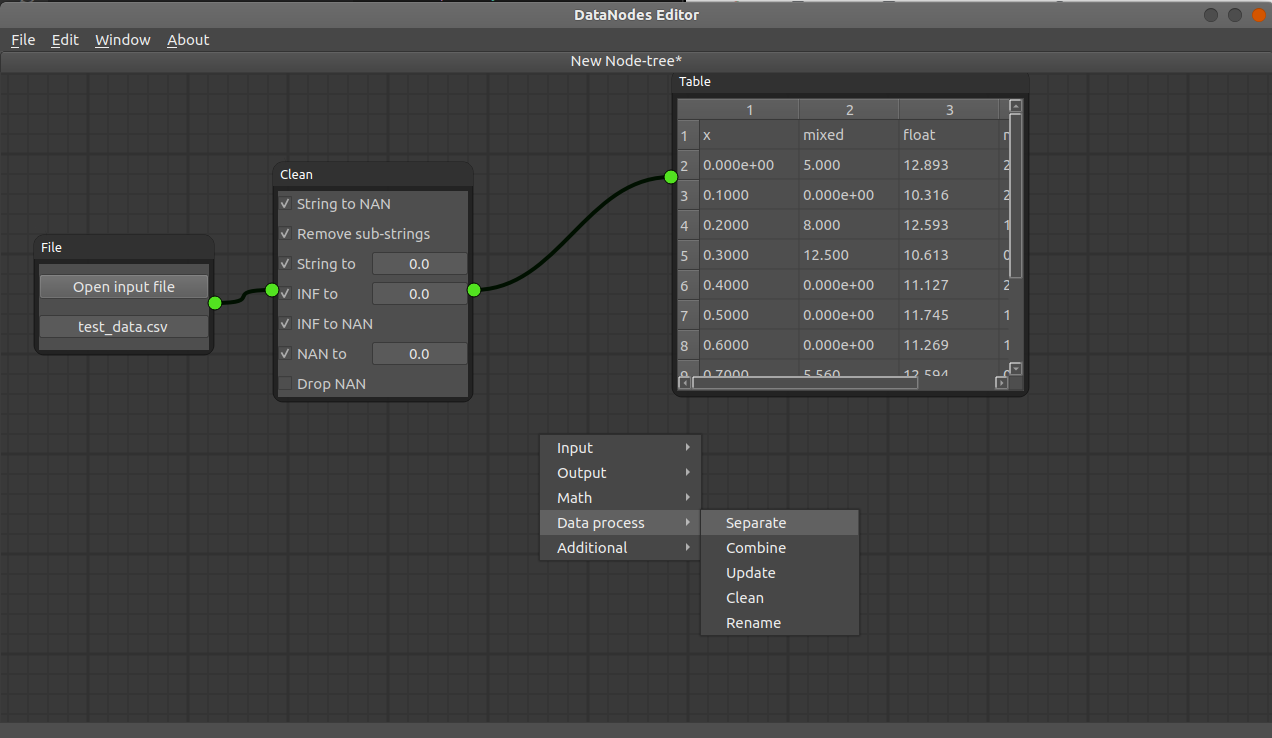
You can further manipulate data.
For exmple lets separate some data and plot it. Add a (Data Process > Separate) node to the scene.
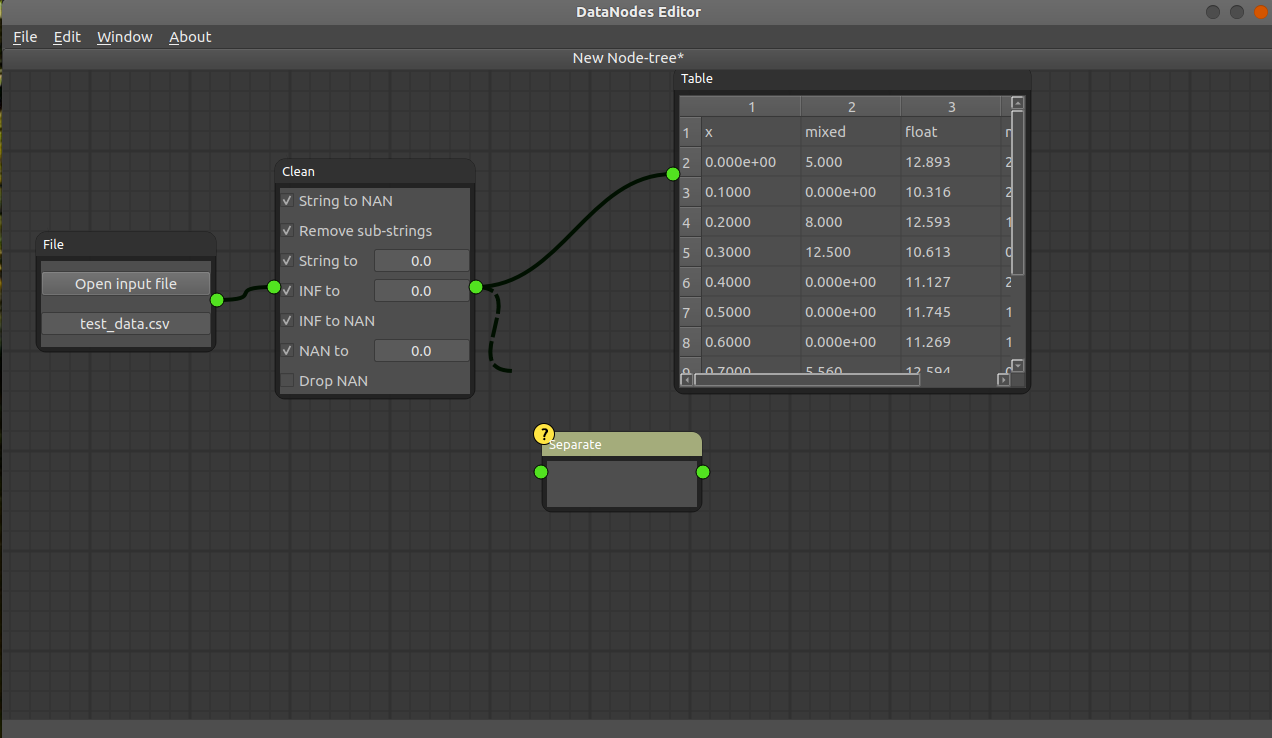
And connect the Clean node output, which provides cleaned data, to the Separate node. You will see a number of the output sockets on the Separate node each corresponding to a certain "column" in the data set from the Clean node.
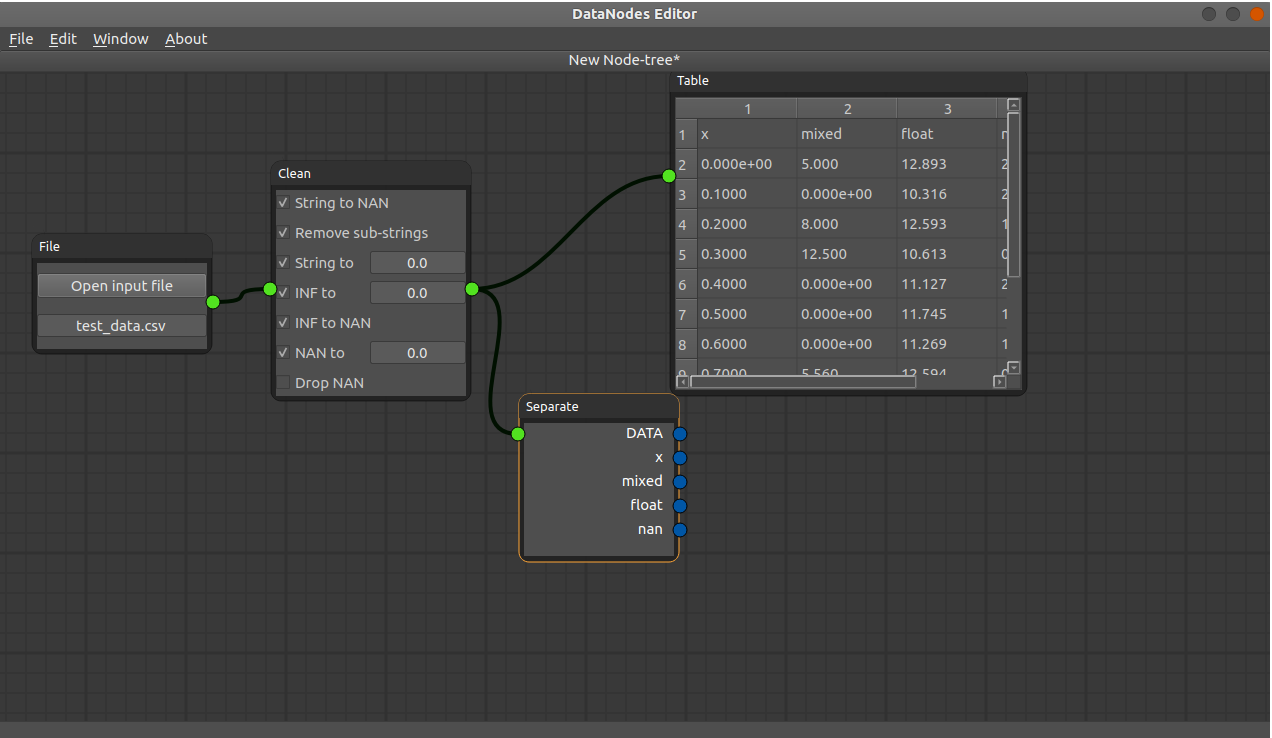
And connect the Clean node output, which provides cleaned data, to the Separate node. You will see a number of the output sockets on the Separate node each corresponding to a certain "column" in the data set from the Clean node.
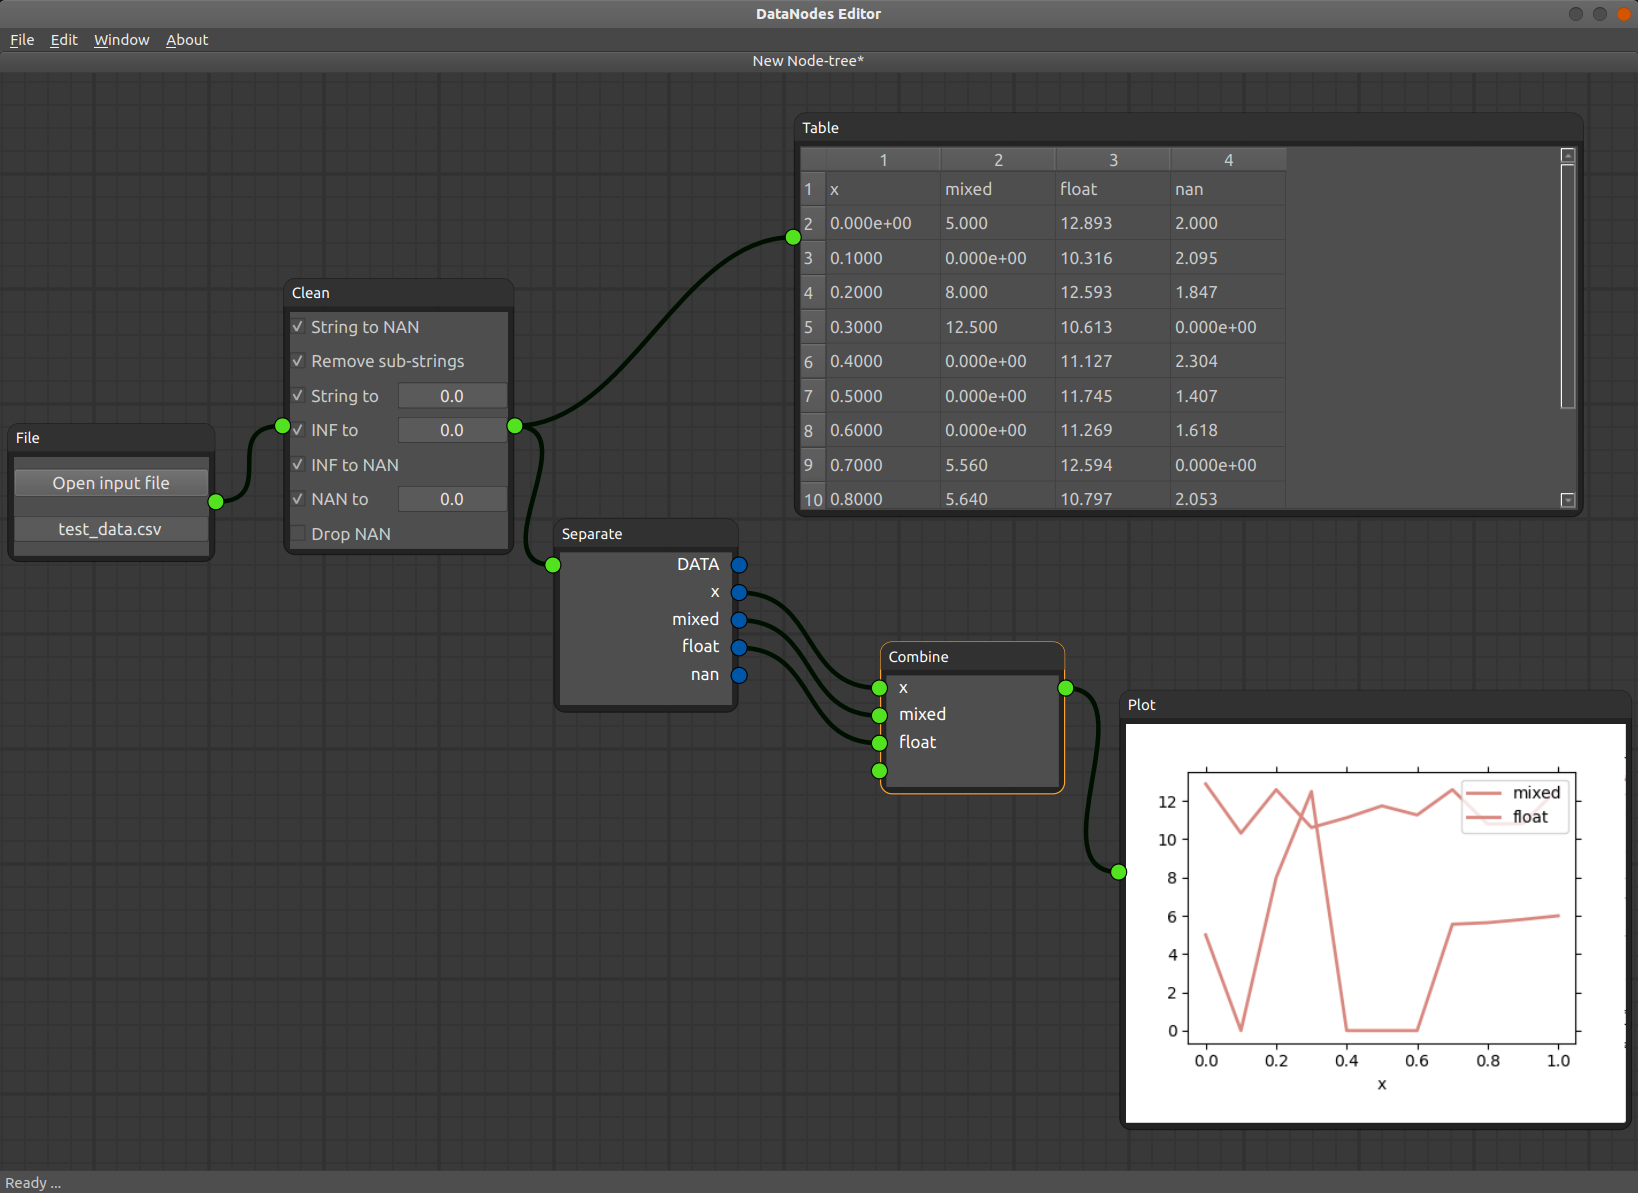
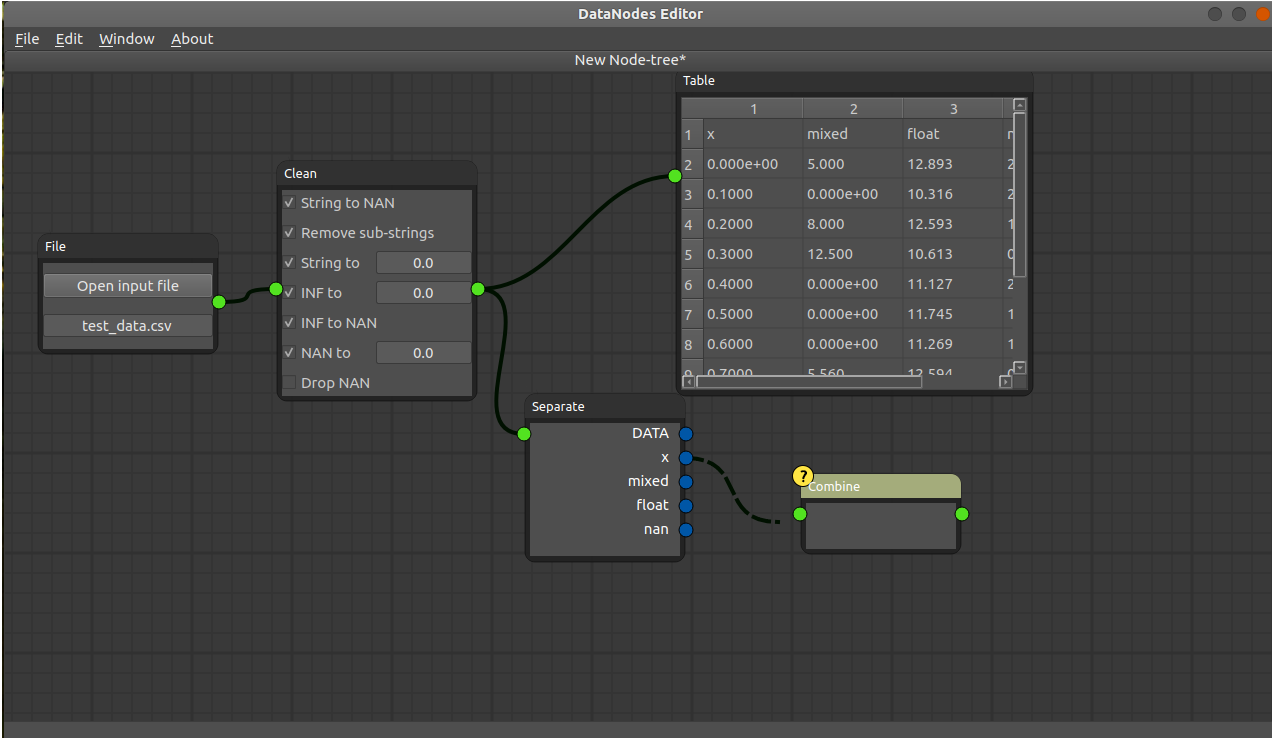
Now you can select a certain set of data to be combined again for later processing or for plotting.
Add a (Data Process > Combine) node and connect "x" and "float" data to the input sockets of the Combine node. Each time you connect an edge to the combine node another input socket will be created to allow for adding more edges.
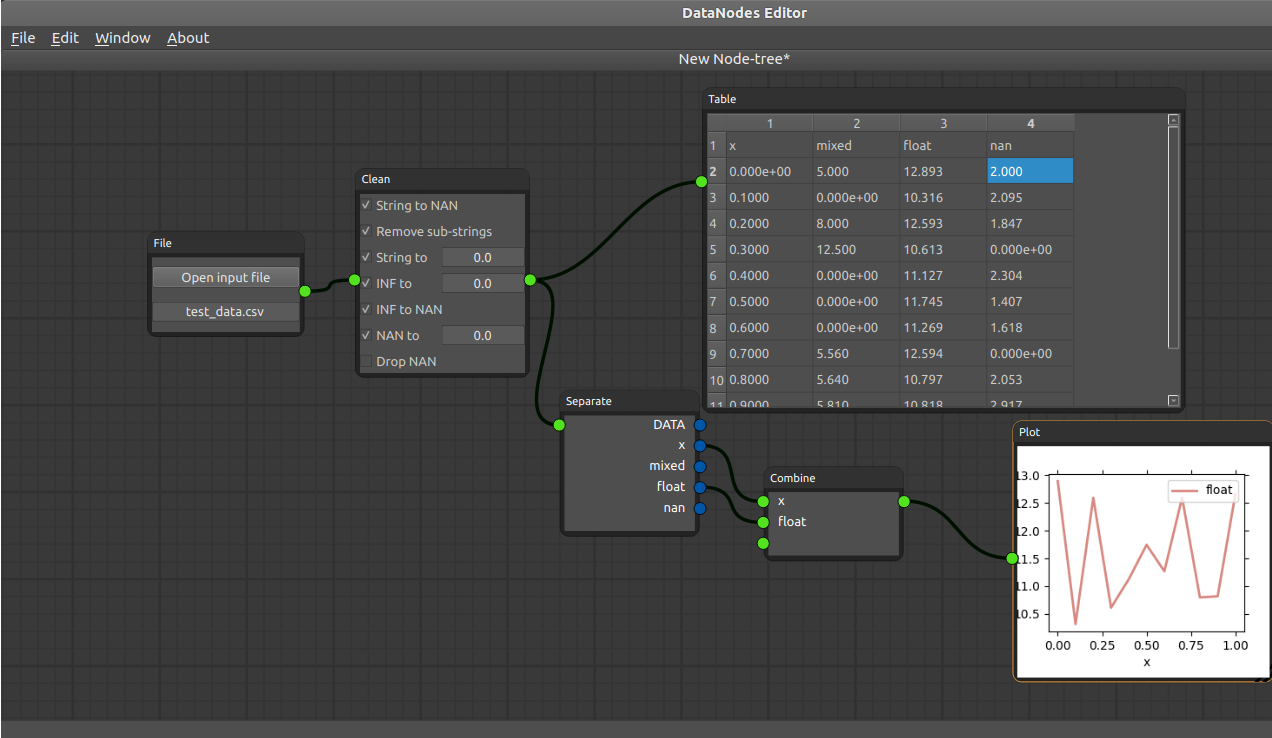
Add a (Output > Plot) node and connect Combine node output socket to the input socket of the Plot node. You will see the data plotted. The first etry of the Combine node will serve as an "x" value and the rest of the data will be plotted against it.
I hope this basic tutorial gives you an idea about what the DataNodes is and how it could be used.
A much more detailed manual will be created soon, which will contain detailed information about each node.
I am constantly working on adding new nodes to the package to make it more flexible and usable. Among the next nodes to be added are:
- general statistics node (min, max, mean, std, etc.)
- cross-correlation plot and talbe nodes
- and more.