A quick single cell data analysis using Scanpy, GSEApy and custom made plots.
When getting a new single cell dataset, I usually find myself struggling to get quick insights from it, so I have built some tools over the last few months that help me get an understanding of the data quite quickly.
Quickscan requires paths to an h5ad file and output directory, as well as the annotations to make the analysis on. You can
also add cell1 and cell2 (and set general=False) and then you will get a 1 vs 1 output (see usage_example).
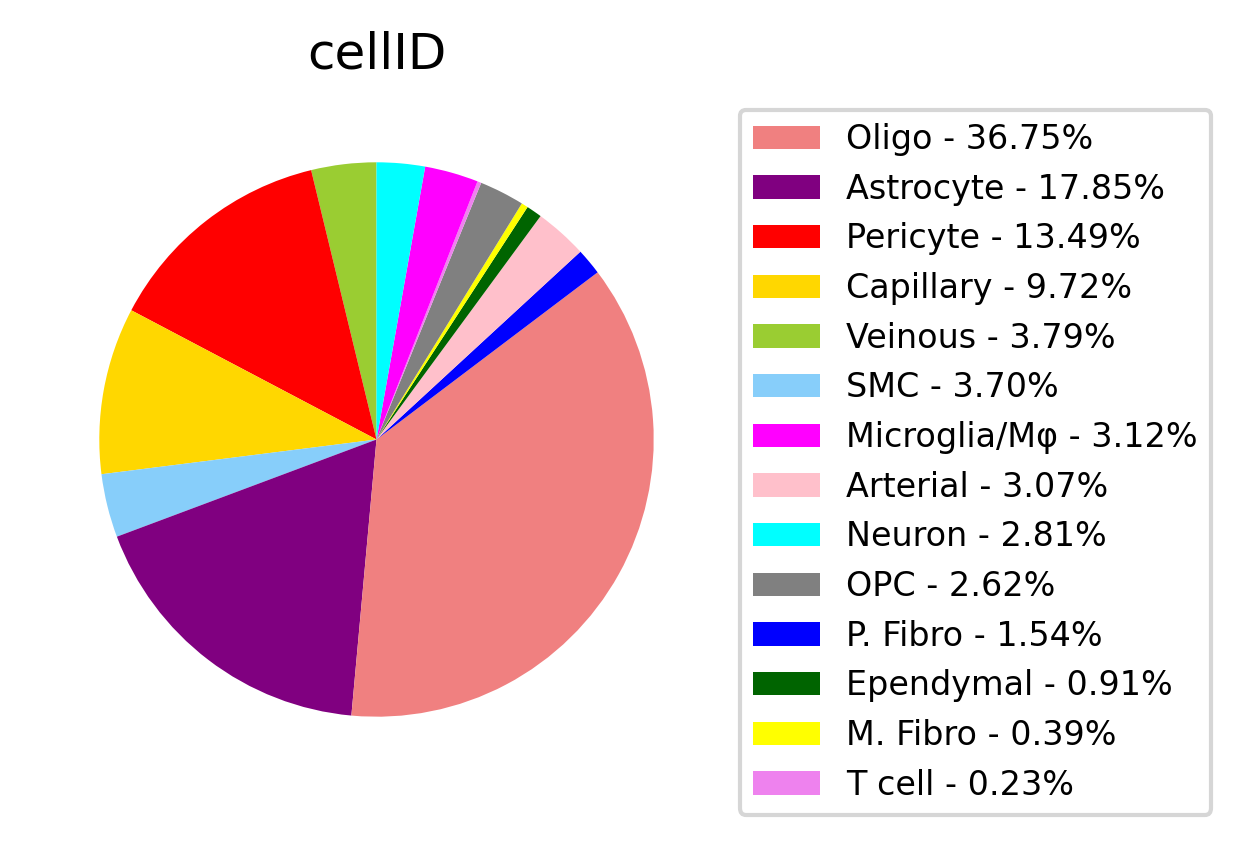
After receiving these inputs, a pie chart will be saved based on the annotations you chose:
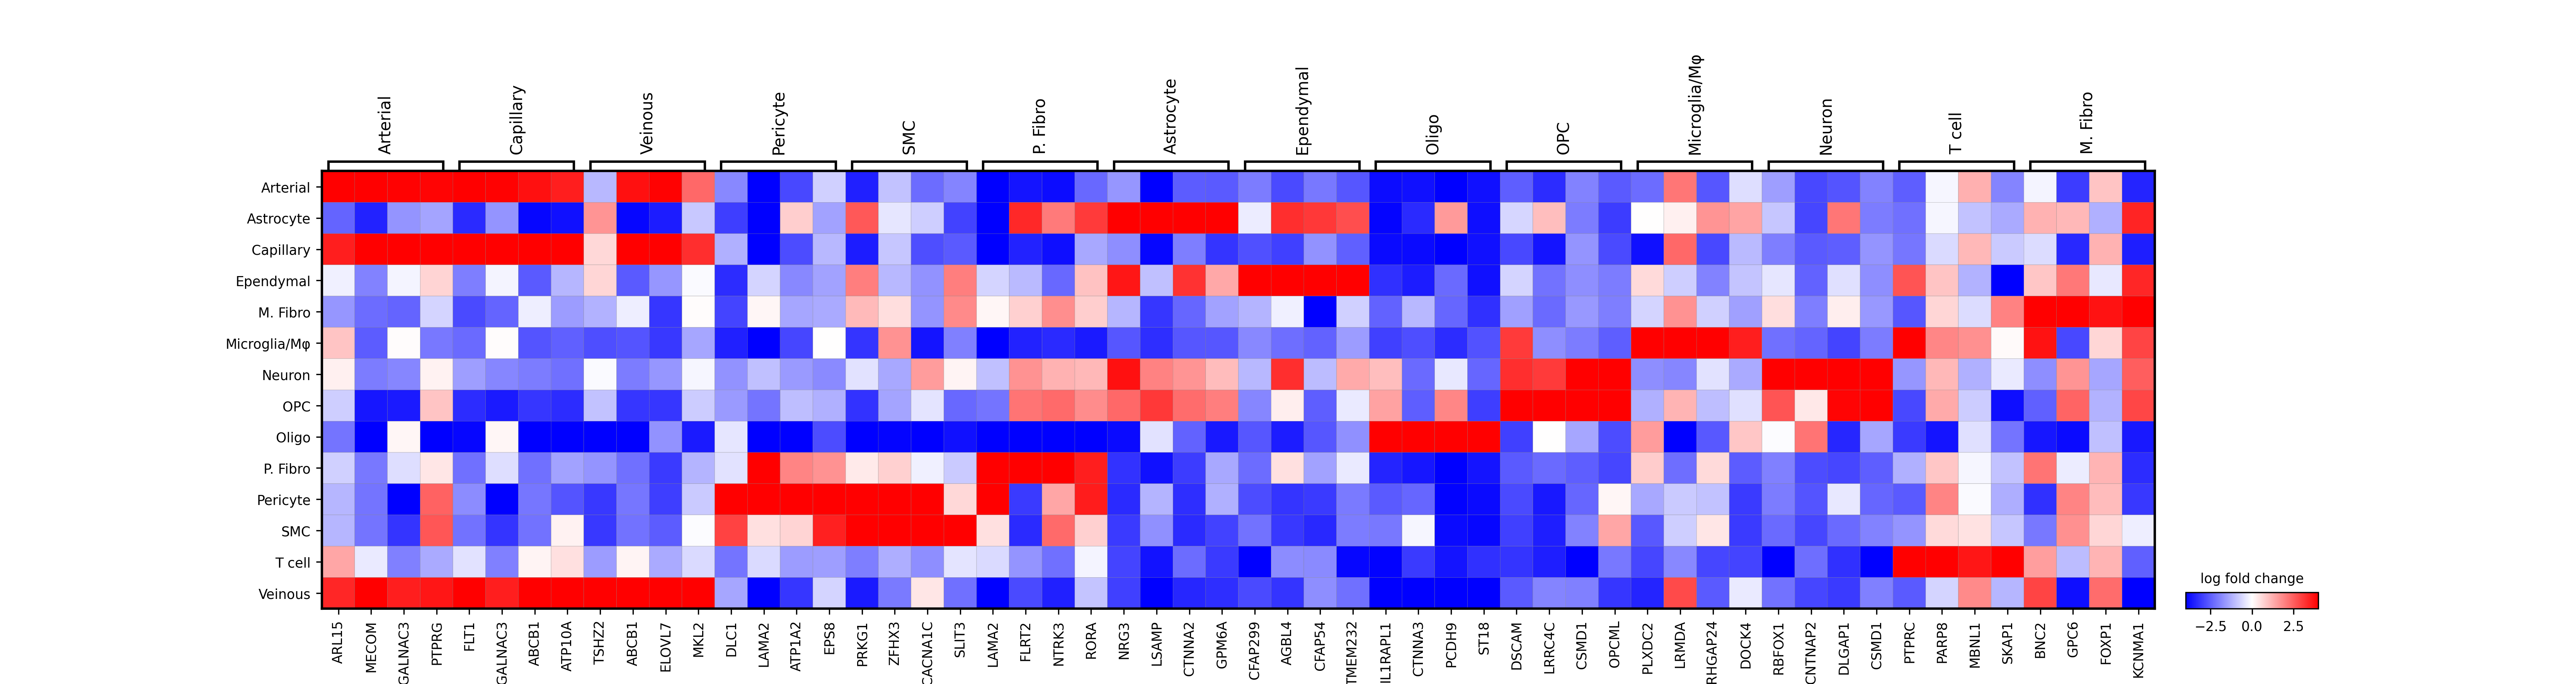
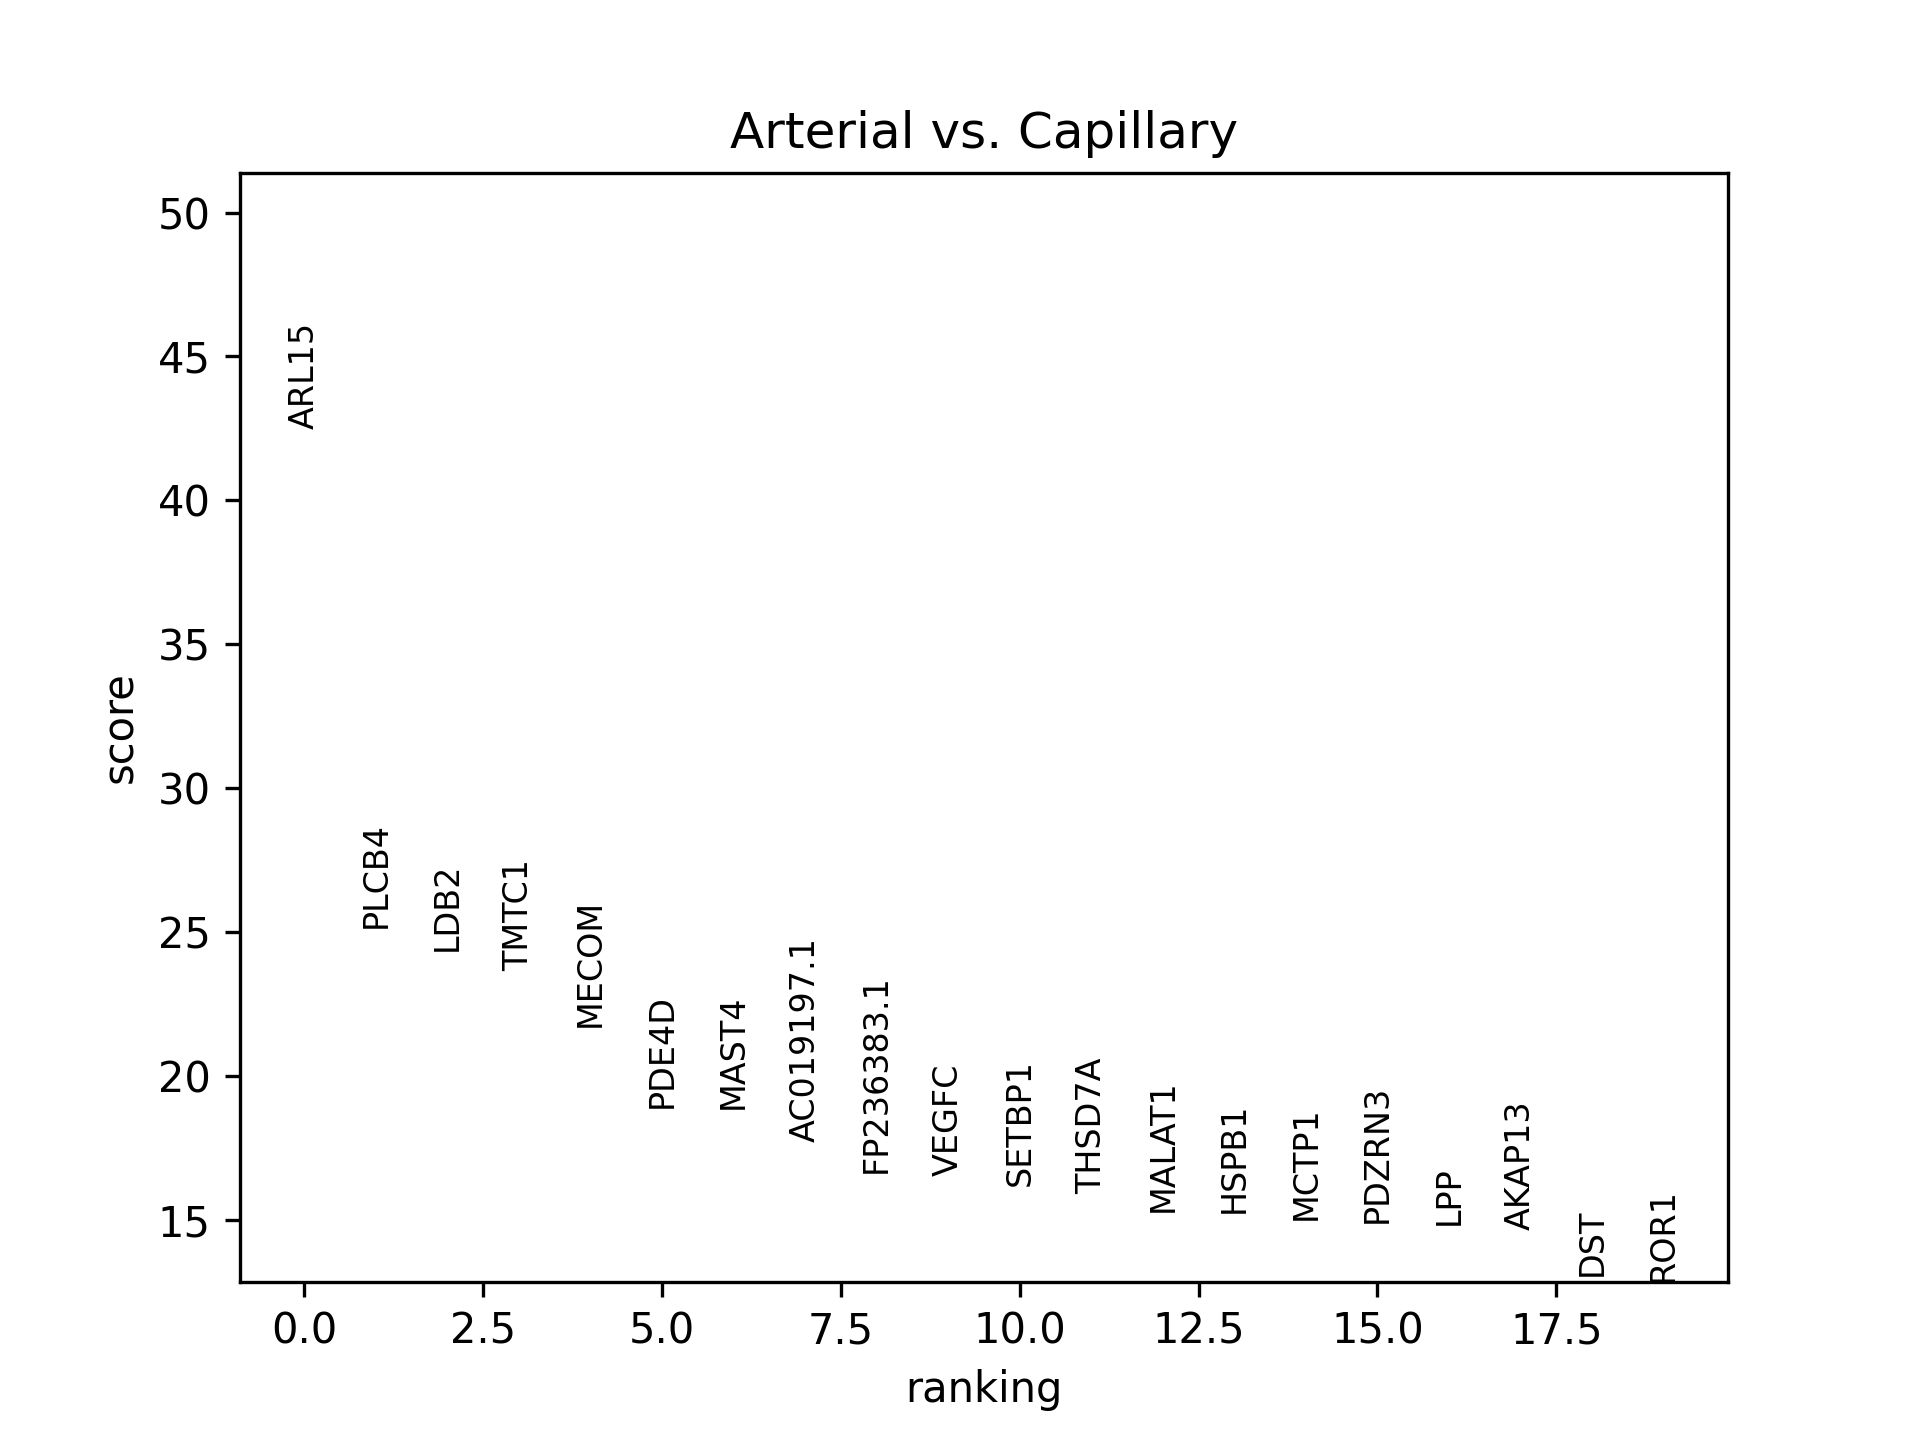
Then, a wilcoxon-test based DEG analysis (from Scanpy) will be performed on the data and some plots will be saved - depeneds if
you chose 1 vs 1 or general option.
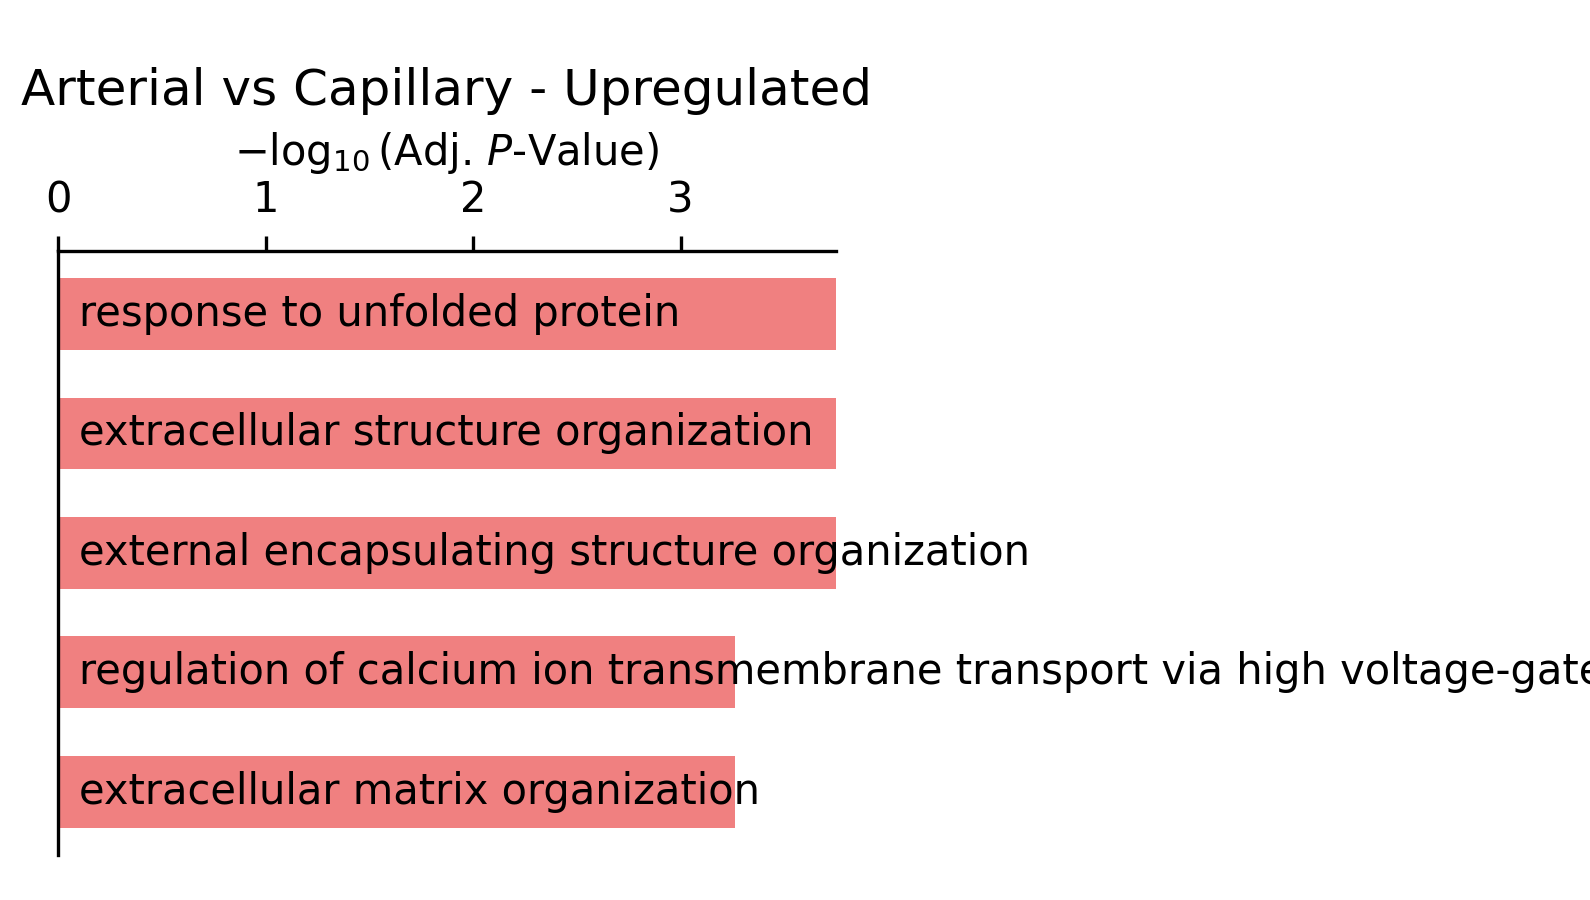
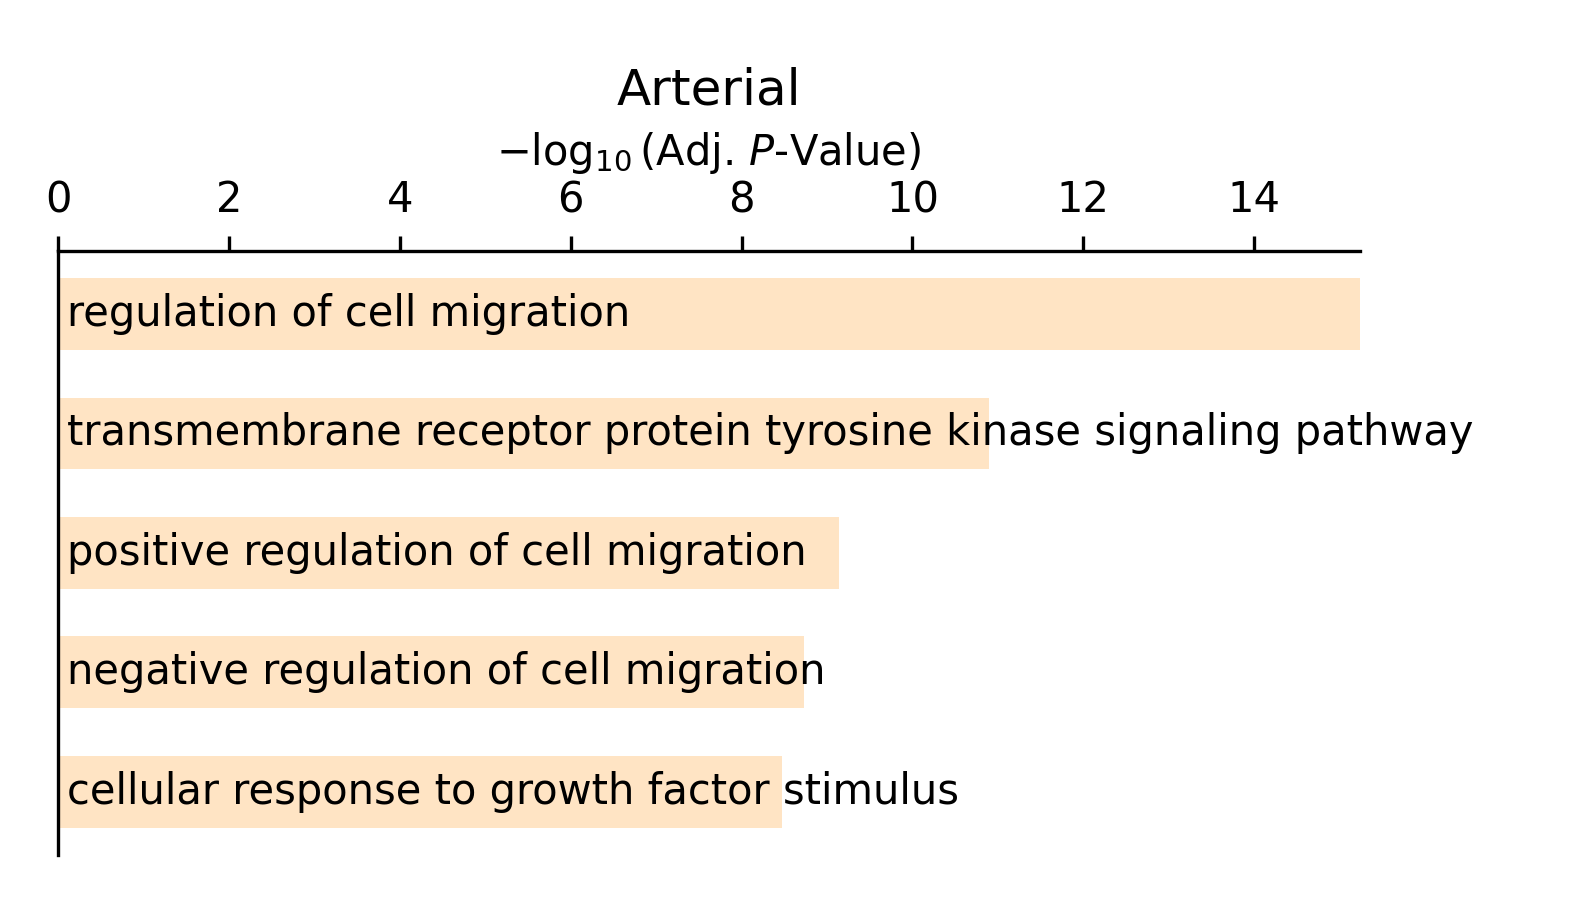
Next, if processes is set to True, you will get barplots of each cell's enriched pathways based on GSEApy's enrichr tool.
Enrichr's input is a list of DEGs (as of 19/4/2023 filtered by adj. p-val < 0.05 and lfg > 0.4) and gives back the enriched pathways for each cell.