


See your agent think. The Grafana for your personal AI agent.
Real-time observability dashboard for OpenClaw AI agents. One file. Zero config. Just run it.
Previously published as
openclaw-dashboard- same project, better name.
🌟 Star this repo if you find it useful!
pip install clawmetry
clawmetry
🎉 Opens at http://localhost:8900 - auto-detects your OpenClaw workspace.
curl -O https://raw.githubusercontent.com/vivekchand/clawmetry/main/dashboard.py
pip install flask
python3 dashboard.py| Flow | Overview | Sub-Agent |
|---|---|---|
 |
 |
 |
| Summary | Crons | Memory |
|---|---|---|
 |
 |
 |
| Tab | What it shows |
|---|---|
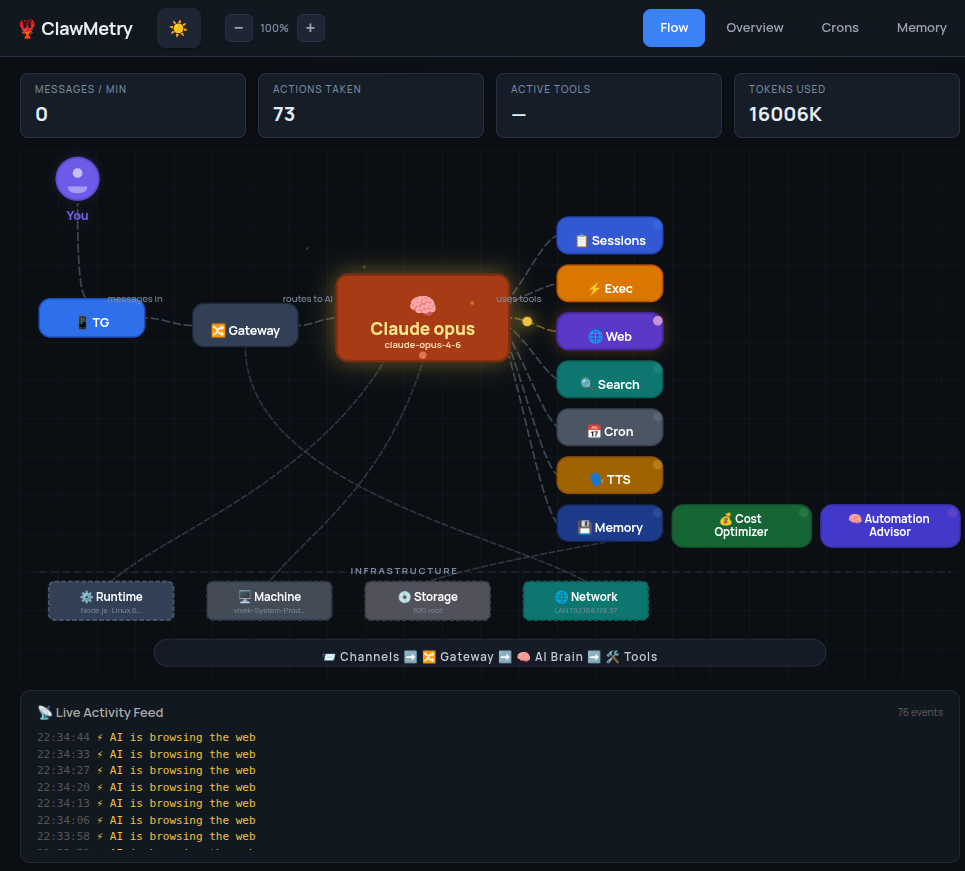
| 🌊 Flow | Real-time animated SVG - data flow from You → Channels → Gateway → Brain → Tools → Infrastructure |
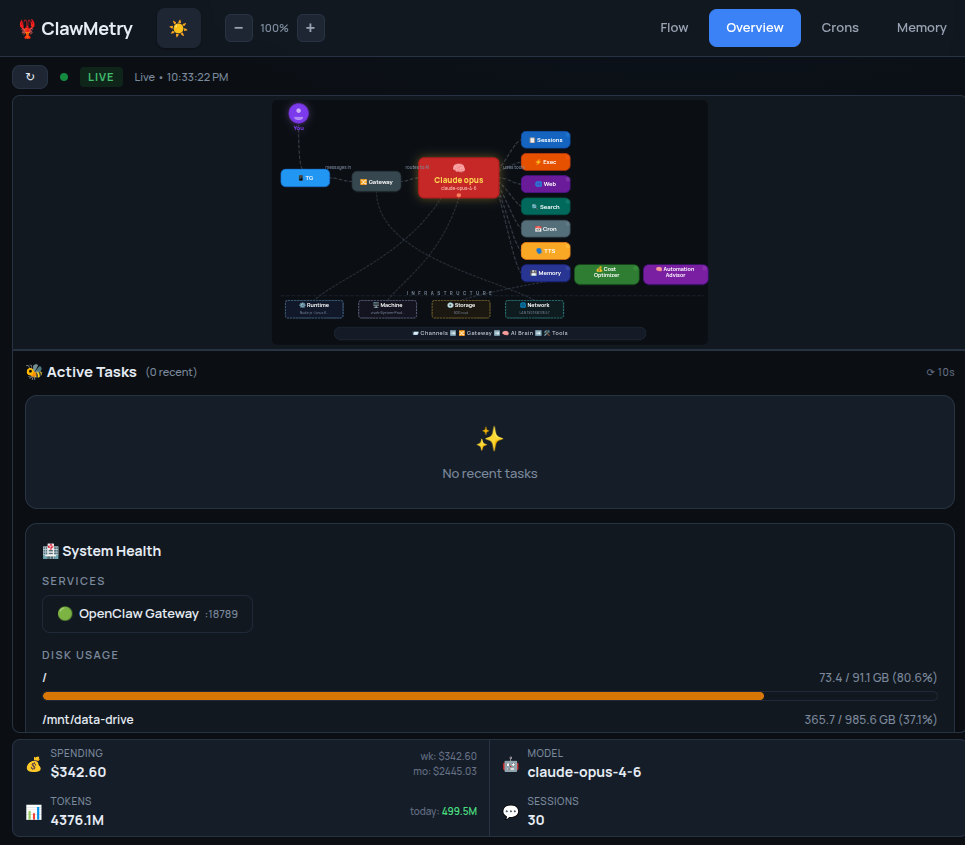
| Overview | Model, sessions, crons, tokens, memory, ❤️ health checks (auto-refresh via SSE), 🔥 activity heatmap (GitHub-style) |
| 📊 Usage | Token/cost tracking - bar charts, daily/weekly/monthly totals, model breakdown. With OTLP: real token counts & actual cost |
| Sessions | Active agent sessions with model, channel, token usage, last activity |
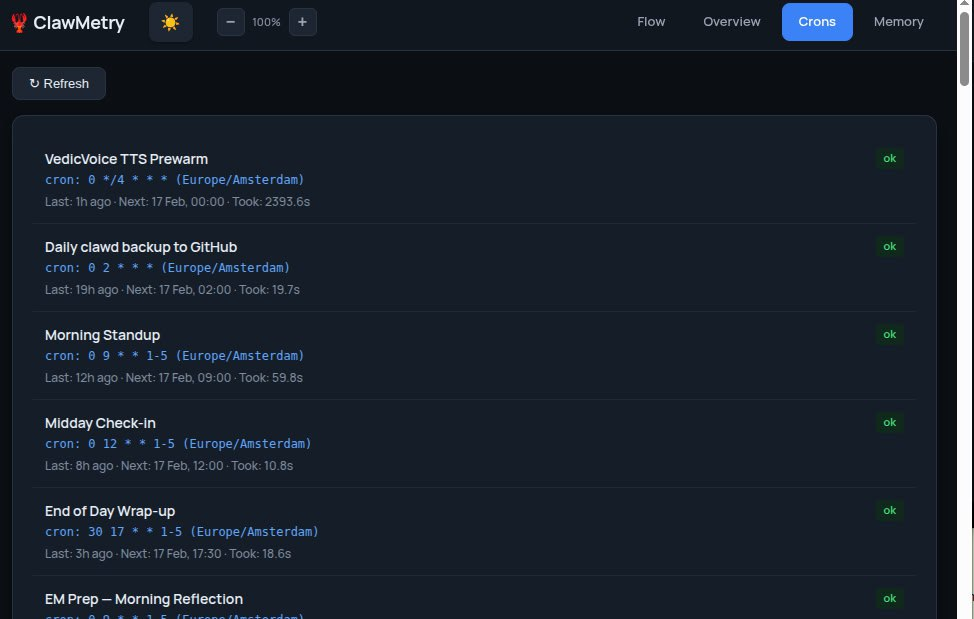
| Crons | Scheduled jobs with status, schedule, last/next run, duration |
| Logs | Color-coded JSON logs with real-time SSE streaming |
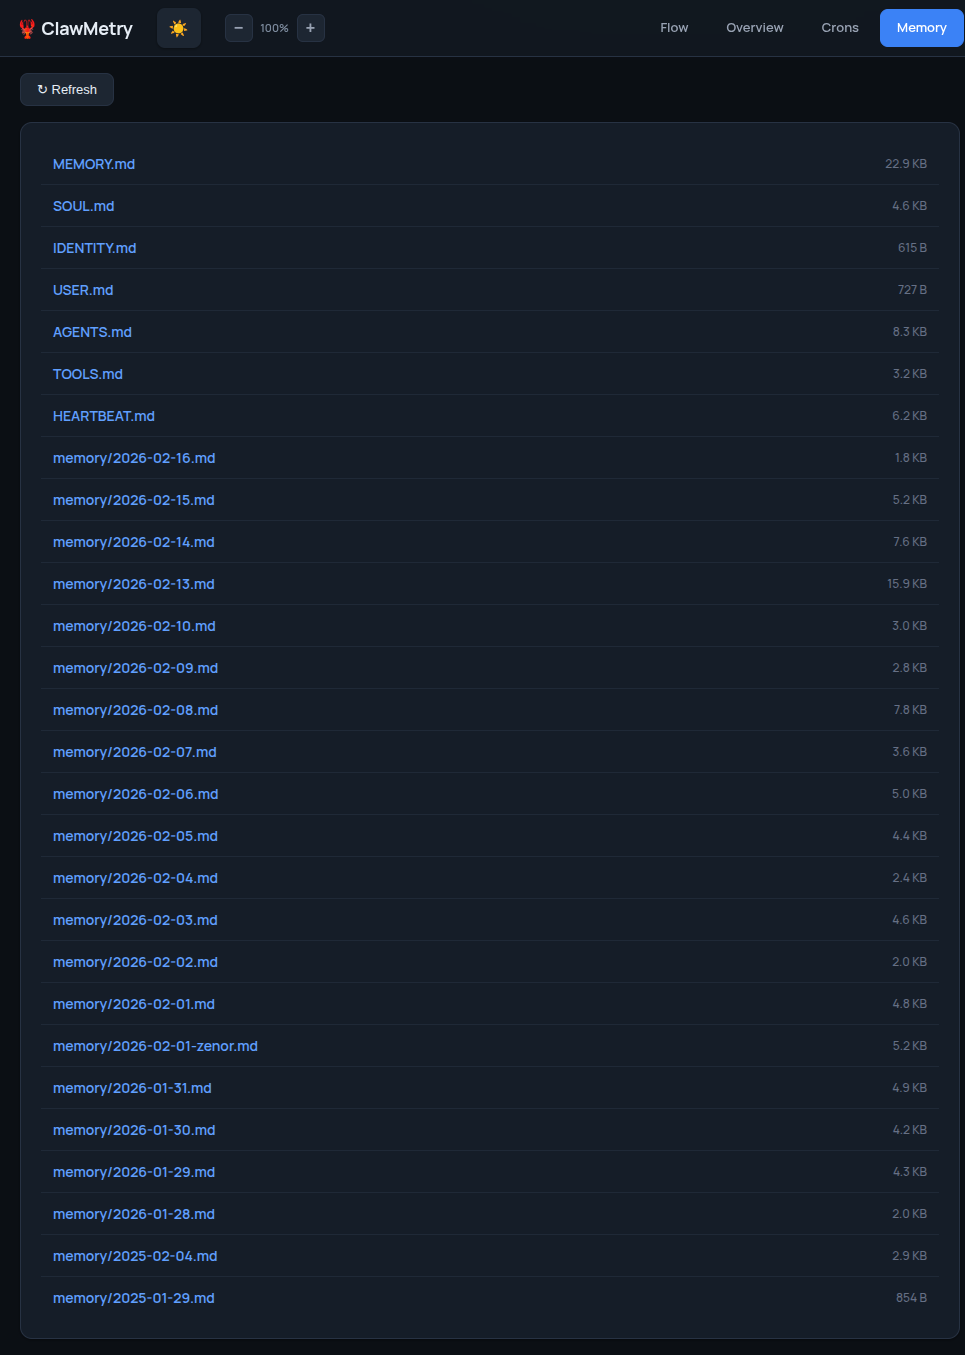
| Memory | Clickable file browser for SOUL.md, MEMORY.md, AGENTS.md, daily notes |
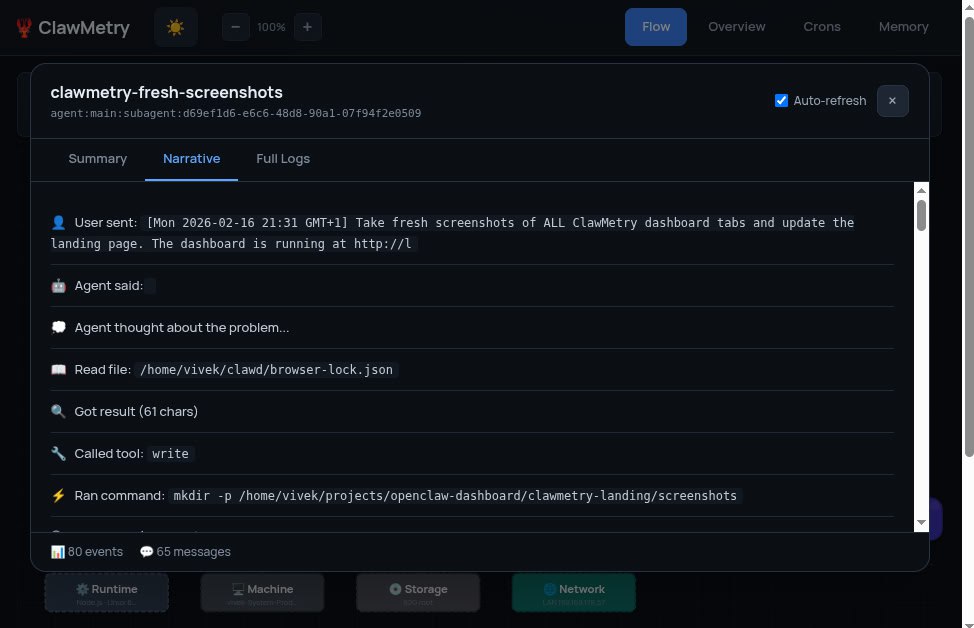
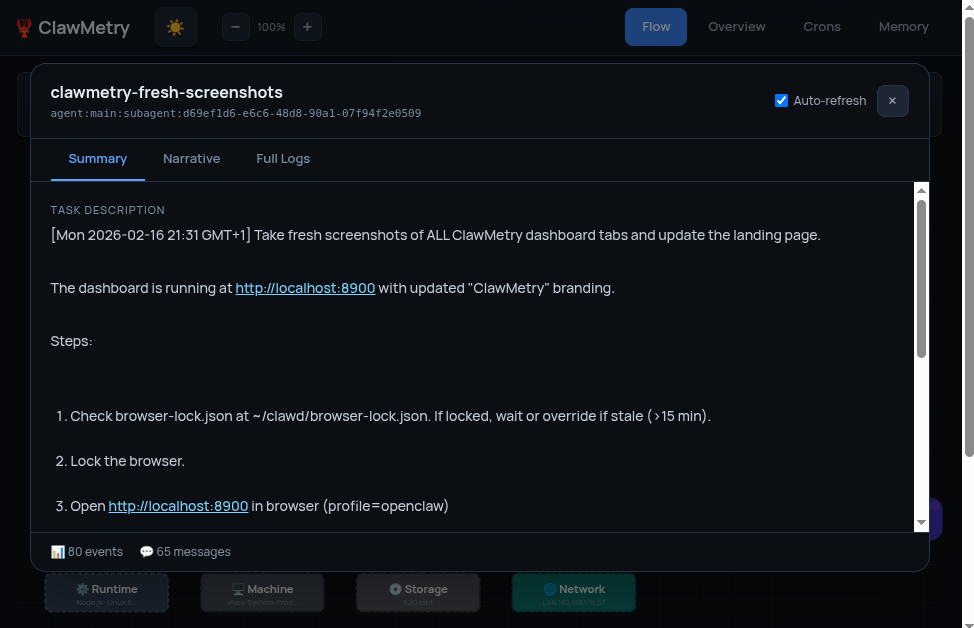
| 📜 Transcripts | Session transcript viewer - chat-bubble UI with color-coded roles |
The star feature - a live animated architecture diagram that lights up as your agent processes messages:
- 🟣 Purple - your message entering through a channel
- 🔵 Blue - request flowing to the brain
- 🟡 Yellow - tool calls (exec, browser, search, cron, tts, memory)
- 🟢 Green - response flowing back
- 🔴 Red - errors
- 🔵 Cyan - infrastructure activity
No Grafana or Prometheus needed. Point OpenClaw at the dashboard:
diagnostics:
  otel:
    endpoint: http://localhost:8900
Install OTLP support: pip install clawmetry[otel]
| ClawMetry | Langfuse | AgentOps | |
|---|---|---|---|
| Install | pip install clawmetry |
Docker + Postgres | SDK + cloud account |
| Config | Zero. Auto-detects everything. | Database URLs, API keys | API keys, SDK init |
| Focus | Personal AI agent | Enterprise LLM apps | Enterprise agent monitoring |
| Memory browser | ✅ SOUL.md, MEMORY.md, daily notes | ❌ | ❌ |
| Single file | ✅ One Python file | ❌ Multi-service | ❌ Cloud service |
| Built-in OTel | ✅ OTLP/HTTP receiver | ❌ | ❌ |
clawmetry --port 9000              # Custom port (default: 8900)
clawmetry --host 127.0.0.1         # Bind to localhost only
clawmetry --workspace ~/mybot      # Custom workspace path
clawmetry --log-dir /var/log       # Custom log directory
clawmetry --sessions-dir ~/data    # Custom sessions directory
clawmetry --metrics-file ~/m.json  # Custom metrics persistence path
clawmetry --name "Alice"           # Your name in Flow visualization
clawmetry --no-debug # Disable auto-reload| Variable | Description | Default |
|---|---|---|
OPENCLAW_HOME |
Agent workspace directory | Auto-detected |
OPENCLAW_WORKSPACE |
Alternative to OPENCLAW_HOME | Auto-detected |
OPENCLAW_SESSIONS_DIR |
Sessions directory (.jsonl transcripts) | Auto-detected |
OPENCLAW_LOG_DIR |
Log directory | /tmp/moltbot |
OPENCLAW_METRICS_FILE |
Metrics persistence file path | {workspace}/.clawmetry-metrics.json |
OPENCLAW_USER |
Your name in Flow tab | You |
OPENCLAW_SSE_MAX_SECONDS |
Max duration per SSE stream | 300 |
No config needed - the dashboard searches for your workspace, logs, sessions, and crons automatically.
pip install clawmetry
clawmetrygit clone https://github.com/vivekchand/clawmetry.git
cd clawmetry
pip install -r requirements.txt
python3 dashboard.pycurl -sSL https://raw.githubusercontent.com/vivekchand/clawmetry/main/install.sh | bash- Python 3.8+
- Flask (only required dependency)
- opentelemetry-proto + protobuf (optional -
pip install clawmetry[otel]) - OpenClaw/Moltbot running on the same machine
- Linux/macOS
See the Cloud Testing Guide for SSH tunnels, reverse proxy, Docker, and OTLP-only mode.
MIT
🦞 See your agent think
Built by @vivekchand · LinkedIn · Part of the OpenClaw ecosystem