The purpose of this analysis is to measure the effects of manufacturing a new car prototype in different lots while also comparing the vehicle's performance.
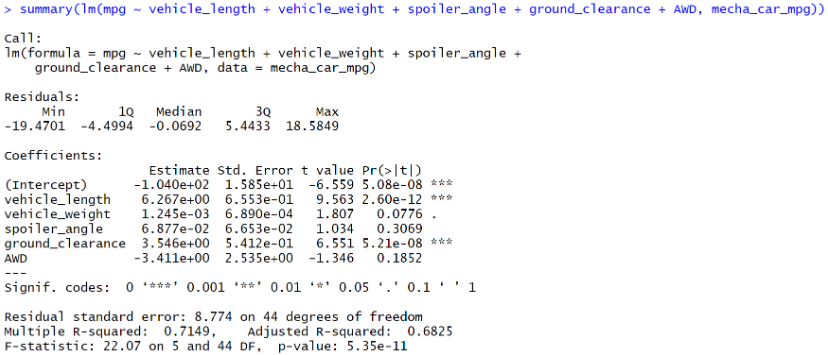
- Which variables/coefficients provided a non-random amount of variance to the mpg values in the dataset?
A variance of non-random variable should equal zero. Therefore, vehicle length and ground clearance provided a non-random amount of variance to the mpg values.
- Is the slope of the linear model considered to be zero? Why or why not?
Although some of the slopes are close to zero, all of the slopes are non-zero slopes.
- Does this linear model predict mpg of MechaCar prototypes effectively? Why or why not?
With an adjusted R-squared of 0.6825, it is safe to conclude that this linear model predicts mpg of prototypes effectively.

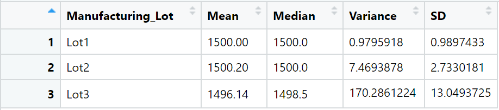
- The design specifications for the MechaCar suspension coils dictate that the variance of the suspension coils must not exceed 100 pounds per square inch. Does the current manufacturing data meet this design specification for all manufacturing lots in total and each lot individually? Why or why not?
When combining all of the lots together, the variance is acceptable at 62.29. However, when viewing the lots separately, it is clear that lot 3 has a drastically higher variance than lots 1 and 2. In this case, lots 1 and 2 meets the design specification while lot 3 does not.
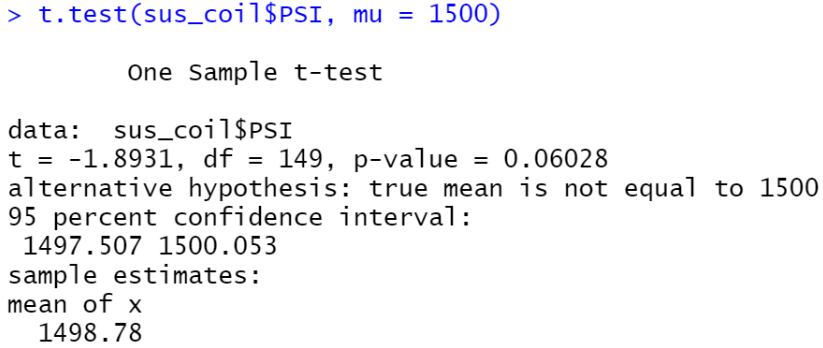
Since the p-value of 0.6028 is greater than alpha 0.05, the total manufacturing lot is not statistically significant from normal distribution.
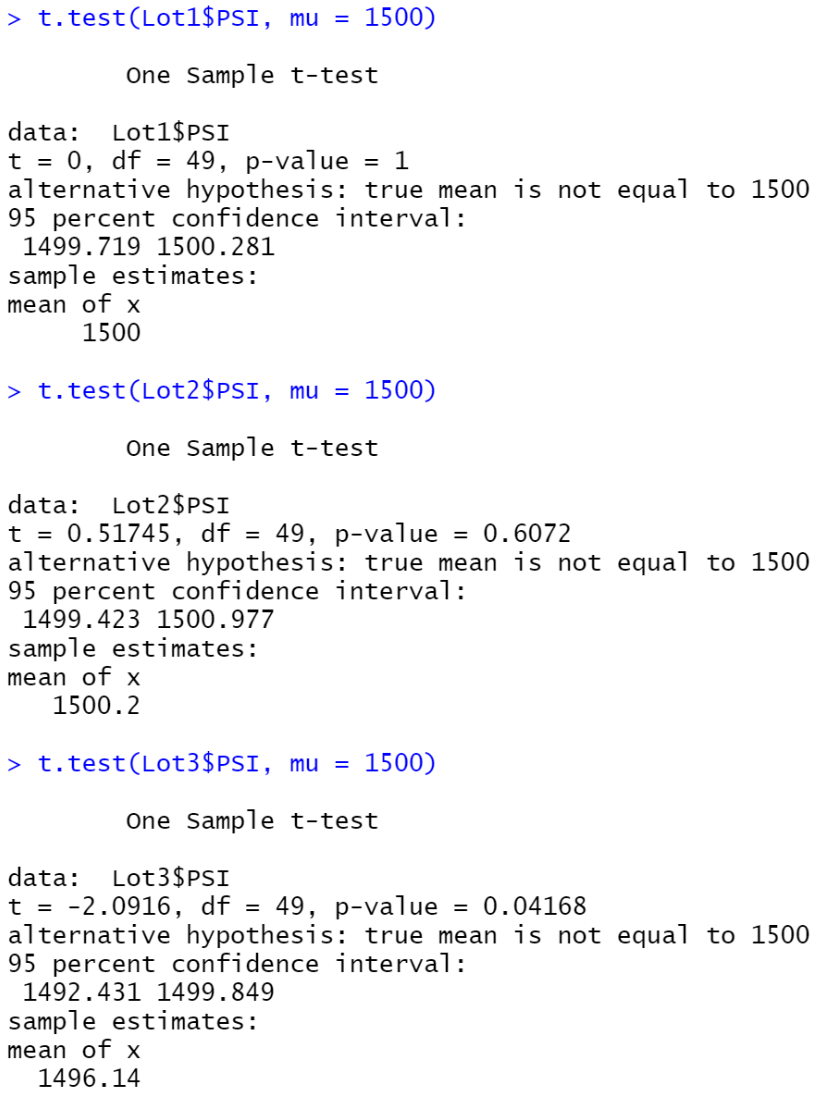
- Lot 1 T-Test
At a significance level of 0.05, we cannot reject the null hypothesis since the p-value is 1. Lot 1 is not statistically significant from normal distribution.
- Lot 2 T-Test
Similarly to Lot 1, the p-value is greater than the alpha which means that lot 2 is not statistically significant from normal distribution.
- Lot 3 T-Test
At a significance level of 0.05 and the p-value at 0.04168, we can reject the null hypothesis. This means that it is statistically significant from normal distribution. Nevertheless, the mean falls within 95% confidence.
Another study that could be performed to compare MechaCar vs its Competitors would be city vs highway gas efficiency and safety ratings.
- What metric or metrics are you going to test?
Safety ratings is crucial when consumers compare vehicles for purchase.
- What is the null hypothesis or alternative hypothesis?
The null hypothesis is that the safety rating's mean is zero.
- What statistical test would you use to test the hypothesis?
A multiple linear regression summary for safety ratings.
- What data is needed to run the statistical test?
Data samples of vehicles from MechaCar and its competitors should be collected and compared.