Some of the basic plotting techniques which I tried using the random Covid data analysis from different states to get familiarised with the Matplotlib. The code can be found above for the various charts shown.
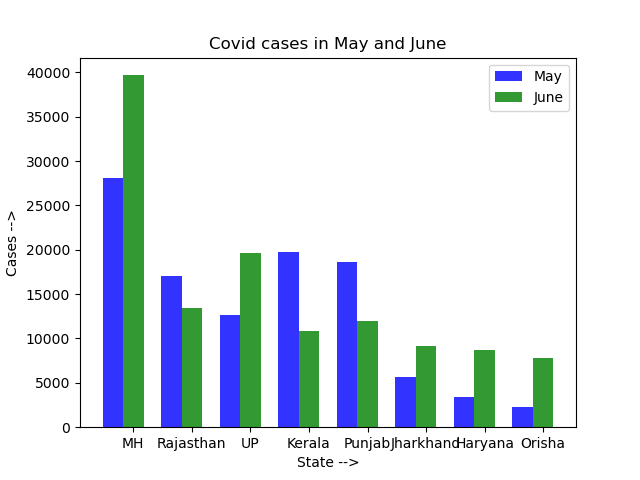
Barchart
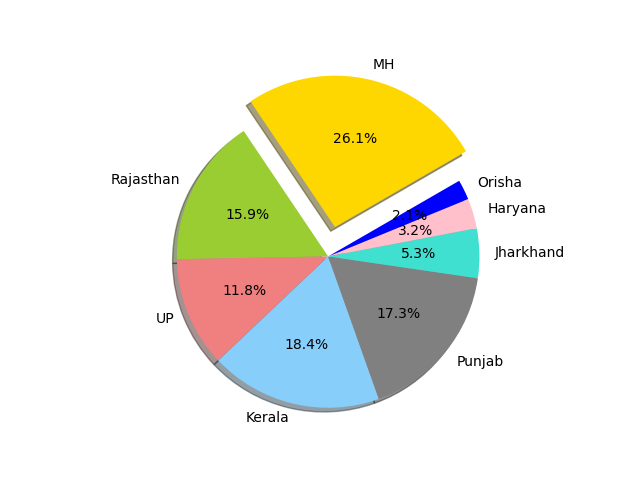
Pie Chart
Line Chart

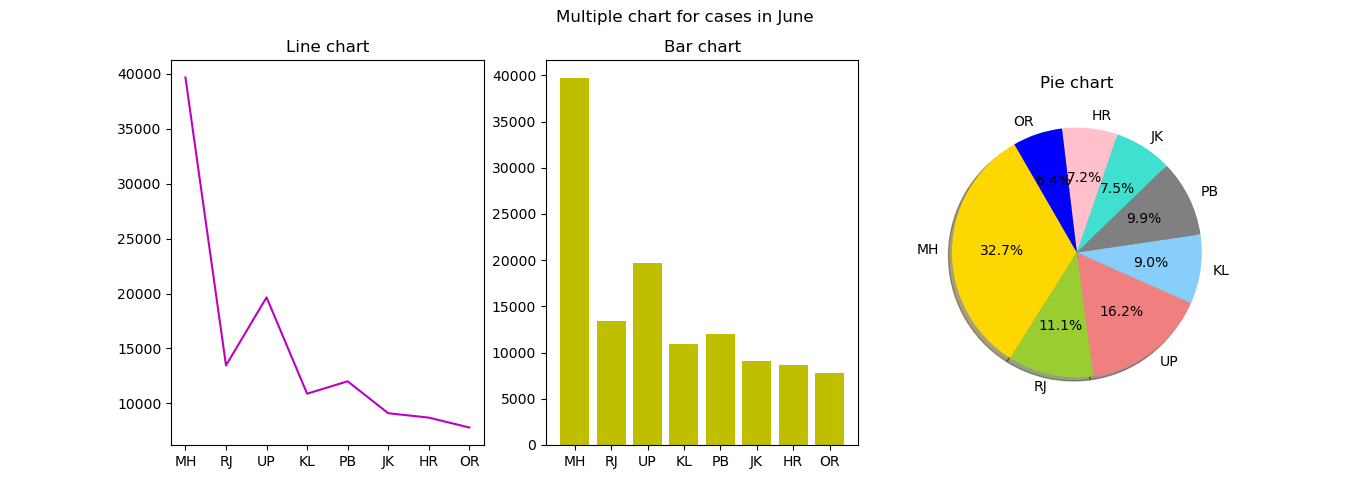 Mixed Plot