As the percentage of high-productive employees in a company increases,
(1) What is the change in magnitude of the overall employee productivity?
(2) What percentage of low-productive employees have become more productive through peer effects?
Previous studies have found that employee productivity is associated with peer effects in the workplace, and high-productive employees have a positive effect on the productivity of low-productive employees. For instance, Falk & Ichino (2006) tested the influence of peer effects on work productivity in terms of average output in a field experiment. The study shows that workers raised their productivity significantly when paired with peers compared to working alone. More importantly, the increase of productivity was more prominent for less productive workers when they were paired to work with more productive peers. Similarly, Bandiera, Barankay & Rasul (2010) found that people tend to be more productive when they work alongside their friends, and they become even more productive when working with friends with high ability. Thus, social interactions and peer effects play important roles in changing employee productivity. From the studies, we also learn that the improvement in productivity for low-productive employees is more evident when they are surrounded by high-productive peers. However, little is known about the exact size of the impact of high-productive employees on the productivity of the low-productive peers.
Previously, research was conducted to study how manipulating the ability of the workers can change productivity through peer effects. It was found that a 10% increase in the average co-worker ability (in terms of permanent productivity) improves the productivity of a single worker by 0.3 % (Brune, Chyn & Kerwin, 2020). On-the-job training was also believed to improve the ability and experience of employees and thus leads to higher productivity (Maranto & Rodgers, 1984). However, few studies have looked at how the ratio of high vs. low-productive employees in a company affects overall productivity. Although intuitively we expect to see an improvement in productivity as we increase the number of high-productive employees, we are still unclear about the magnitude of the increase. With the simulation approach, we are able to easily manipulate the ratio of the two types of employees and measure the size of the effect.
My code was based on the Schelling simulation model with some tweaks to it.
To answer my research question, I first defined two types of agents: the low-productive employee (Type 0 Agent, which is the majority group) and the high-productive employee (Type 1 Agent). Then, I calculated the number of Type 1 neighbors that each agent had at the moment and used that number to determine whether the agents wanted to stay or move to empty cells. The goal of all agents is to be productive and they want to gain productivity through cooperation. When a Type 1 agent has at least 1 neighbor that is also Type 1, it gains 1 productivity. The Type 0 agent has to have at least 2 Type 1 neighbors for it to gain 1 productivity. If they don’t gain productivity, they will move to new places. I removed the homophily parameter from the Schelling model and used two new parameters (major_bar = 2, minor_bar = 1) to set separated bars for Type 0 and Type 1 agents. In the end, I compared the total number of productivity gained throughout each simulation (steps = 10) generated with different percentages (10%,20%, 30%, etc.) of the Type 1 agent initialized to measure the change in magnitude of the overall productivity.
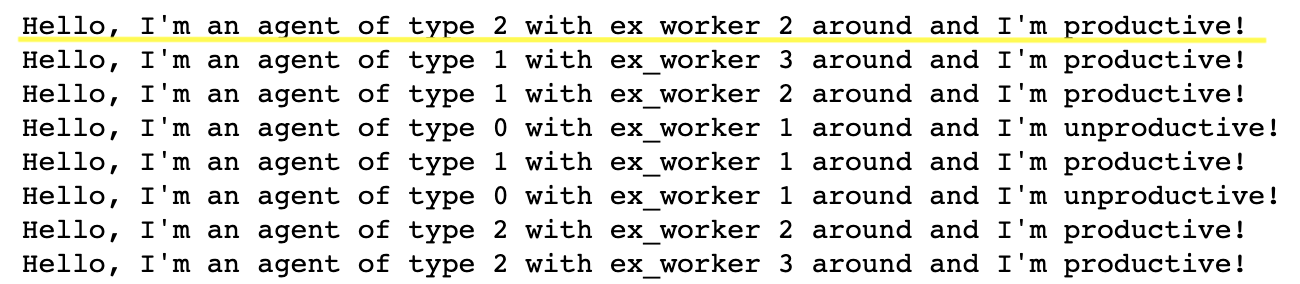
To measure the size of the impact of the high-productive employees on the productivity of the low-productive employees, I made the Type 0 agent change their types to a Type 2 agent when they become productive (as indicated in the screenshot below). I can then compare how many low-productive employees become more productive across simulations with different percentages of Type 1 agents. (Note: Type 1 agents never change their own type.)
I also tested 2 cases to figure out how Type 1 agent should behave to maximize productivity:
Case 1: Type 1 agents move to empty cells no matter whether they gain productivity at the moment or not (just like people walk around to help others because they are more able) while Type 0 agents only move to empty cells when they fail to gain productivity at the moment. I wonder whether this kind of randomness can increase the likelihood of improving overall productivity to a greater extent.
Case 2: Both Type 1 and Type 0 agents only move to empty cells when they fail to gain productivity at the moment.
For both behavior test cases, the grid was set to a height of 10, a weight of 10, a density of 0.8, and a Type 1 percentage at 0.25. I ran the simulation with 10 steps 5 times for each of the 2 cases. As indicated in Fig. 1 below, Case 2, which only allowed Type 1 agents to move when they failed to gain productivity at the moment, produced a greater number of productivity on average. The maximized number of productivity generated by Case 2 reached a unit of 80 while the maximized number generated by Case 1 was around 55 on average. It is interesting that somehow as I ran the simulation more times, the productivity gained gradually decreased on average for both test cases. It could be just due to randomness. One thing to note is that the lines are pretty wiggly for Case 1 and are very smooth and soon stabilized for Case 2. Thus, the number of productivity gained by the agents could increase or decrease throughout the simulation in Case 1 as the agents move around. In contrast, productivity stably increased in Case 2. This finding is confirmed by Fig. 2, which indicates the increase in productivity per step of the simulation. For both cases, the increase in productivity was most prominent in the first couple of steps. The increase soon diminished as the steps increased, although more variations were observed in Case 1 in the later steps. Fig. 3 shows the percentage of Type 2 agents for each simulation. With the simulation initialized with 25 percent of the Type 1 agents, it is evident that the impact of Type 1 agents on Type 0 agents was significantly large and especially prominent in Case 2. More than half of the population became Type 2 agents, meaning more than half of the Type 0 agents (75% initialized) became more productive. Based on the results, I proceeded with the Case 2 model and measured the number of productivity gained from 10% to 60% of Type 1 agents initialized.
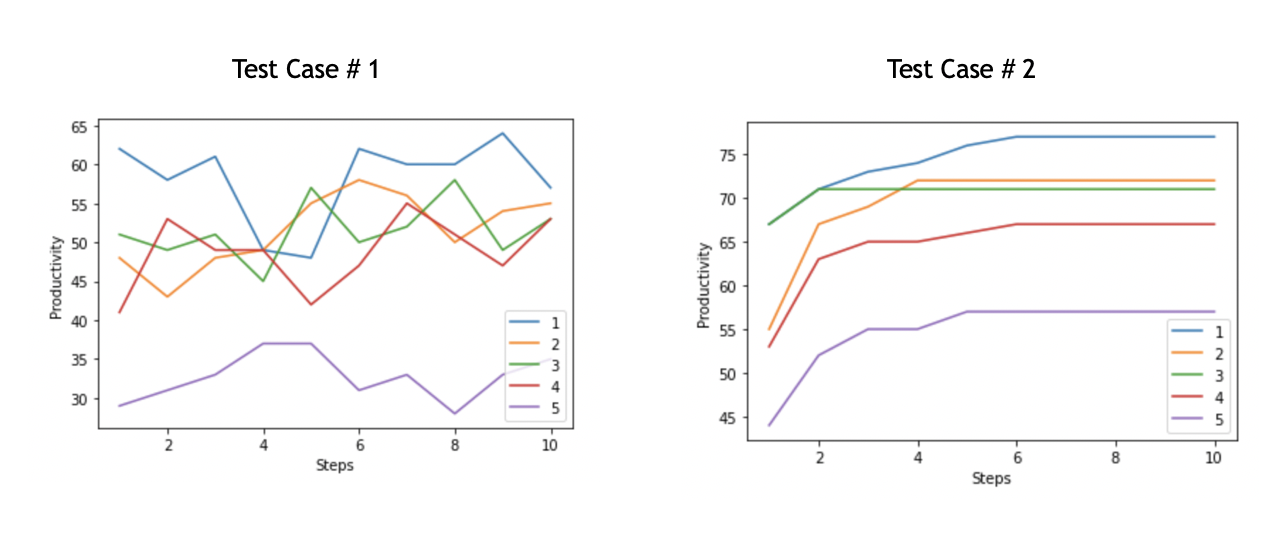
Fig. 1
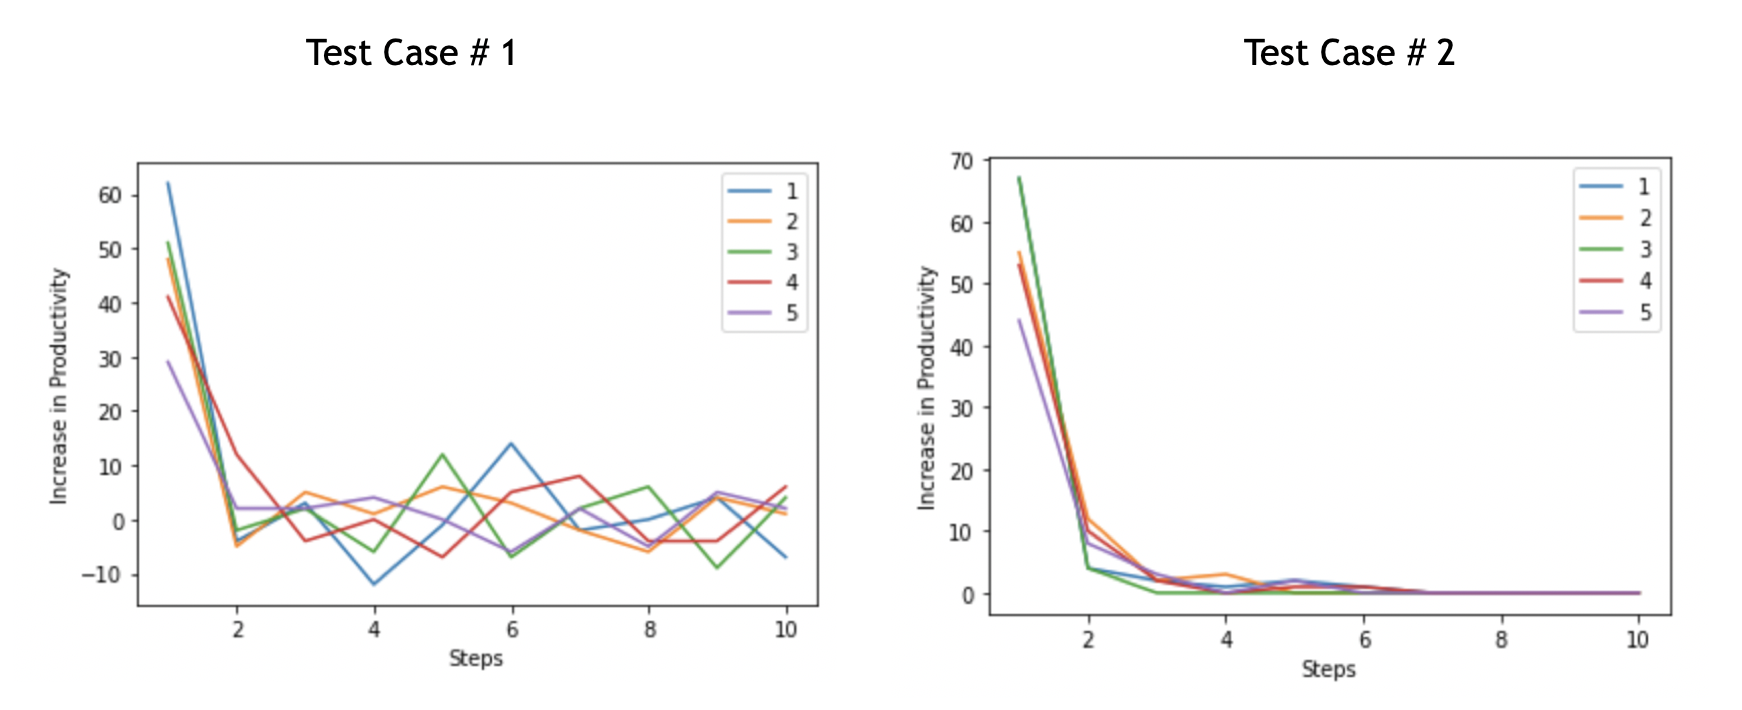
Fig. 2
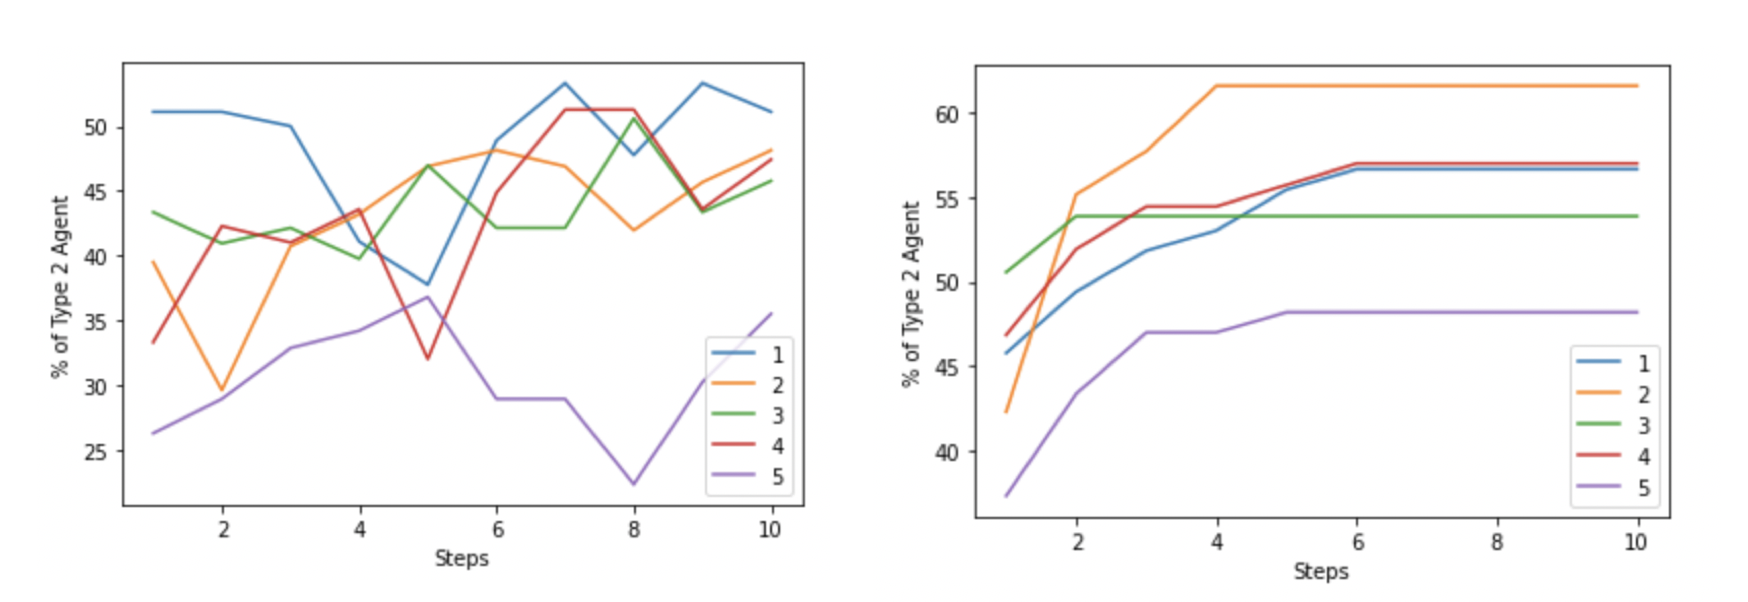
Fig. 3
Fig. 4 demonstrates the productivity generated with different percentages of Type 1 agents initialized. As expected, the higher percentage of Type 1 agents produced higher overall productivity. The difference between 10% and 60% was around 60 (= 80-20), so increased by 300%. The largest increase in productivity was from 10% to 20% (~125% increase). Then, the rate of increase in productivity gradually decreased. One interesting finding is that as the percentage of Type 1 agents initialized passed over half of the total population (i.e. they become the majority), the productivity obtained was about the same as the percentage was initialized at 50%. Not much improvement was observed.
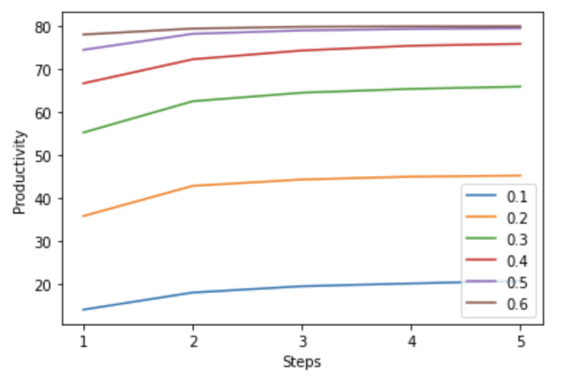
Fig. 4
For the increase in the number of Type 2 agents, similarly, we found that a higher percentage of Type 1 agents initialized led to a higher number of Type 2 agents (Fig 5). More importantly, the percentage of Type 0 agents that turned into Type 2 agents largely increased (20% → 45% → 75% → 90%) as the percentage of Type 1 agents increased, indicating a significantly positive impact of Type 1 agents on Type 0 agents (Fig 6).
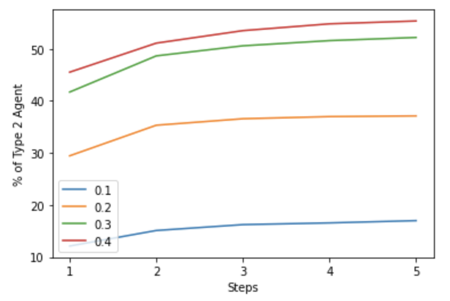
Fig. 5
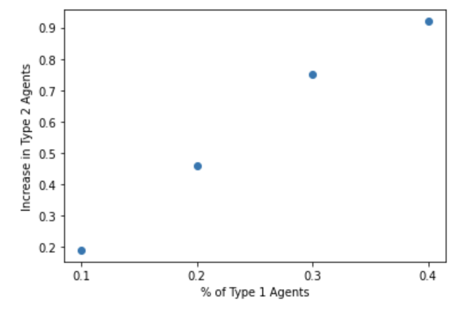
Fig. 6
Some conclusions:
-
It is certainly great to have more high-productive employees in a company to boost productivity. But, the percentage of high-productive employees doesn’t need to be too high. We observe a diminishing rate of increase after the percentage passed a threshold. 40 to 50 percent is good to reach a decent amount of productivity for a company with a reasonable cost.
-
Also, high-productive employees are really helpful in facilitating the productivity of low-productive employees. Companies should definitely encourage the different types of employees to interact more.
Limitations: In reality, the productivity of employees is not discretely high vs low. It could be continuous or some employees would have a medium level of productivity as well. This simulation is just a simplified version.
Bandiera, Oriana, Iwan Barankay, and Imran Rasul. 2010. “Social Incentives in the Workplace.” The Review of Economic Studies, 77(2): 417–458.
Brune, Lasse & Chyn, Eric T. & Kerwin, Jason Theodore, 2020. "Peers and Motivation at Work: Evidence from a Firm Experiment in Malawi," SocArXiv axbth, Center for Open Science.
Falk, Armin and Andrea Ichino. 2006. “Clean Evidence on Peer Effects.” Journal of Labor Economics, 24(1): 39–57.
Maranto, Cheryl & Rodgers, Robert. 1984. “Does Work Experience Increase Productivity? A Test of the On-The-Job Training Hypothesis.” Journal of Human Resources. 19. 341-357. 1