Analysis of standardized test scores across one school district
The purpose of this analysis was to remove the scores of the ninth graders from Thomas High School due to allegations of academic integrity. The analysis of the school district test scores for math and reading were then rerun to account for this change in data. This change in the scores for Thomas High School Ninth graders lead to a change in district-wide math and reading scores.
Using bulleted lists and images of DataFrames as support, address the following questions.
-
How is the district summary affected?
- Removing the Thomas High School ninth graders lead to 461 students being excluded from the school district summary. This had the effect of slightly decreasing the average math score. The percent of students who massed math, reading, and the overall passing percentage all drecreased by 0.1%.
-
How is the school summary affected?
- The school summary is affected by greatly decreasing the percent passing for reading and math for Thomas High School. Passing math percentages dropped from 93% to 67%. Passing reading percentages dropped from 97% to 70%. The overall passing rate for Thomas High School dropped from 91% to 65%. However, when we replace the Thomas High School scores with the scores from only 10th through 12th grade, the passing percentages are only decreased by 0.1-0.3% for all scores.
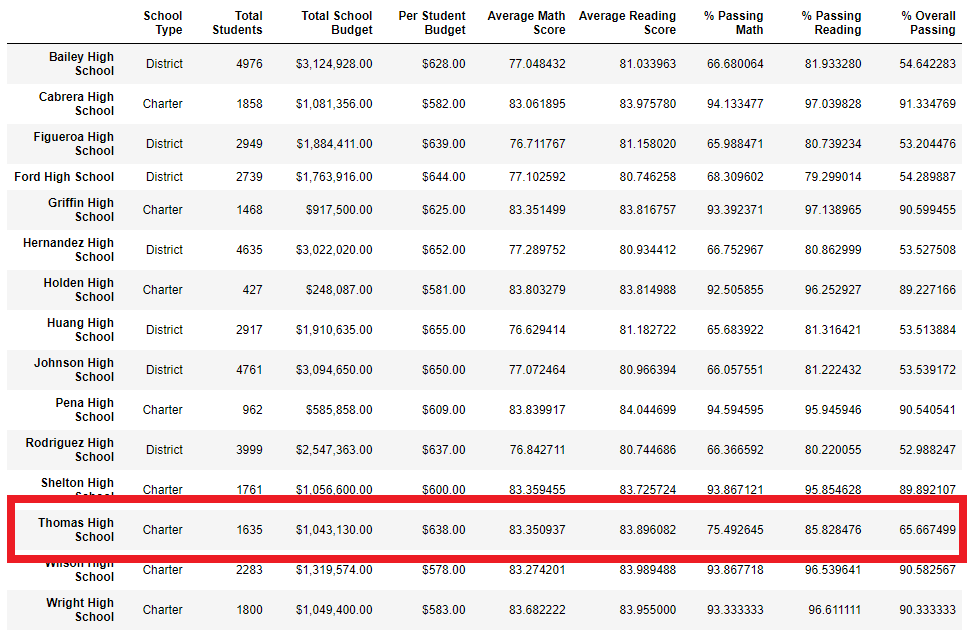 Fig1. The School Summary df with the ninth grade scores for Thomas High School
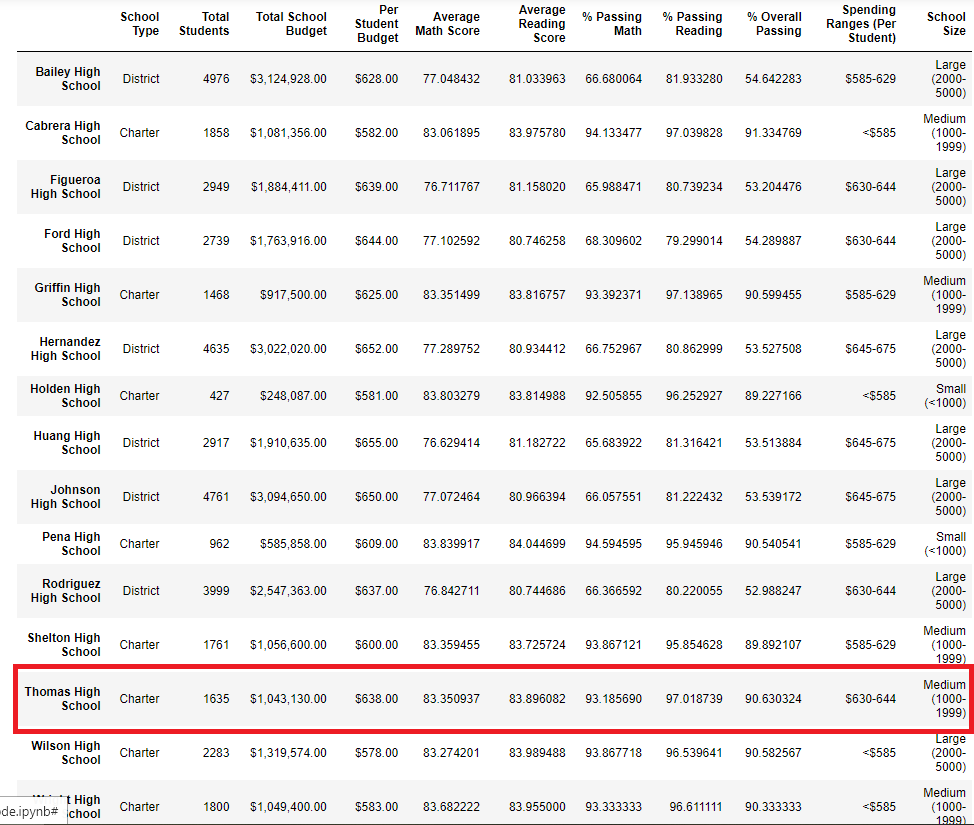 Fig2. The School Summary df after Thomas High School Scores are replaced
- The school summary is affected by greatly decreasing the percent passing for reading and math for Thomas High School. Passing math percentages dropped from 93% to 67%. Passing reading percentages dropped from 97% to 70%. The overall passing rate for Thomas High School dropped from 91% to 65%. However, when we replace the Thomas High School scores with the scores from only 10th through 12th grade, the passing percentages are only decreased by 0.1-0.3% for all scores.
-
How does replacing the ninth graders’ math and reading scores affect Thomas High School’s performance relative to the other schools?
- Origianally, Thomas High School was the top two school in terms of overall percentage of students who passed. With the ninth graders math and reading scores dropped, Thomas High School is now at the bottom of all schools in the district for percentage of students who passed reading. It puts Thomas High School near the bottom, but not in the bottom five, for percentage of students who passed math. The school still has a higher average math score (83.4) and a higher average reading score (83.9) than the bottom five schools. However, by replacing the Thomas High School data so that it only includes the 10th through 12th graders, Thomas High School's stading in the top five schools is not affected.
-
How does replacing the ninth-grade scores affect the following:
-
Math and reading scores by grade
- Now that the Thomas High School ninth graders' grades have been replaced with Nan, all data for reading scores and math scores for 9th grade for Thomas High School is now NaN as well. 10th through 12th grade scores for Thomas High School were not affected.
-
Scores by school spending
- The average scores by school spending were decreased by 0.01 points. This is not noticeable when the dataframe is formatted to one decimal place.
-
Scores by school size
- The scores by school size for medium schools (1000-4999 students), which Thomas High School was a part of, were only affected by 0.01 points, which is not noticeable when the scores are rounded up.
-
Scores by school type
- The scores for charter schools, of which Thomas High School was, were only decreased by 0.01 points, which is not noticeable when the scores are rounded.
In summary, a total of 461 student scores were dropped. This total reflects the number of ninth graders at Thomas High School. Compared to the school district's total of 39170 students, this represents about a 1% decrease in total test scores that were calculated. These changes did not affect any of the other high schools in the district, nor did it affect the scores for large schools or district schools, because Thomas High School was a medium sized charter school. The average grades for both reading and math did not change very much, indicating that the 10th, 11th, and 12th graders at Thomas High School had about the same average grade as the 9th graders from the school. The overall passing percentage for the entire schdool district for both reading and math went down by 0.2%. When analyzing the scores by grade, Thomas High School has no grades to report for the entire 9th grade, whearas before the math and reading scores were 83.6% and 83.7%, repsectively.
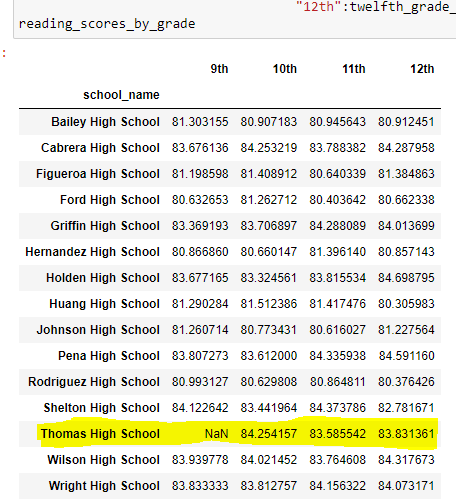
Fig.3 reading scores with NaN for Thomas High School ninth graders
In addition, the percentage of students passing math for Thomas High School went down from 93.3% to 93.2%, as did the percentage of students passing reading, from 97.3% to 97.0$. This changed the overall passing percecntage to 90.6% from 90.9%. Thomas High School is still the top 2 school, but it's overall passing percentage is now cloaser to the number three school, Griffin High School.