Hi,
I'm really excited about tabpy, but everytime I go to use it, I am faced with difficult issues getting around table calculations, etc..
I'm attempting to report if a value is an outlier for a specific day and a list of names, as such I need to pass all the days for each name to python, but when presenting the data I need to hide all the days except the value I'm testing and whether or not it is an outlier.
I deployed the function and it is in http://localhost:9004/endpoints

Everything works fine when the view is in the time series tableau view
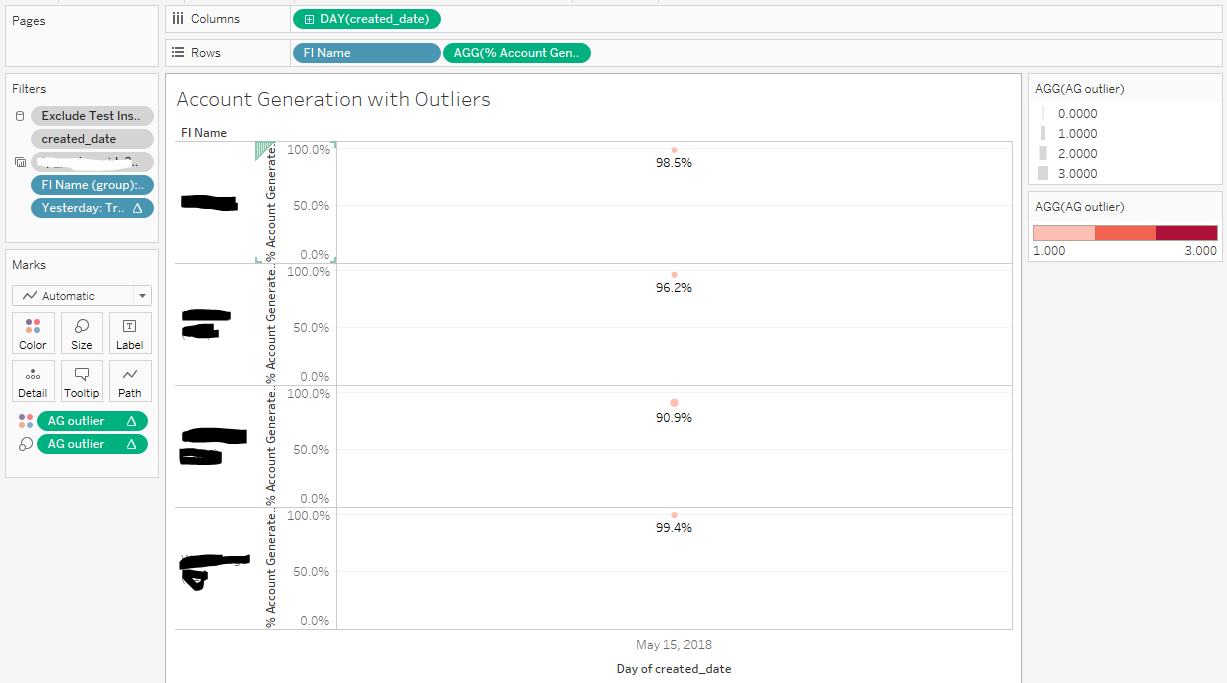
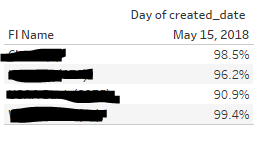
I'd like to present the data as a crosstab with the the outlier detection on the color shelf, however that is when I'm faced with the "Error processing script
The endpoint you're trying to query did not respond. Please make sure the endpoint exists and the correct set of arguments are provided." error
In the bar chart or crosstab view I have the table calc for the python script at the level of day restarting every FI name (same settings as in time series view) I get the following error.
Traceback (most recent call last):
  File "C:\Users\jboyer\AppData\Local\Continuum\Anaconda3\envs\Tableau-Python-Server\lib\site-packages\tabpy_client\custom_query_object.py", line 51, in query
    ret = self.custom_query(*args, **kwargs)
  File "<ipython-input-13-c8ece8512f15>", line 32, in get_outliers
  File "<ipython-input-13-c8ece8512f15>", line 12, in normalize
  File "C:\Users\jboyer\AppData\Local\Continuum\Anaconda3\envs\Tableau-Python-Server\lib\site-packages\numpy\core\_methods.py", line 70, in _mean
    ret = umr_sum(arr, axis, dtype, out, keepdims)
TypeError: unsupported operand type(s) for +: 'float' and 'NoneType'
ERROR:__main__:{"ERROR": "TypeError : unsupported operand type(s) for +: 'float' and 'NoneType'"}
ERROR:__main__:{"response": {"uri": "outlier_detection", "error": "TypeError : unsupported operand type(s) for +: 'float' and 'NoneType'"}, "ERROR": "Failed query"}
OrderedDict([('uri', u'outlier_detection'), ('error', "TypeError : unsupported operand type(s) for +: 'float' and 'NoneType'"), ('type', 'QueryFailed')])
ERROR:__main__:{"info": {"uri": "outlier_detection", "error": "TypeError : unsupported operand type(s) for +: 'float' and 'NoneType'", "type": "QueryFailed"}, "ERROR": "Error querying GLS"}
ERROR:tornado.access:500 POST /query/outlier_detection (::1) 4.00ms
The endpoint you're trying to query did not respond. Please make sure the endpoint exists and the correct set of arguments are provided.
ERROR:__main__:{"info": "The endpoint you're trying to query did not respond. Please make sure the endpoint exists and the correct set of arguments are provided.", "ERROR": "Error processing script"}
For completeness I see no error when in the time series view.
I have tried passing the full list of values for each day, as well a single value, both versions work in time series view, neither work in crosstab or bar chart. As well as fiddling with various combinations of table calcs.
Here's the python script for the curious:
    from sklearn import linear_model
    import numpy as np
    lin = linear_model.LinearRegression()

    def make_array(data):
        return np.array(data)

    # normalize data
    def normalize(data):
        array = make_array(data)
        mu = array.mean()
        std = array.std(ddof=1)
        normed = (array-mu)/std
        return normed

    #create an x vector
    def create_x(data):
        return np.arange(0,len(data)).reshape(-1,1)


    def deviations(y_true,y_pred):
        return y_true-y_pred

    def outlier_score(y_true,y_pred):
        devs = deviations(y_true,y_pred)
        mu = devs.mean()
        std = devs.std(ddof=1)
        outlier_score = np.abs(devs-mu)/std
        return outlier_score

    normed = normalize(data)
    x = create_x(data)

    lin.fit(x[:-1],normed[:-1]) # exclude the most recent, due to lack of data
    y_pred = lin.predict(x)
    outlier_scores = outlier_score(normed, y_pred)
    if get_second_to_last==True:
        outlier_scores = outlier_scores[-2]
    else:
        outlier_scores = outlier_scores.tolist()
    return outlier_scores
If you need any additional info, please let me know.
Thank you so much for your time.
Hi,
I'm really excited about tabpy, but everytime I go to use it, I am faced with difficult issues getting around table calculations, etc..
I'm attempting to report if a value is an outlier for a specific day and a list of names, as such I need to pass all the days for each name to python, but when presenting the data I need to hide all the days except the value I'm testing and whether or not it is an outlier.
I deployed the function and it is in http://localhost:9004/endpoints

Everything works fine when the view is in the time series tableau view

I'd like to present the data as a crosstab with the the outlier detection on the color shelf, however that is when I'm faced with the "Error processing script

The endpoint you're trying to query did not respond. Please make sure the endpoint exists and the correct set of arguments are provided." error
In the bar chart or crosstab view I have the table calc for the python script at the level of day restarting every FI name (same settings as in time series view) I get the following error.
For completeness I see no error when in the time series view.
I have tried passing the full list of values for each day, as well a single value, both versions work in time series view, neither work in crosstab or bar chart. As well as fiddling with various combinations of table calcs.
Here's the python script for the curious:
If you need any additional info, please let me know.
Thank you so much for your time.