Cannot get the right envelope of the raw signal when using sliding_window_amplitude() #13
-
|
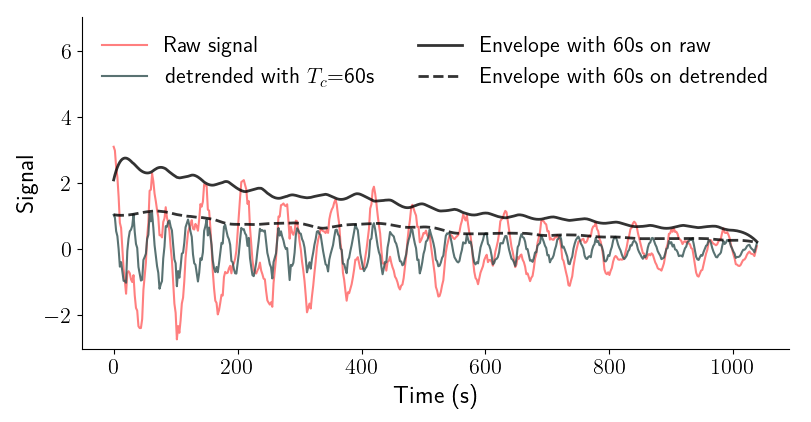
I'm scripting pyBOAT and having trouble recreating the plot of the raw signal together with the envelope. Im using the provided scripting_demo.py When I now plot together |
Beta Was this translation helpful? Give feedback.
Replies: 3 comments 1 reply
-
|
Thx for reaching out @pascalschulthess! Before digging any deeper.. in the UI there are two y-axes in the dataviewer plot (one for original signal, and one for detrended signal, can make a huge difference if there are strong low-freq. trends present) Depending on what you plot together, the envelope should adhere to the current scale. Maybe this does not work as expected in the UI? It is easily possible to post images here (just drag and drop into a comment), could you maybe post the two discrepant plots here? Also, which one you think is the correct one 😁 ? Thanks! EDIT: we can also continue on chat here: https://gitter.im/pyBOATbase/support |
Beta Was this translation helpful? Give feedback.
-
|
Ok so to address this directly here, to begin with you posted a line reading There is an The script to produce this plot I put in a gist |
Beta Was this translation helpful? Give feedback.
-
|
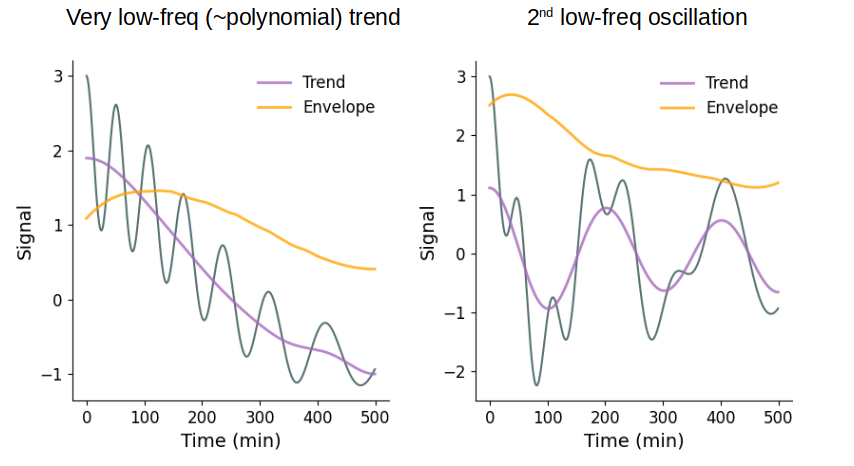
Ok, so I think we finally got to the bottom of this, the problem was within the UI of course. Note that in no case actual computations were inconsistent, both the scripting and the UI had the correct envelope all the time It's just the UI had a plotting tweak when plotting the raw signal along with the trend and envelope that is now probably regrettable. There are basically two cases:
pyBOAT 0.9.8 (old)
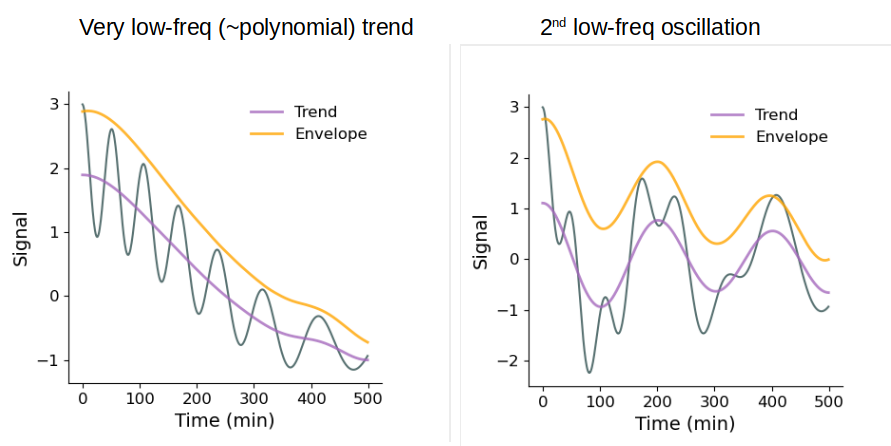
The right plot is the situation @pascalschulthess ran into. So what is actually plotted here is pyBOAT 0.9.9 (new)
Now with the new 0.9.9 there is really only the 'naked' envelope plotted alongside the raw signals, and the situation reverses. The effective envelope with a strong very low-freq trend present will not sit on top of the signal, as it is dominated by the (non-zero mean) trend. On the right, for the slower oscillation it now fits more or less exactly, as this 'trend' is actually 0-mean. ConclusionEven though I think for most use cases, non-parametic detrending and not removal of a 2nd slower oscillation, the plots will look poorer, this is still better as it is non-ambigious. I should have at least communicated somehow clearly that in the UI Last but not least, thx to @pascalschulthess for finding and reporting this inconsistency between scripting interface and the UI! |
Beta Was this translation helpful? Give feedback.
-
|
Great, thanks for the collaboration in working this out. |
Beta Was this translation helpful? Give feedback.
Ok, so I think we finally got to the bottom of this, the problem was within the UI of course.
Note that in no case actual computations were inconsistent, both the scripting and the UI had the correct envelope all the time
It's just the UI had a plotting tweak when plotting the raw signal along with the trend and envelope that is now probably regrettable. There are basically two cases:
pyBOAT 0.9.8 (old)
The right plot is the situation @pascalschulthess ran into. So what is actually plotted …