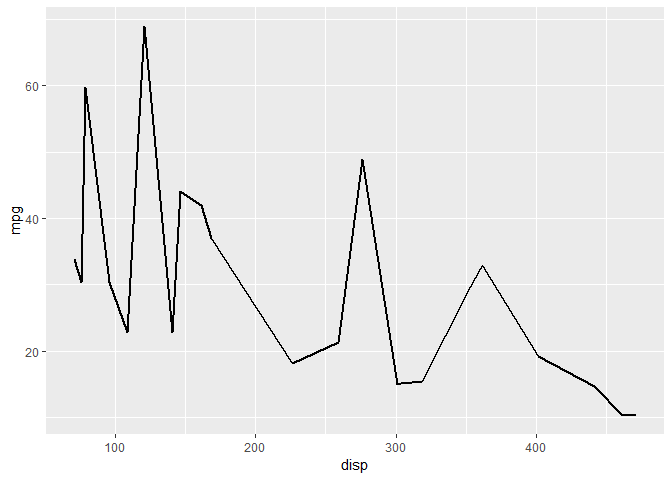
Attempting to do a binned summation of data via fun.y with stat_summary_bin and represent as a line. I get strange y-axis labels when combining with a scale_y_* aesthetic. It looks like a bug to me, but perhaps I misunderstand how to use stat_summary_bin.
library(ggplot2)
ggplot(mtcars) +
  aes(x = disp, y = mpg) +
  stat_summary_bin(fun.y = sum, binwidth = 2.5,
    geom = "line", size = 1)
ggplot(mtcars) +
  aes(x = disp, y = mpg) +
  stat_summary_bin(fun.y = sum, binwidth = 2.5,
    geom = "line", size = 1) +
  scale_y_log10()
ggplot(mtcars) +
  aes(x = disp, y = mpg) +
  stat_summary_bin(fun.y = sum, binwidth = 2.5,
    geom = "line", size = 1) +
  scale_y_sqrt()
Created on 2018-09-04 by the reprex package (v0.2.0).