geom_histogram + xlim causes first bar to disappear #3332
Description
ggplot2 3.1.1
library(ggplot2)
set.seed(1)
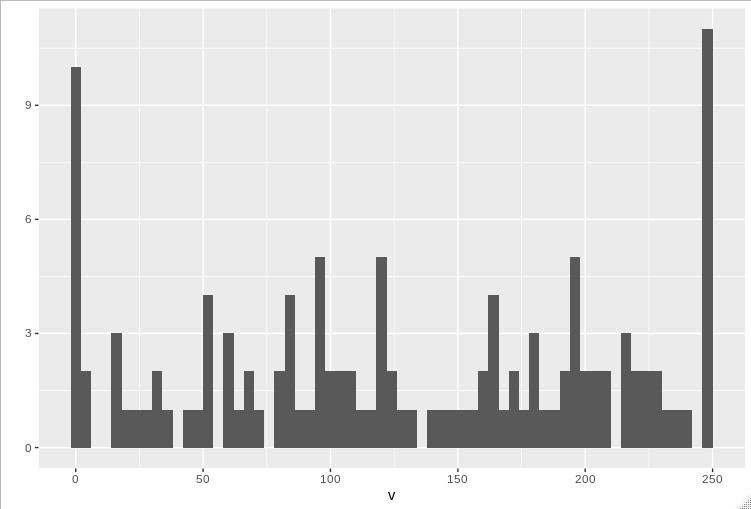
v <- c(rep(0,10), sample.int(250, 100, replace=TRUE), rep(250,10))
qplot(v, geom="histogram", binwidth=4) # good
# Here we lose the first bar
qplot(v, geom="histogram", binwidth=4) + xlim(0,250)
qplot(v, geom="histogram", binwidth=4) + xlim(-1,250)