ggplot2 - stat_density2d heatmap issue #4788
Description
Hey guys! I've been facing an issue to create a heatmap using ggplot2 library. I have to say that I'm not a very experienced person with R language.
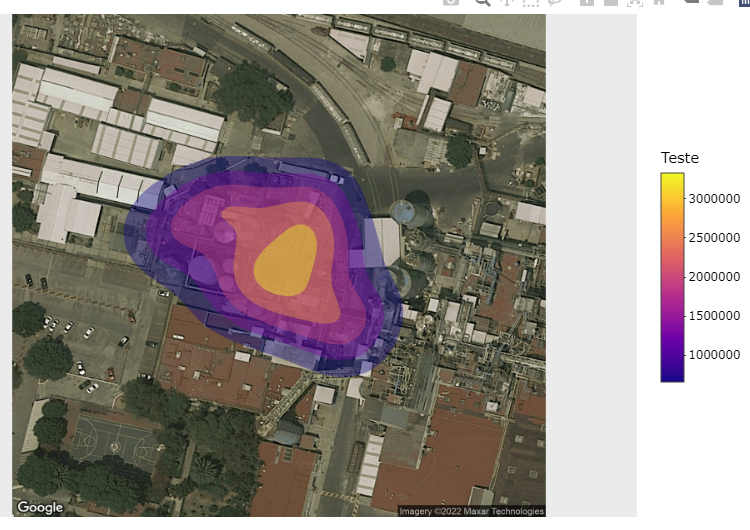
I'm trying to create a map like this one below:

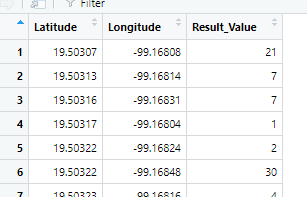
My dataset has these columns. I'm trying to use the column named "Result_Value" for my levels values. But it isn't working. I don't even know where the actual levels values are coming from. Could you help me?
map <- ggmap(get_googlemap(center = c(lon = -99.1683, lat = 19.50335), zoom = 19, maptype = "satellite", color = "color")) +
stat_density2d(data = dataset, aes(x = lon, y = lat, fill = ..level..),
alpha = .4,
bins = 6, geom = "polygon") +
labs(fill = "Teste") +
scale_fill_viridis_c(option = "plasma") + #Cor
theme(axis.text.x = element_blank(), #Títulos
axis.text.y = element_blank(),
axis.ticks = element_blank(),
axis.title.x = element_blank(),
axis.title.y = element_blank())

ggplotly(map)