Gap in circular histogram plot #5228
Description
Hi,
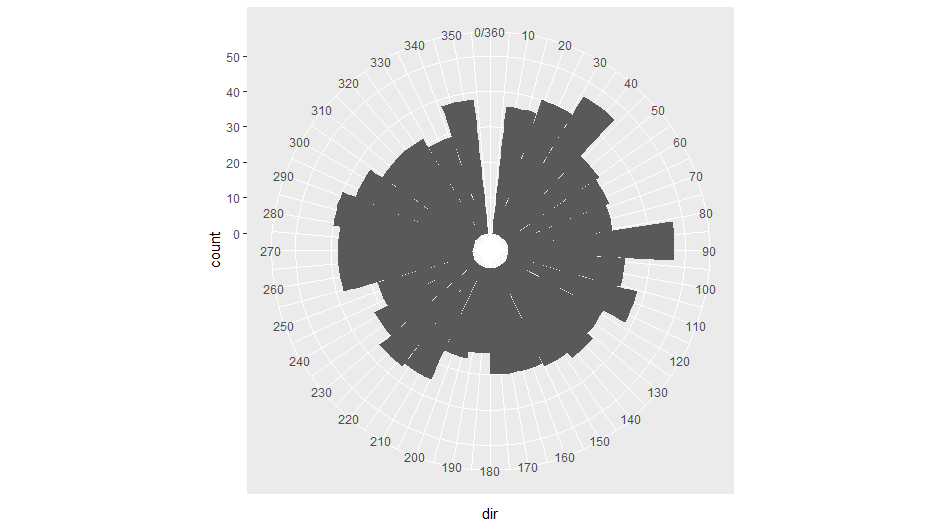
I would like to obtain a circular histogram of bird directions. Values ranged from 0 to 360 degree. If I set the limit of scale_x_continuous() to 0/360, the plot shows a gap for the 0/360 values.
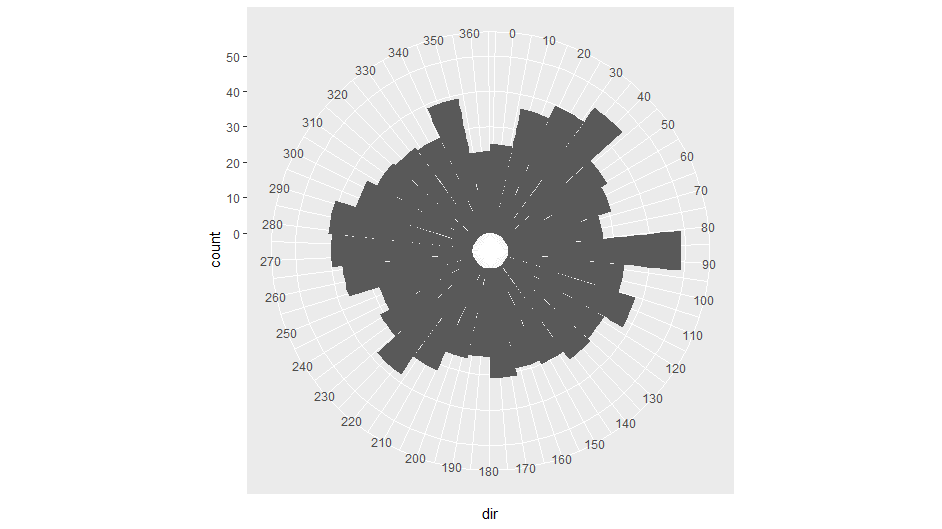
However, if I don't set any limits, the plot shows both 0 & 360, which is not quite right.
Is it possible to obtain the first plot without the gap for the value 0/360?
data2 <- data.frame(id = 1:1000,
dir = runif(1000, 0, 360))
ggplot(data2) +
geom_histogram(mapping = aes(dir)) +
coord_polar() +
scale_x_continuous(breaks = seq(0, 360, 10),
limits = c(0, 360)
) +
scale_y_continuous(limits = c(-5, 50))