Data visualization of consumption rate for tariff, area and user_id etc.
Import csv files by django custom command, and then, I visualize the data by table and chart by categories.
- chartjs==1.2
- Django==2.2.2
- numpy==1.16.4
- pandas==0.24.2
- python-dateutil==2.8.0
- pytz==2019.1
- six==1.12.0
- sqlparse==0.3.0
git clone git@github.com:takahirosawamura/data-analyzer.git
-
cd data-analyzer -
python -m venv django -
Deactivate your VM if you are running
-
activate venv(
source django/bin/activate) -
pip install -r requirements.txt -
python path/to/manage.py migrate -
data import: import csv files to DB:
python path/to/manage.py import -
data-dashboard :
python path/to/manage.py runserver
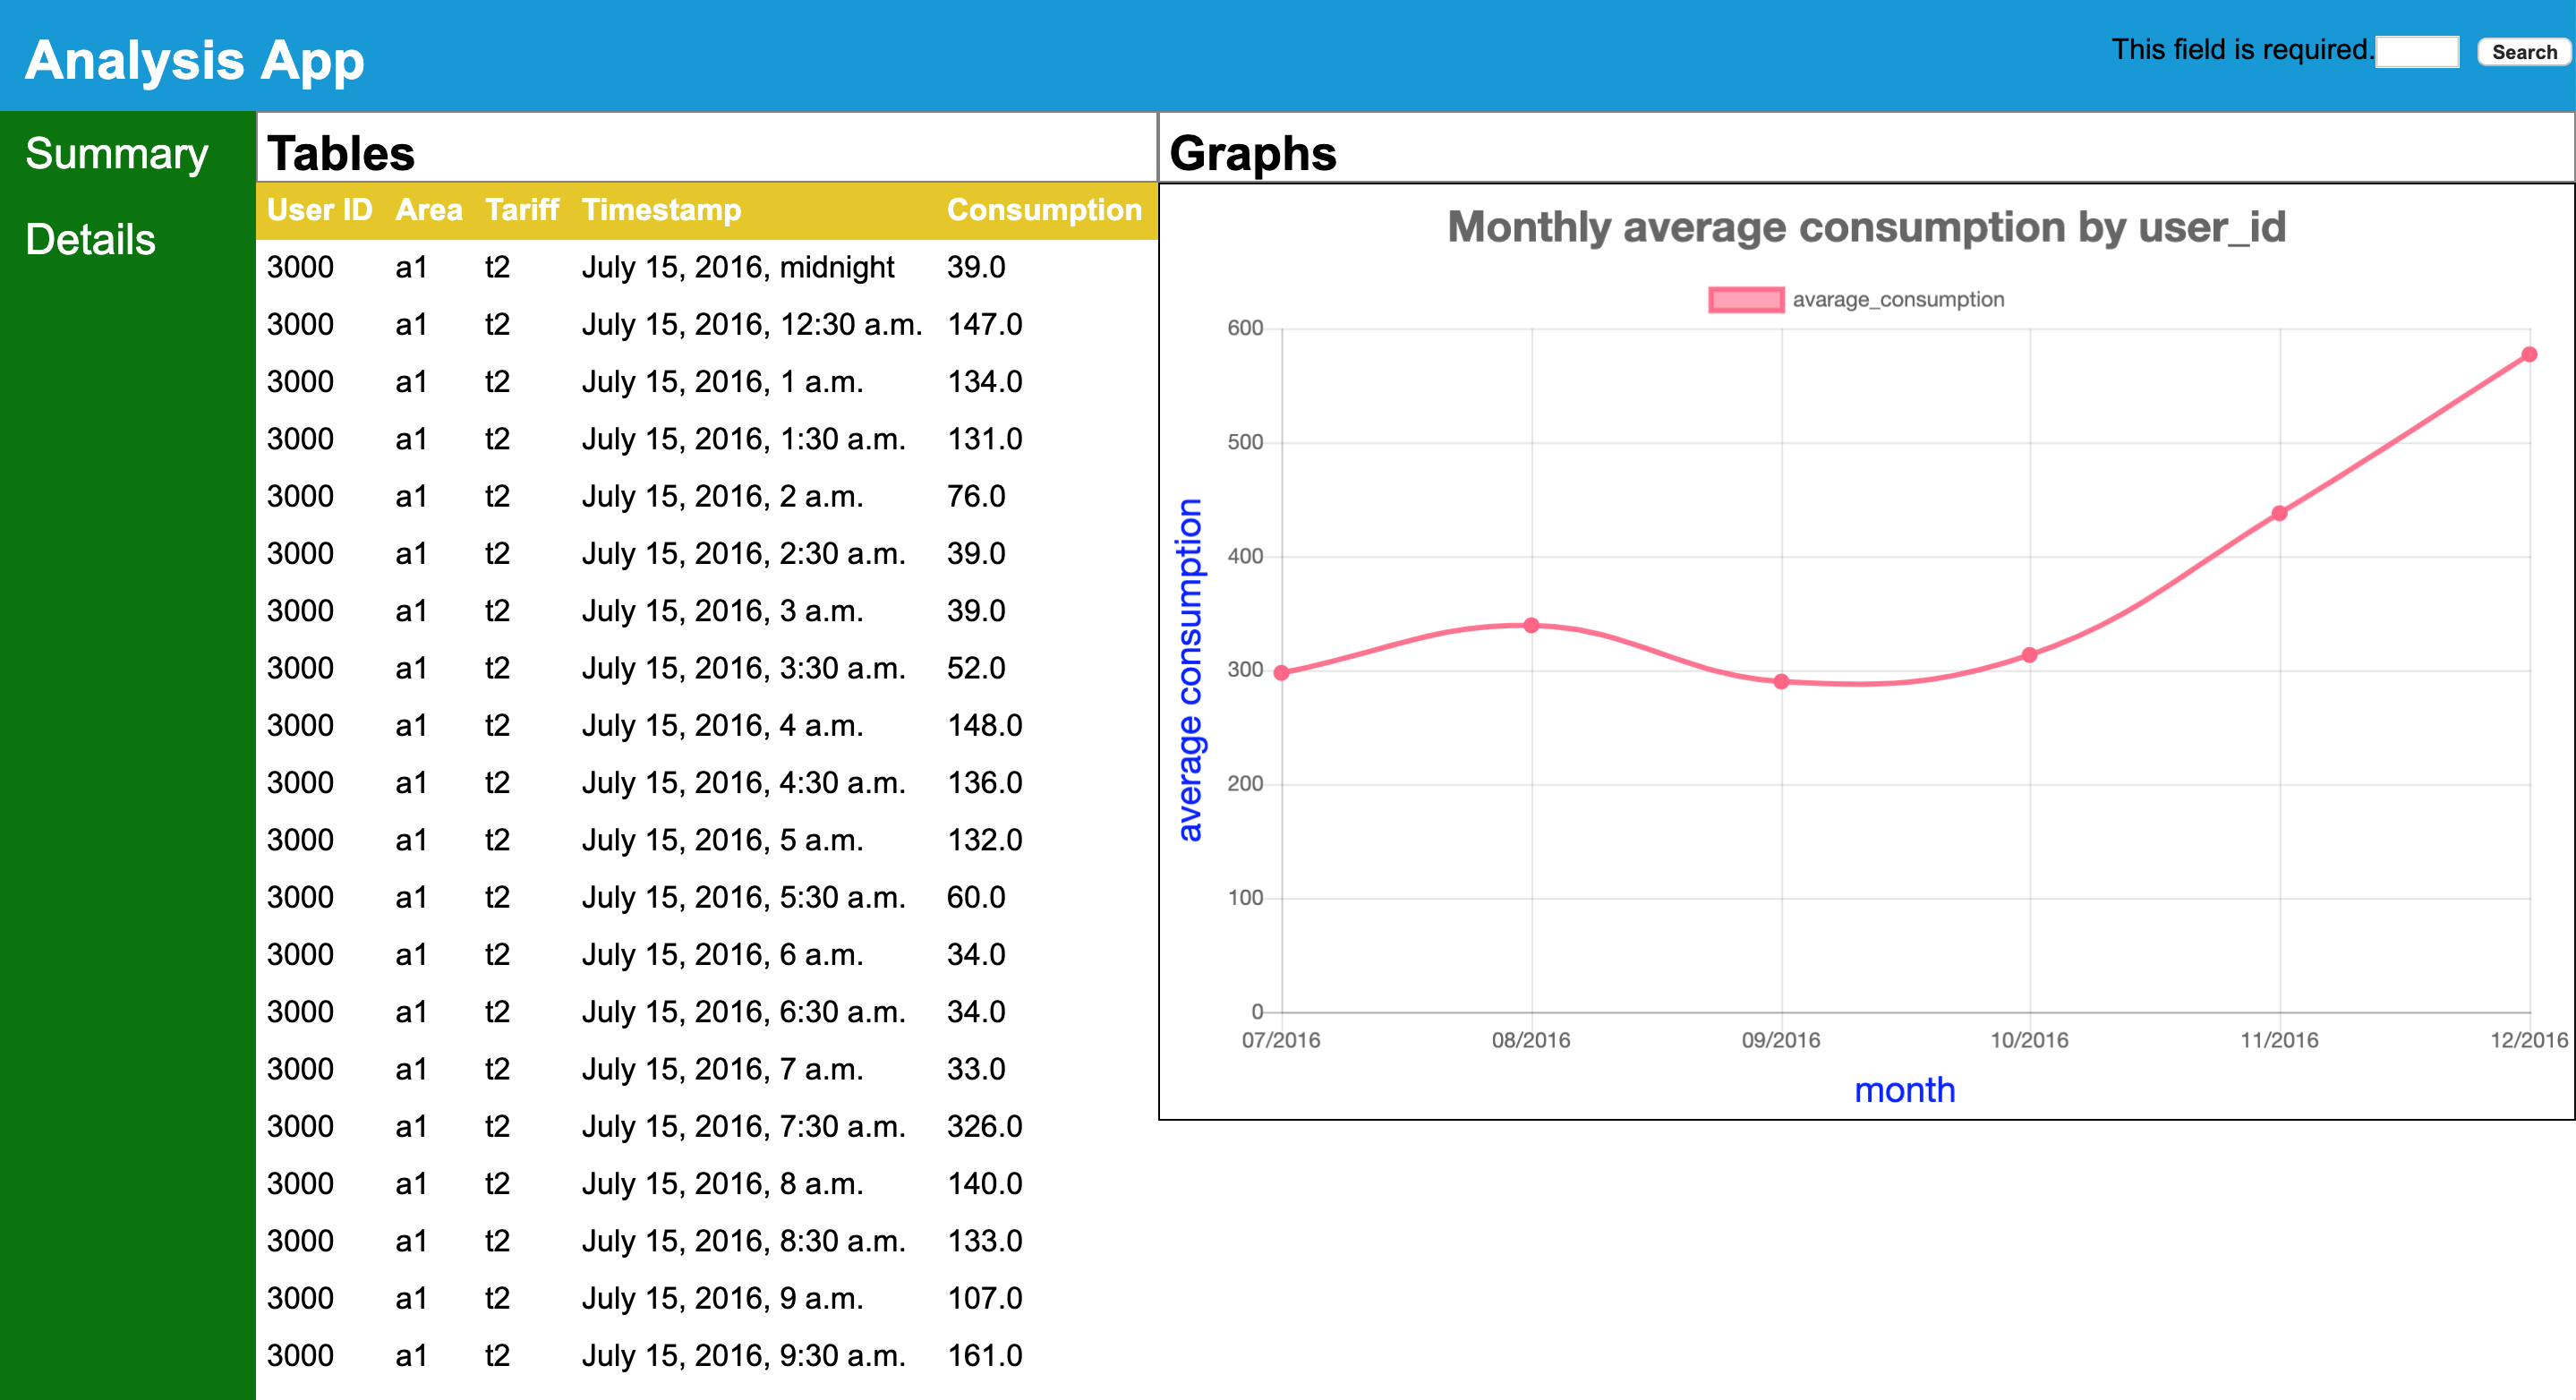
you can check the data analyzation, summary page and detail page.
you can check the db, tables and chart.

you can chack the db more than summary page. id, date, tariff, consumption etc.
Now, this app's performance is not good, so I want to tune performance, efficient query, code splitting etc.