


Small debug views for Three.js WebGPU + TSL render pipelines.
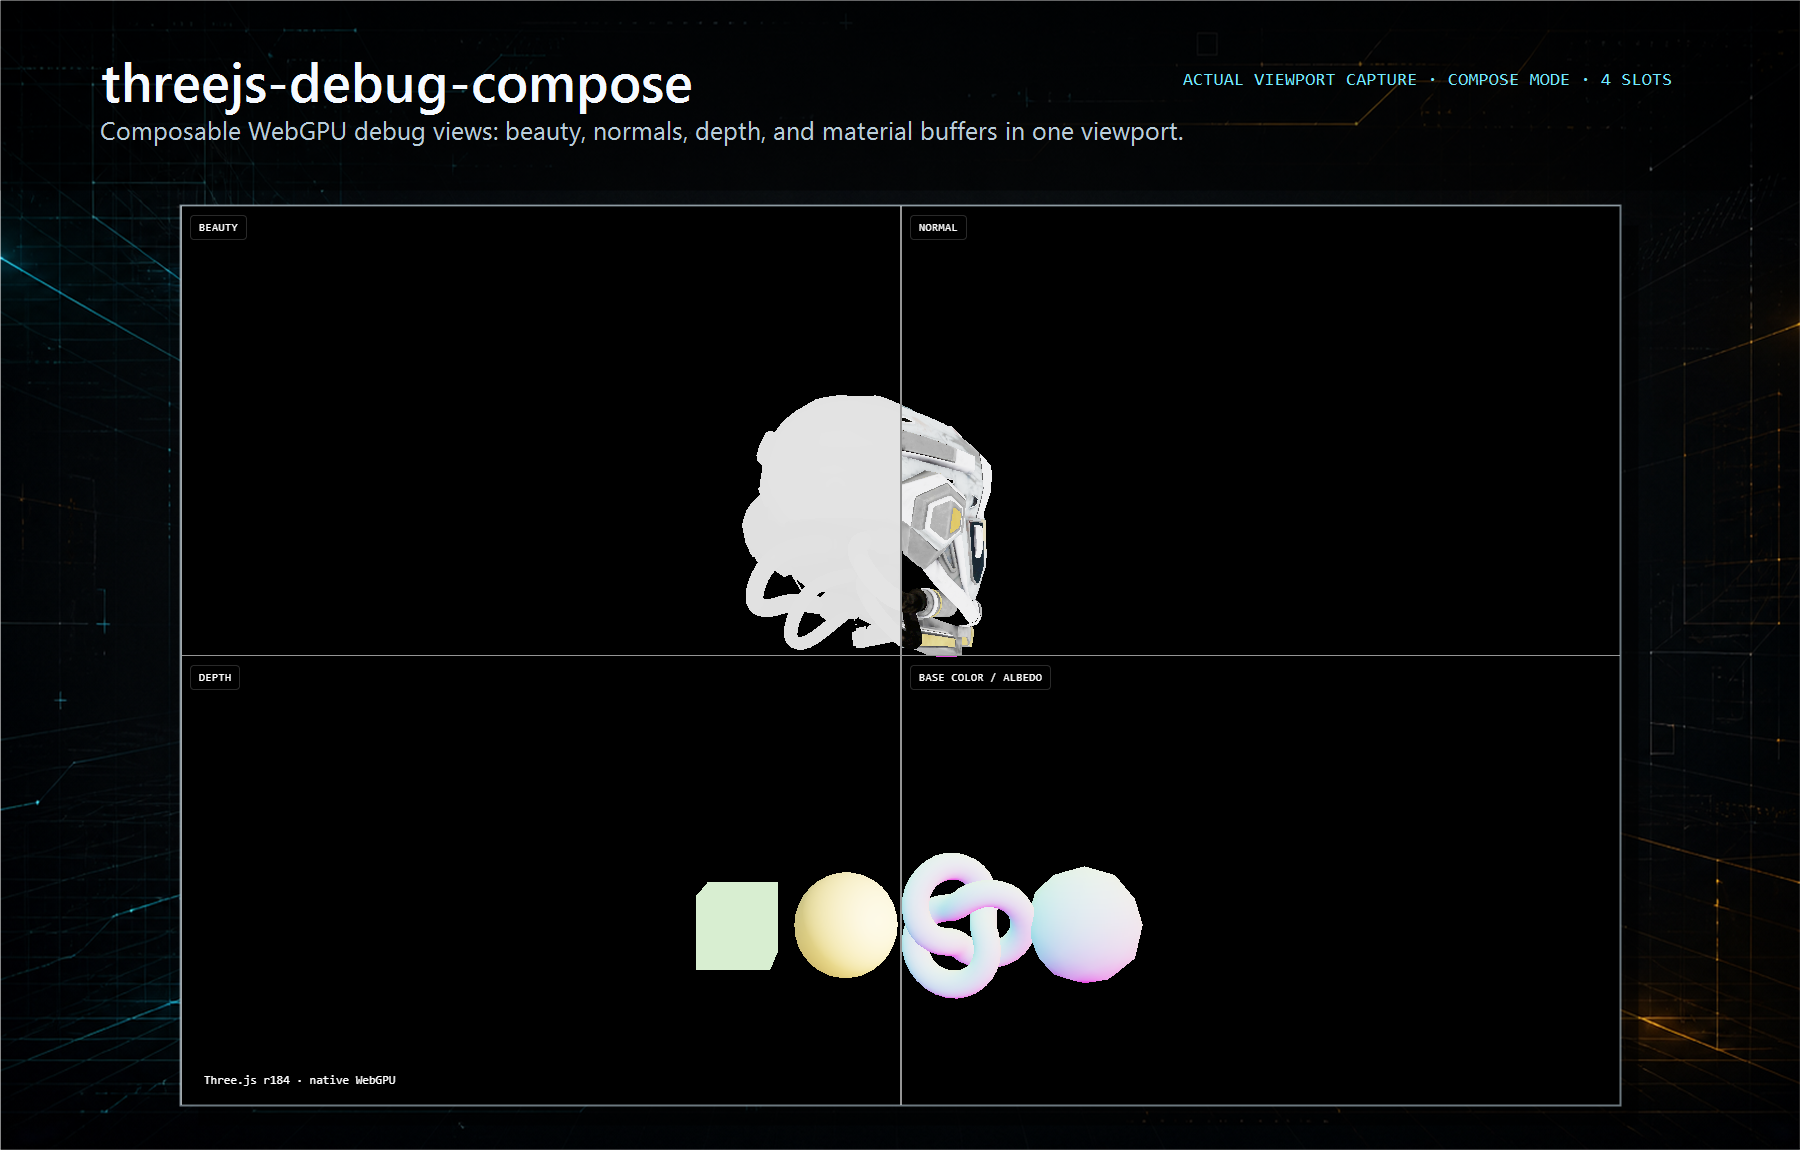
It lets you inspect what your scene is producing while you build: beauty, normals, depth, material channels, override views, and estimated shader complexity. It is focused on WebGPU debugging, not on being a full scene inspector.
pnpm add threejs-debug-view three react react-dom @react-three/fiber @react-three/drei levaThe root package is React-free. The threejs-debug-view/r3f adapter needs the React Three Fiber and Leva peers shown above.
- WebGPU-first.
- TSL-first.
- React Three Fiber adapter.
- No WebGL fallback right now.
- Not an
EffectComposerhelper.
The runtime uses three/webgpu, three/tsl, WebGPU MRT passes, and fullscreen RenderPipeline composition.
import { DebugViews, useDebugViewsControls } from "threejs-debug-view/r3f"
import { DEFAULT_DEBUG_VIEWS, getDebugViewLabels } from "threejs-debug-view"

function DebugLayer() {
  if (!import.meta.env.DEV) return null
  return <DebugControls />
}

function DebugControls() {
  const controls = useDebugViewsControls({
    viewLabels: getDebugViewLabels(DEFAULT_DEBUG_VIEWS),
  })

  return <DebugViews views={DEFAULT_DEBUG_VIEWS} {...controls} />
}
Keep the overlay behind your app's dev flag. The package is publishable, but debug views should not be mounted in production unless you intentionally expose them.
Built-in debug sources include beauty, normal, depth, base color, material normal, emissive, roughness, AO, metallic, opacity, wireframe, lighting-only, reflection-only, and estimated shader complexity.
Material scalars are packed into one RGBA target:
R: roughnessG: metallicB: AOA: opacity
Material-normal and emissive use a second material-detail pass. Wireframe, lighting-only, reflection-only, and shader-cost views are created only when the active layout needs them.
shaderCost is an estimate, not a native GPU instruction counter. It buckets materials from runtime material signals such as material type, texture slots, texture resolution, transparency, alpha test, clipping, physical-material features, and custom shader uniform count.
DebugViews has two modes:
compose: one fullscreen TSL output for single, overlay, split, row, column, and grid layouts.viewport: explicit viewport assignment with labels, per-pane resolution scale, and scissor-based presentation.
<DebugViews
  mode="viewport"
  views={DEFAULT_DEBUG_VIEWS}
  viewportViews={[
    { view: "beauty", label: "Beauty" },
    { view: "lightingOnly", label: "Lighting" },
    { view: "normal", label: "Normals", resolutionScale: 0.5 },
    { view: "roughness", label: "Roughness", resolutionScale: 0.5 },
  ]}
  layout="row"
  slots={4}
  showLabels
/>
resolutionScale is quantized to 1, 0.5, or 0.25 so render targets stay predictable.
import { float, vec4 } from "three/tsl"
import { createCustomDebugView, DEFAULT_DEBUG_VIEWS } from "threejs-debug-view"
import { DebugViews } from "threejs-debug-view/r3f"

const fresnelView = createCustomDebugView({
  id: "shader:fresnel",
  label: "Fresnel",
  node: vec4(float(1), float(0), float(0), float(1)),
})

<DebugViews views={[...DEFAULT_DEBUG_VIEWS, fresnelView]} />
Use a stable id when a custom node can be recreated between React renders. The viewport render graph uses that id to dedupe equivalent custom views.
components/debug-views/is the package source.threejs-debug-viewexports debug view definitions, planning utilities, TSL helpers, and public types.threejs-debug-view/r3fexports the R3FDebugViewscomponent and Leva controls.src/is the local demo app.packages/docs/is the Astro documentation site.
pnpm verifyFor runtime-facing WebGPU changes, also smoke-test the Vite demo in a browser with WebGPU support:
pnpm dev