Help us build the most accessible and accurate climate tech resource on the planet 📓 🌍
-
Updated
Jul 7, 2024 - JavaScript
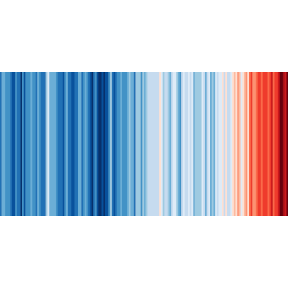
Global climate change refers to the rise of earth's temperature, caused by human factors. It originates from the greenhouse effect of certain gases in our atmosphere like carbon dioxide (CO2) or methane (CH4) that block the escaping heat. The concentration of these gases has risen dramatically by human impact since the mid of the 20th century, with the burning of fossil fuels (oil and gas) and deforestation being main causes of this rise. The observed and expected effects include more and longer periods of draught, wildfires and an increased number of extreme weather events.
Help us build the most accessible and accurate climate tech resource on the planet 📓 🌍
Open Energy Dashboard (OED)
Web based data visualisation project using JavaScript libraries for the EDA as well as the final visualisation using d3.js
🆘 La evolución de las temperaturas en 45 estaciones de la AEMET en España.
Kroenger is a not-for-profit for environmental education and conservation
🌊 MEANDRE présente de manière guidée un regard d'expert sur les résultats des projections hydrologiques réalisées sur la France. La mise à jour de ces projections a été réalisé entre 2022 et 2024 dans le cadre du projet national Explore2. Ces résultats sont un aperçu de quelques futures possibles pour la ressource en eau.
The front end of the treetracker web map app.
Save the planet by collecting litter, planting seeds and overwhelming the enemy robots.
🔥 Global warming information and data
Open Source Fellow Sandbox
"This work aims to redefine our relationship with nature by fostering kinship with plants, emphasizing not just their preservation but transforming our connection to nurture respect and acknowledge their agency in the ecological community."
Utilizing OpenStreetMap and population datasets , this application conducts a comprehensive analysis of population distribution and public service coverage. It identifies high-density areas lacking essential services, offering invaluable insights for urban planning and policy development
pacta.portfolio.report
Panell de l'estat de sequera i dels embassaments a Catalunya
NYU Advanced GIS with Chris Whong Assignment 4
Progressive Web Application that displays extracted data from the official web https://dadescovid.cat
"What can I do about the climate crisis?" Here are 326 things you can do.
Resource Watch features hundreds of data sets all in one place on the state of the planet’s resources and citizens. Users can visualize challenges facing people and the planet, from climate change to poverty, water risk to state instability, air pollution to human migration, and more.
CHE110 Project - Explore climate change causes, impacts, and solutions. Get updated on research, engage with interactive tools, and discover ways to take action..
Created by Humanity