A computational notebook community for open environmental data science 🌎
-
Updated
Jul 3, 2024 - TeX
Global climate change refers to the rise of earth's temperature, caused by human factors. It originates from the greenhouse effect of certain gases in our atmosphere like carbon dioxide (CO2) or methane (CH4) that block the escaping heat. The concentration of these gases has risen dramatically by human impact since the mid of the 20th century, with the burning of fossil fuels (oil and gas) and deforestation being main causes of this rise. The observed and expected effects include more and longer periods of draught, wildfires and an increased number of extreme weather events.
A computational notebook community for open environmental data science 🌎
Scenario analysis notebooks for the IPCC Special Report on Global Warming of 1.5°C
This repository contains all data exploration notebooks for OpenGeoScales project
Tutorial notebook of the pyam package
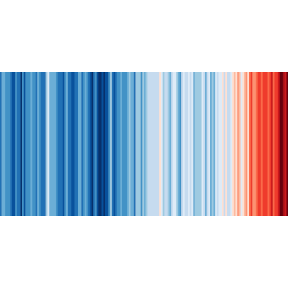
This jupyter notebook is for visualising the climate change in the years from 1750 to 2015.
Visualizing trends and patterns how climate change affects agriculture (Python, Jupyter Notebook)
🌳 🌍 📓 Code and data for Tagliari et al. 2021, Not all species will migrate poleward as the climate warms: the case of the seven baobab species in Madagascar. Global Change Biology.
City - Open Climate Reader: A proof-of-concept prototype for a semanticClimate publication built on a Quarto / Jupyter Notebook model for computational publishing
This is a Data Analysis Notebook to explore the data from Kaggle on Climate Change: Earth Surface Temperature Data Exploring global temperatures since 1750.
Precipitation climatology anomalies of Tanzania, shedding light on drought in the East African country. A jupyter notebook tutorial for geospatial analysis of netcdf data, and precipitation time series.
Computational essay physics, waves and oscillations. The notebook is about fourier analysis, some basic fourier theory and finally a real world usecase where i use historical weather data and apply fourier analysis on this data to look for anomalies and changes that could indicate climate change.
Documentation and Jupyter notebooks for the ClimAg research project
GitHub repo for the Advanced Classification Sprint Team ZM3 Notebook
Exploratory Data Analysis powered by Pandas, Plotly and Jupyter Notebook, spotlighting global CO2 emissions trends and analyzing correlations with GDP, population, and global temperature.
Created by Humanity