# 💰 Income & Expense Tracker
A web application to track **income and expenses** with interactive charts.
This project helps users visualize their financial data clearly using **Bar Chart** and **Pie Chart** (browser visits or any static analytics).
---
## 🚀 Features
- ➕ Add Income & Expense with category, method, description
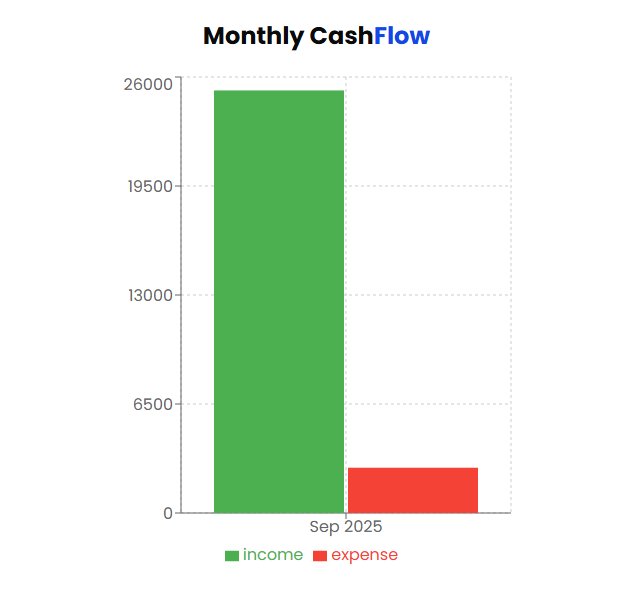
- 📅 Track data by **date (month wise aggregation)**
- 📊 View **Monthly Income vs Expense** (Bar Chart)
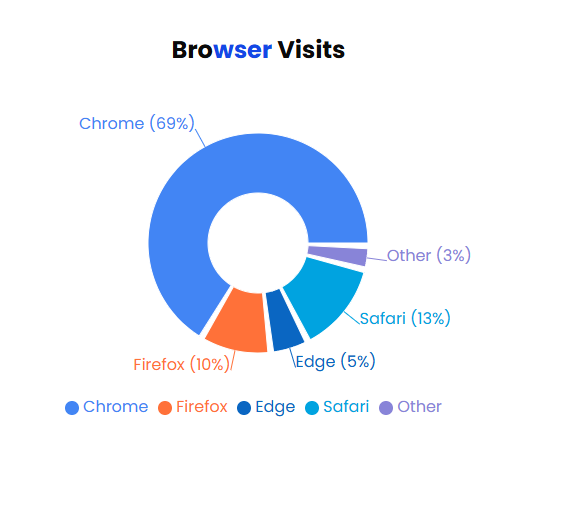
- 🥧 Static Pie Chart to display browser visit statistics
- 🌐 Responsive UI for desktop & mobile
---
## 🛠️ Tech Stack
- **Frontend:** React.js, Tailwind CSS, Chart.js
- **Backend:** Node.js, Express.js, MongoDB
- **State Management:** React Hooks (`useState`, `useEffect`)
---
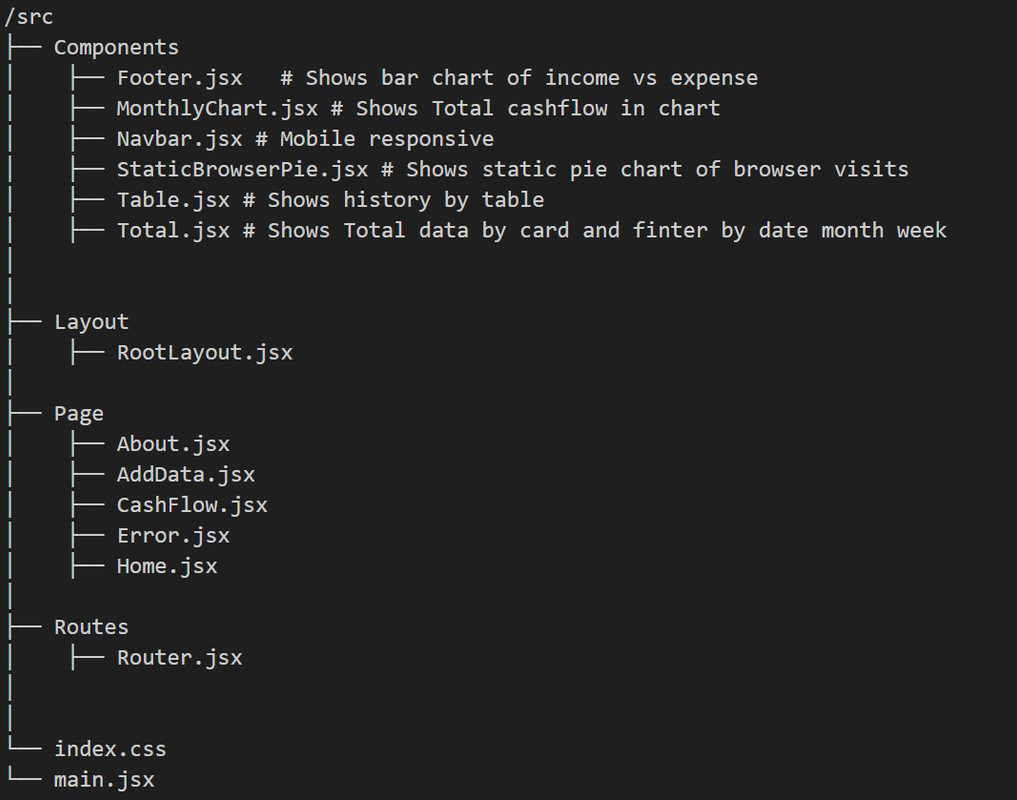
## 📂 Project Structure
---
## 🔗 Links
- **Live Demo:** [Live Website](https://cashflow-client-six.vercel.app/)
- **Server Repo:** [Server Repo](https://github.com/mdtarikulislam1/Cashflow-server)
- **Client Repo:** [Client Repo](https://github.com/mdtarikulislam1/Cashflow-client)
---
## ⚙️ Installation & Setup
1. Clone the repository:
```bash
git clone https://github.com/mdtarikulislam1/Cashflow-client.git
cd Cashflow-client-
Install dependencies:
npm install
-
Run the development server:
npm run dev
-
Open in browser:
http://localhost:5173

[
  {
    "type": "income",
    "amount": "20000",
    "category": "job",
    "method": "bank",
    "description": "Salary",
    "addDate": "2025-09-27"
  },
  {
    "type": "expense",
    "amount": "5000",
    "category": "food",
    "method": "cash",
    "description": "Dinner expense",
    "addDate": "2025-09-15"
  }
]
This project is licensed under the MIT License.
Pull requests are welcome. For major changes, please open an issue first to discuss what you would like to change.