Currently I have this kind of visualization of Horizontal Bar Series with Label Series included for this data.

As you can see I have achieved to position labels above and below columns and at the end of each column
What I want to achieve is to have labels at the each end of each column (below at start and also above at the end of a column).
My code currently looks like this:
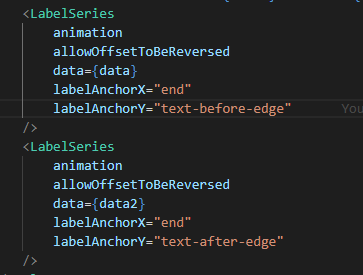
Dummy data arrays are:
let data = [{ y: 1, x: 10, label: 'X 5000$' }, { y: 2, x: 5, label: 'Y 5000$' }, { y: 3, x: 15, label: 'Z 5000$' }];
let data2 = [{ y: 1, x: 20, label: 'X2 5000$' }, { y: 2, x: 25, label: 'Y2 5000$' }, { y: 3, x: 15, label: 'Z2 5000$' }];
Does anyone have the idea how to achieve that?
Thanks in advance.
Currently I have this kind of visualization of Horizontal Bar Series with Label Series included for this data.
As you can see I have achieved to position labels above and below columns and at the end of each column
What I want to achieve is to have labels at the each end of each column (below at start and also above at the end of a column).
My code currently looks like this:
Dummy data arrays are:
Does anyone have the idea how to achieve that?
Thanks in advance.