Labels in Sankey chart aren't centered, relative to associated rectangle. For example, in docs site <img width="946" alt="screen shot 2018-08-20 at 11 35 31 am" src="https://user-images.githubusercontent.com/3478203/44359695-7cfac580-a46d-11e8-97c7-2f91328014e0.png"> <img width="929" alt="screen shot 2018-08-20 at 11 35 37 am" src="https://user-images.githubusercontent.com/3478203/44359699-7f5d1f80-a46d-11e8-8aec-c0c80aebc113.png"> The position of `Road Transport`(far right) is off, and it's not clear which rectangle `Solar`(bottom left) is associated with.
Labels in Sankey chart aren't centered, relative to associated rectangle.
For example, in docs site

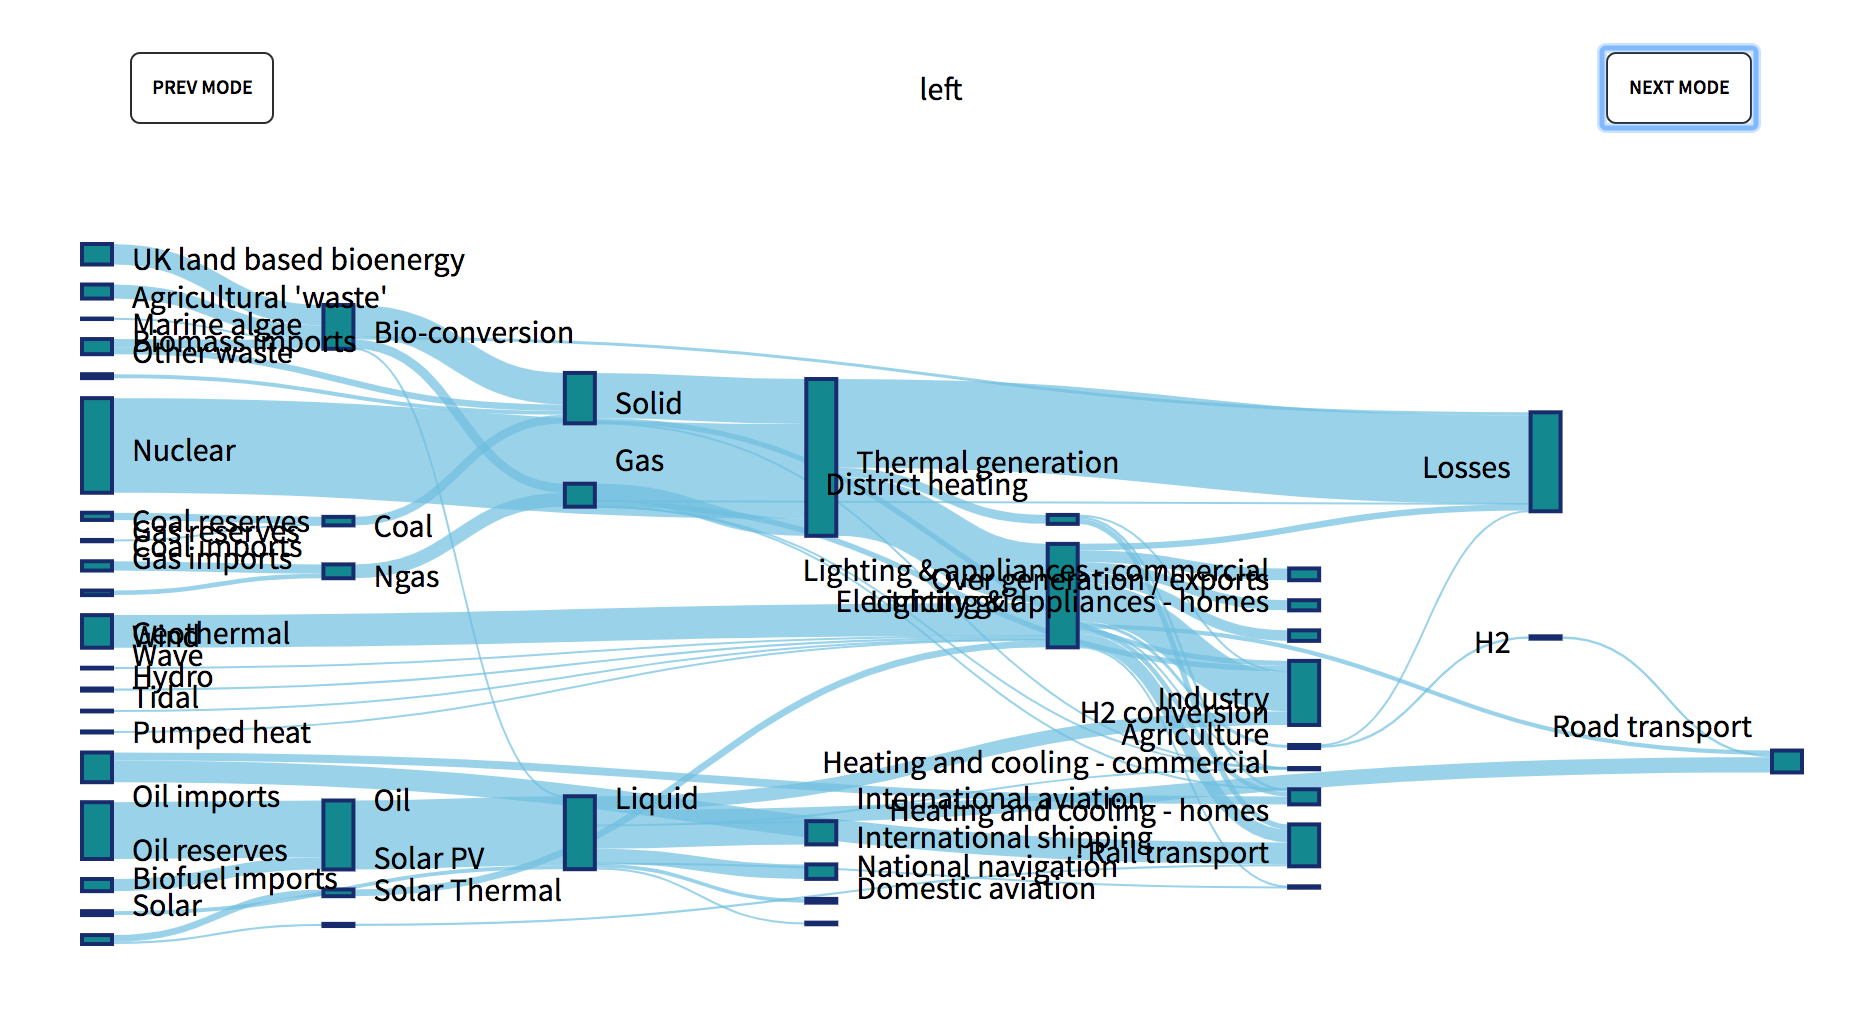
The position of
Road Transport(far right) is off, and it's not clear which rectangleSolar(bottom left) is associated with.