Your year in code, one slide at a time.
Because we devs also deserve cool things, GitHub Wrapped is a self-hosted Vite + Svelte SPA that pulls your GitHub activity through the API and turns it into an animated slideshow, think Spotify Wrapped, but for commits. Clone it, drop in a token, run pnpm dev.
- Intro - profile card with avatar, name, bio, and year
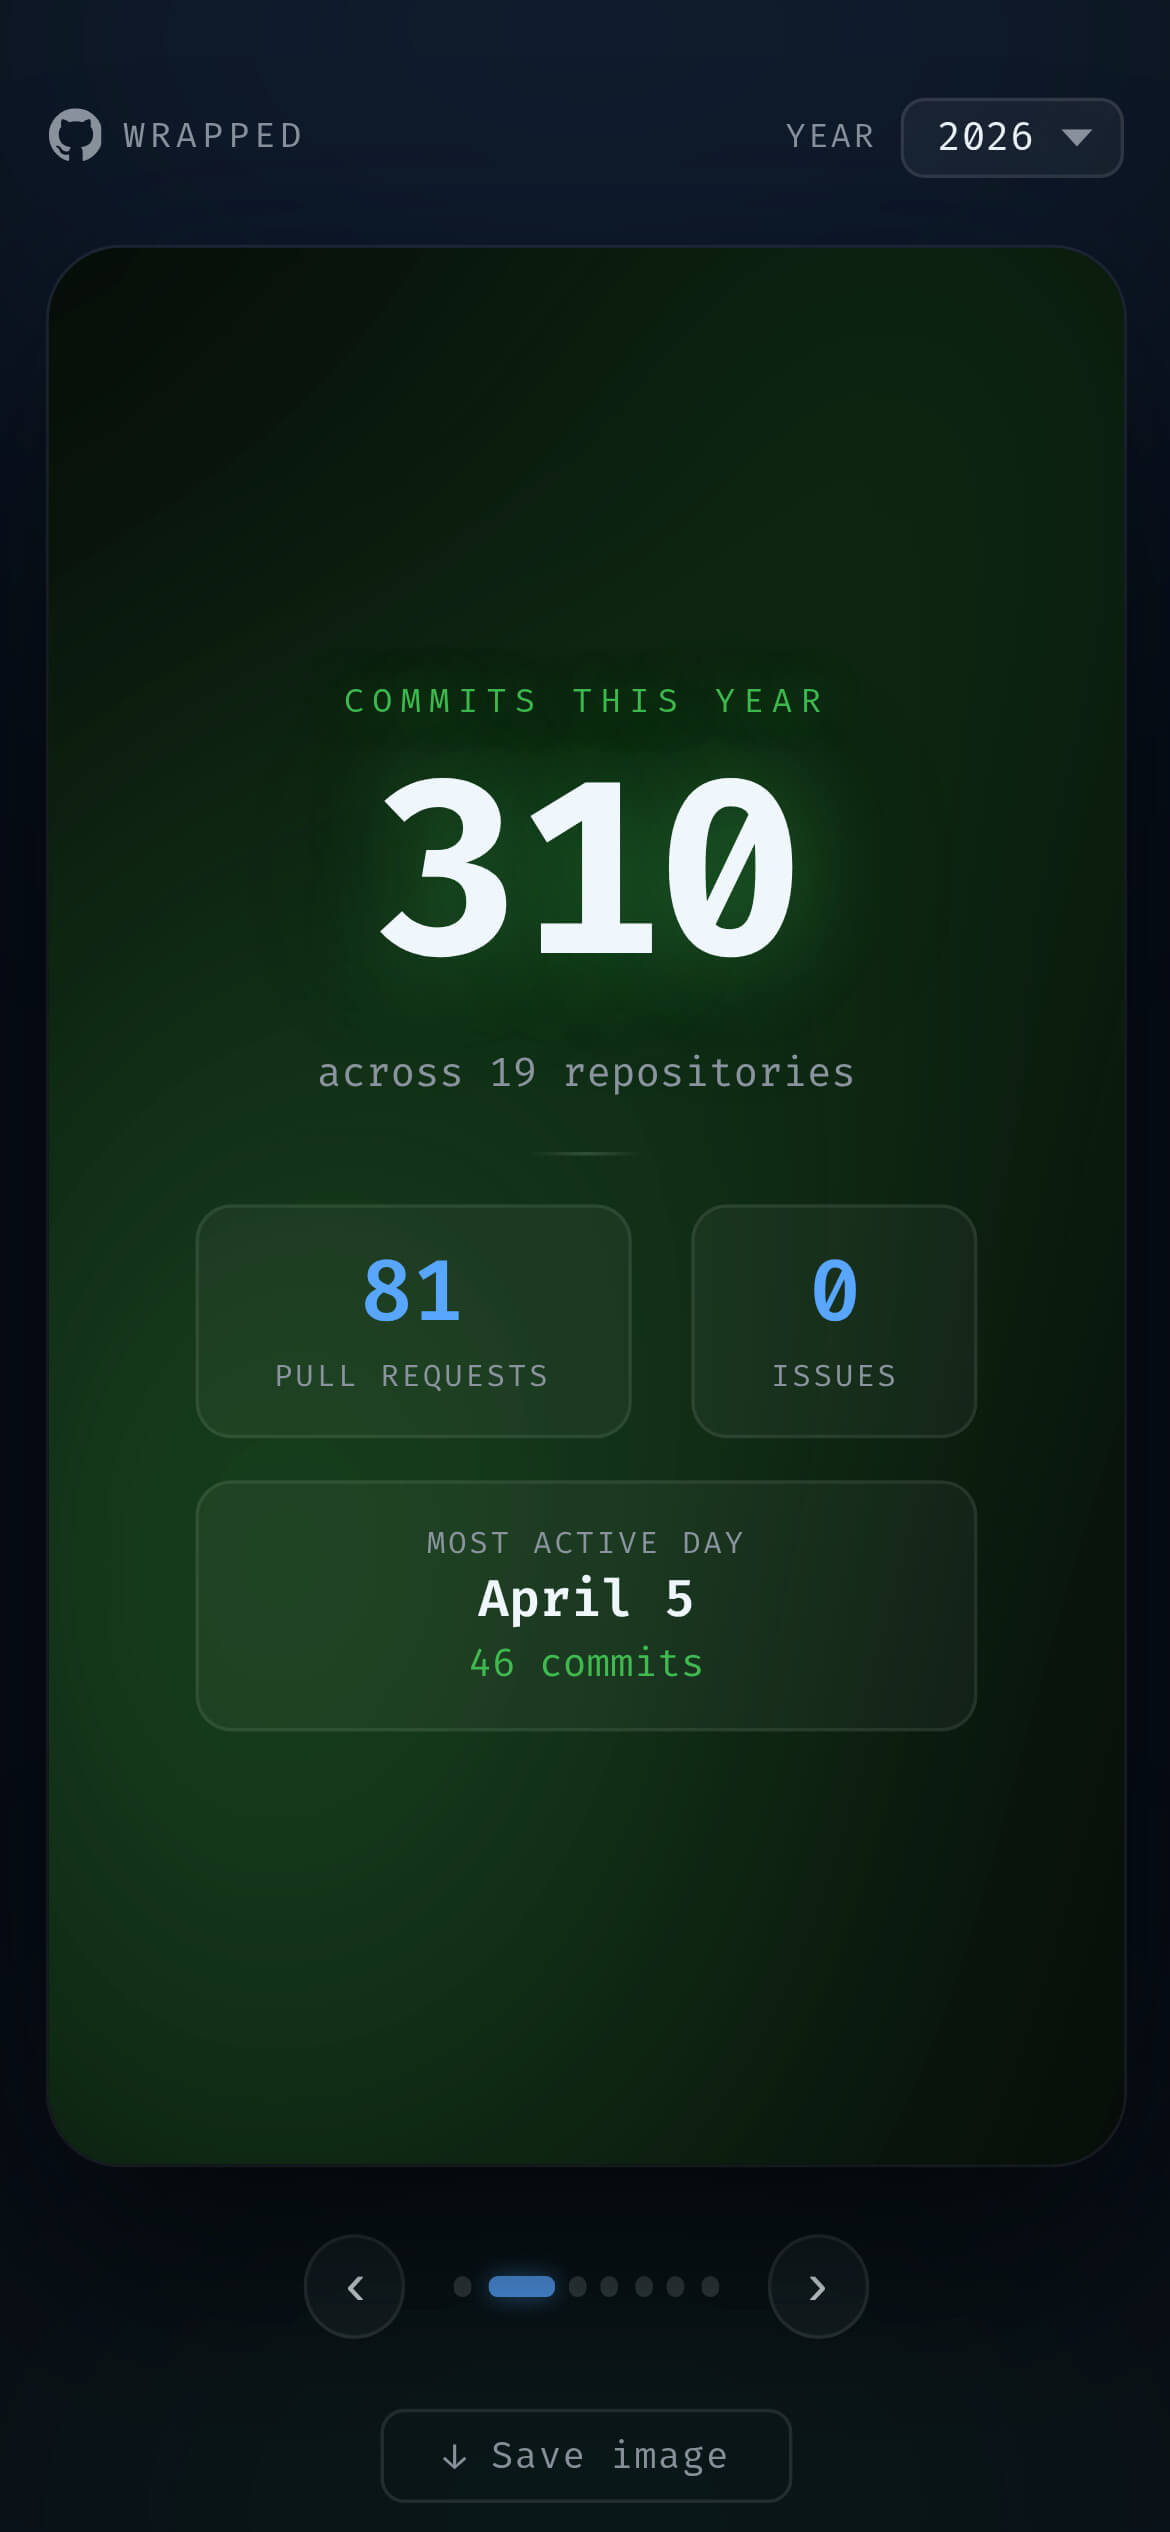
- Commits - animated counter for total commits, pull requests, issues, and your most active day
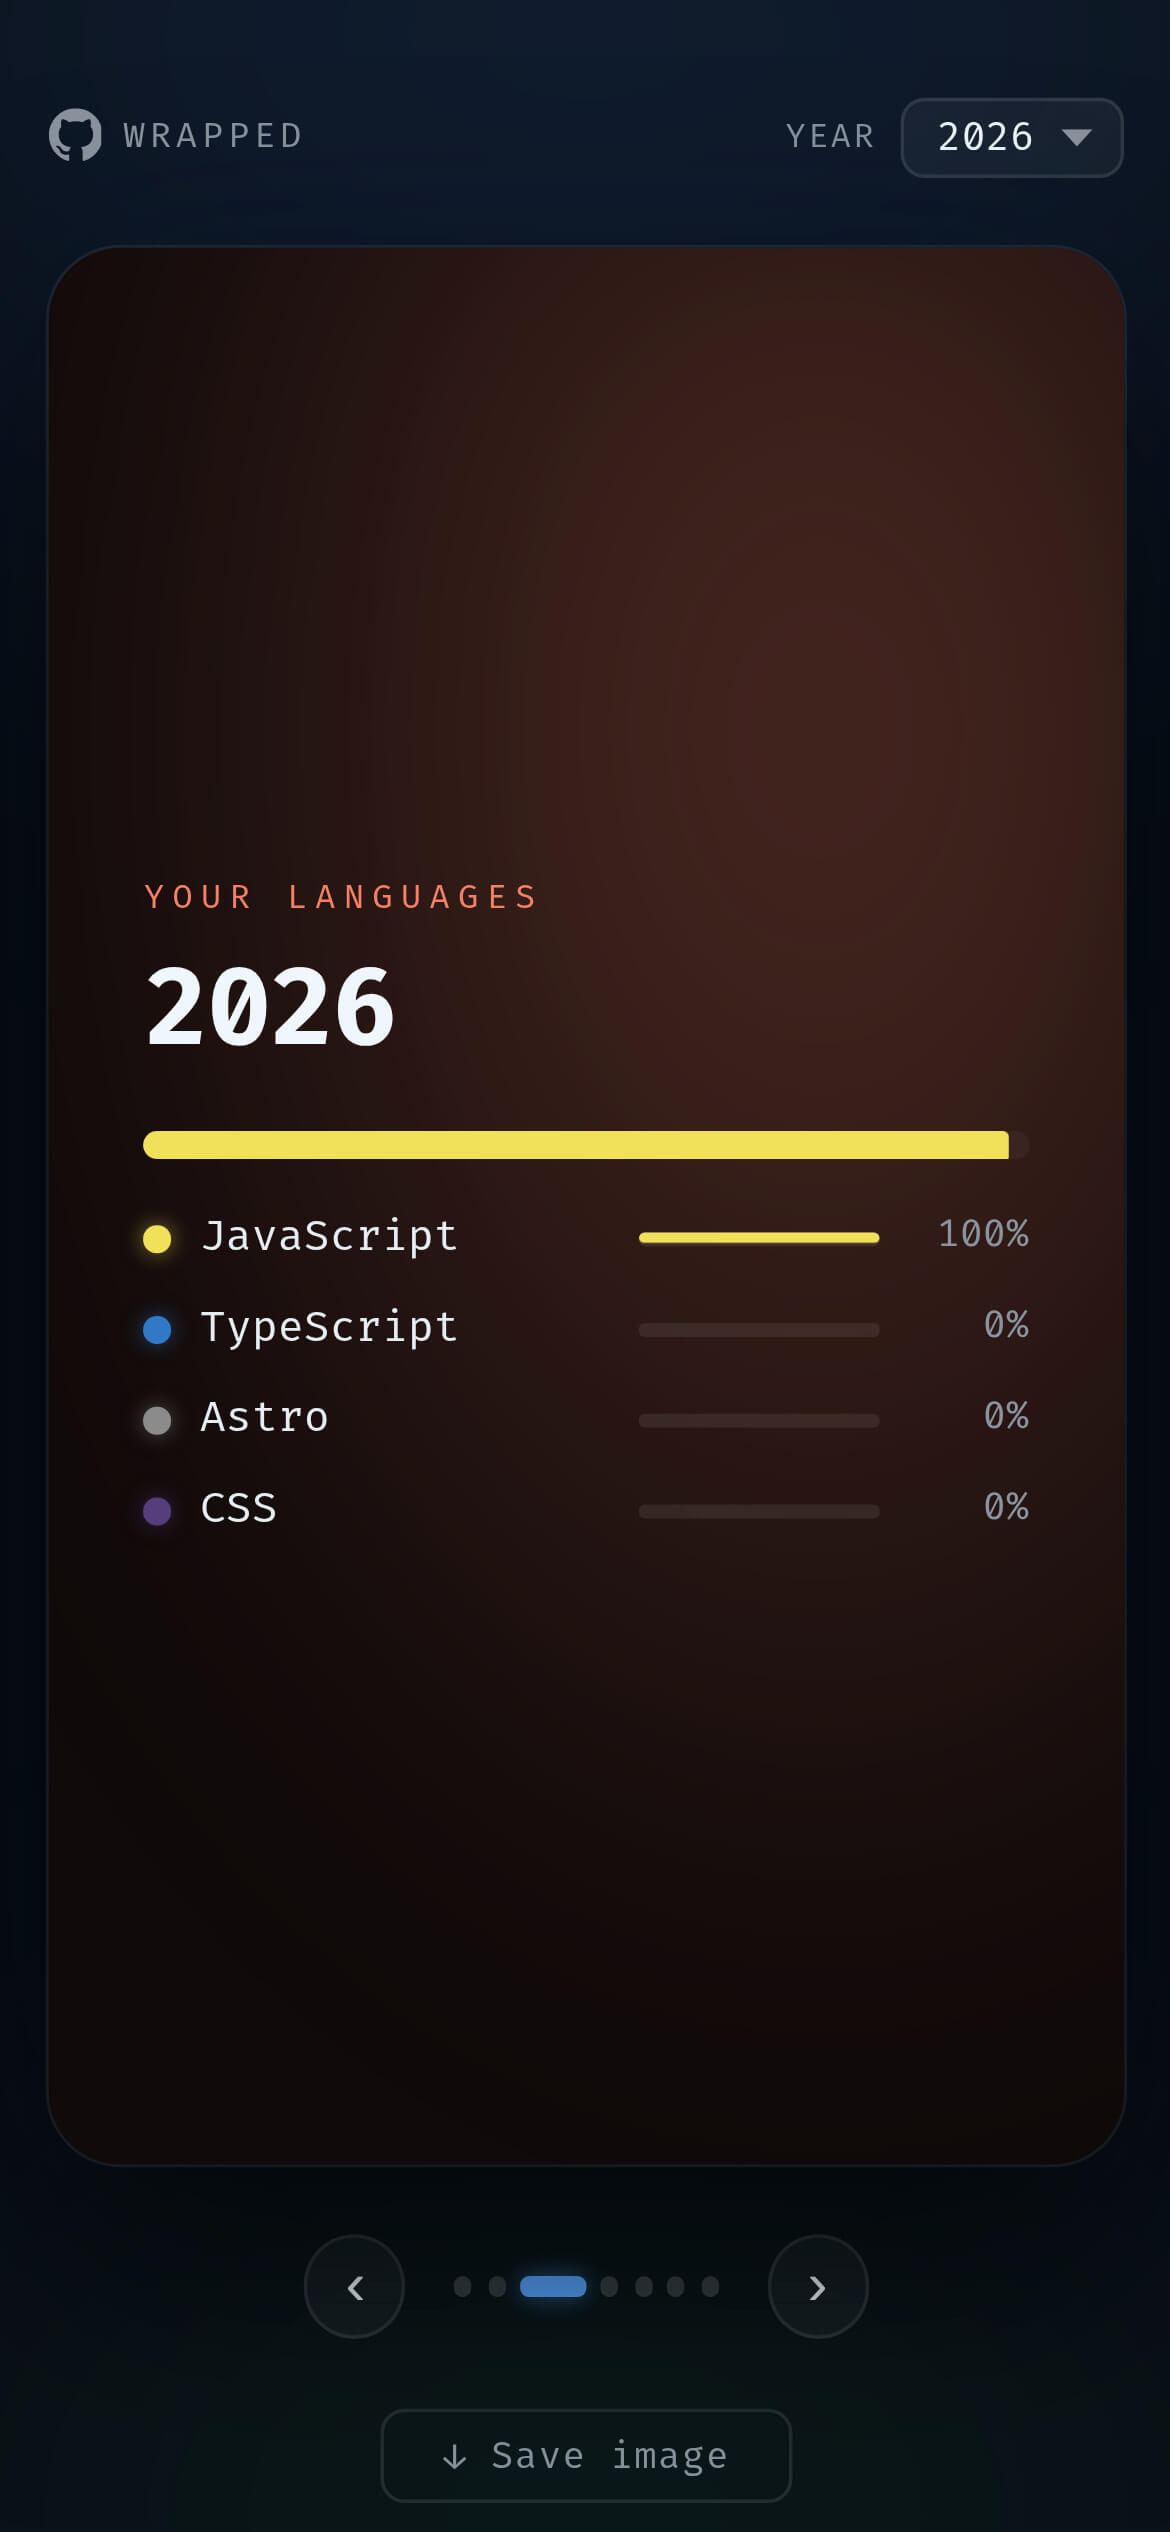
- Languages - top 5 languages by repo size, with a segmented bar and percentage breakdown
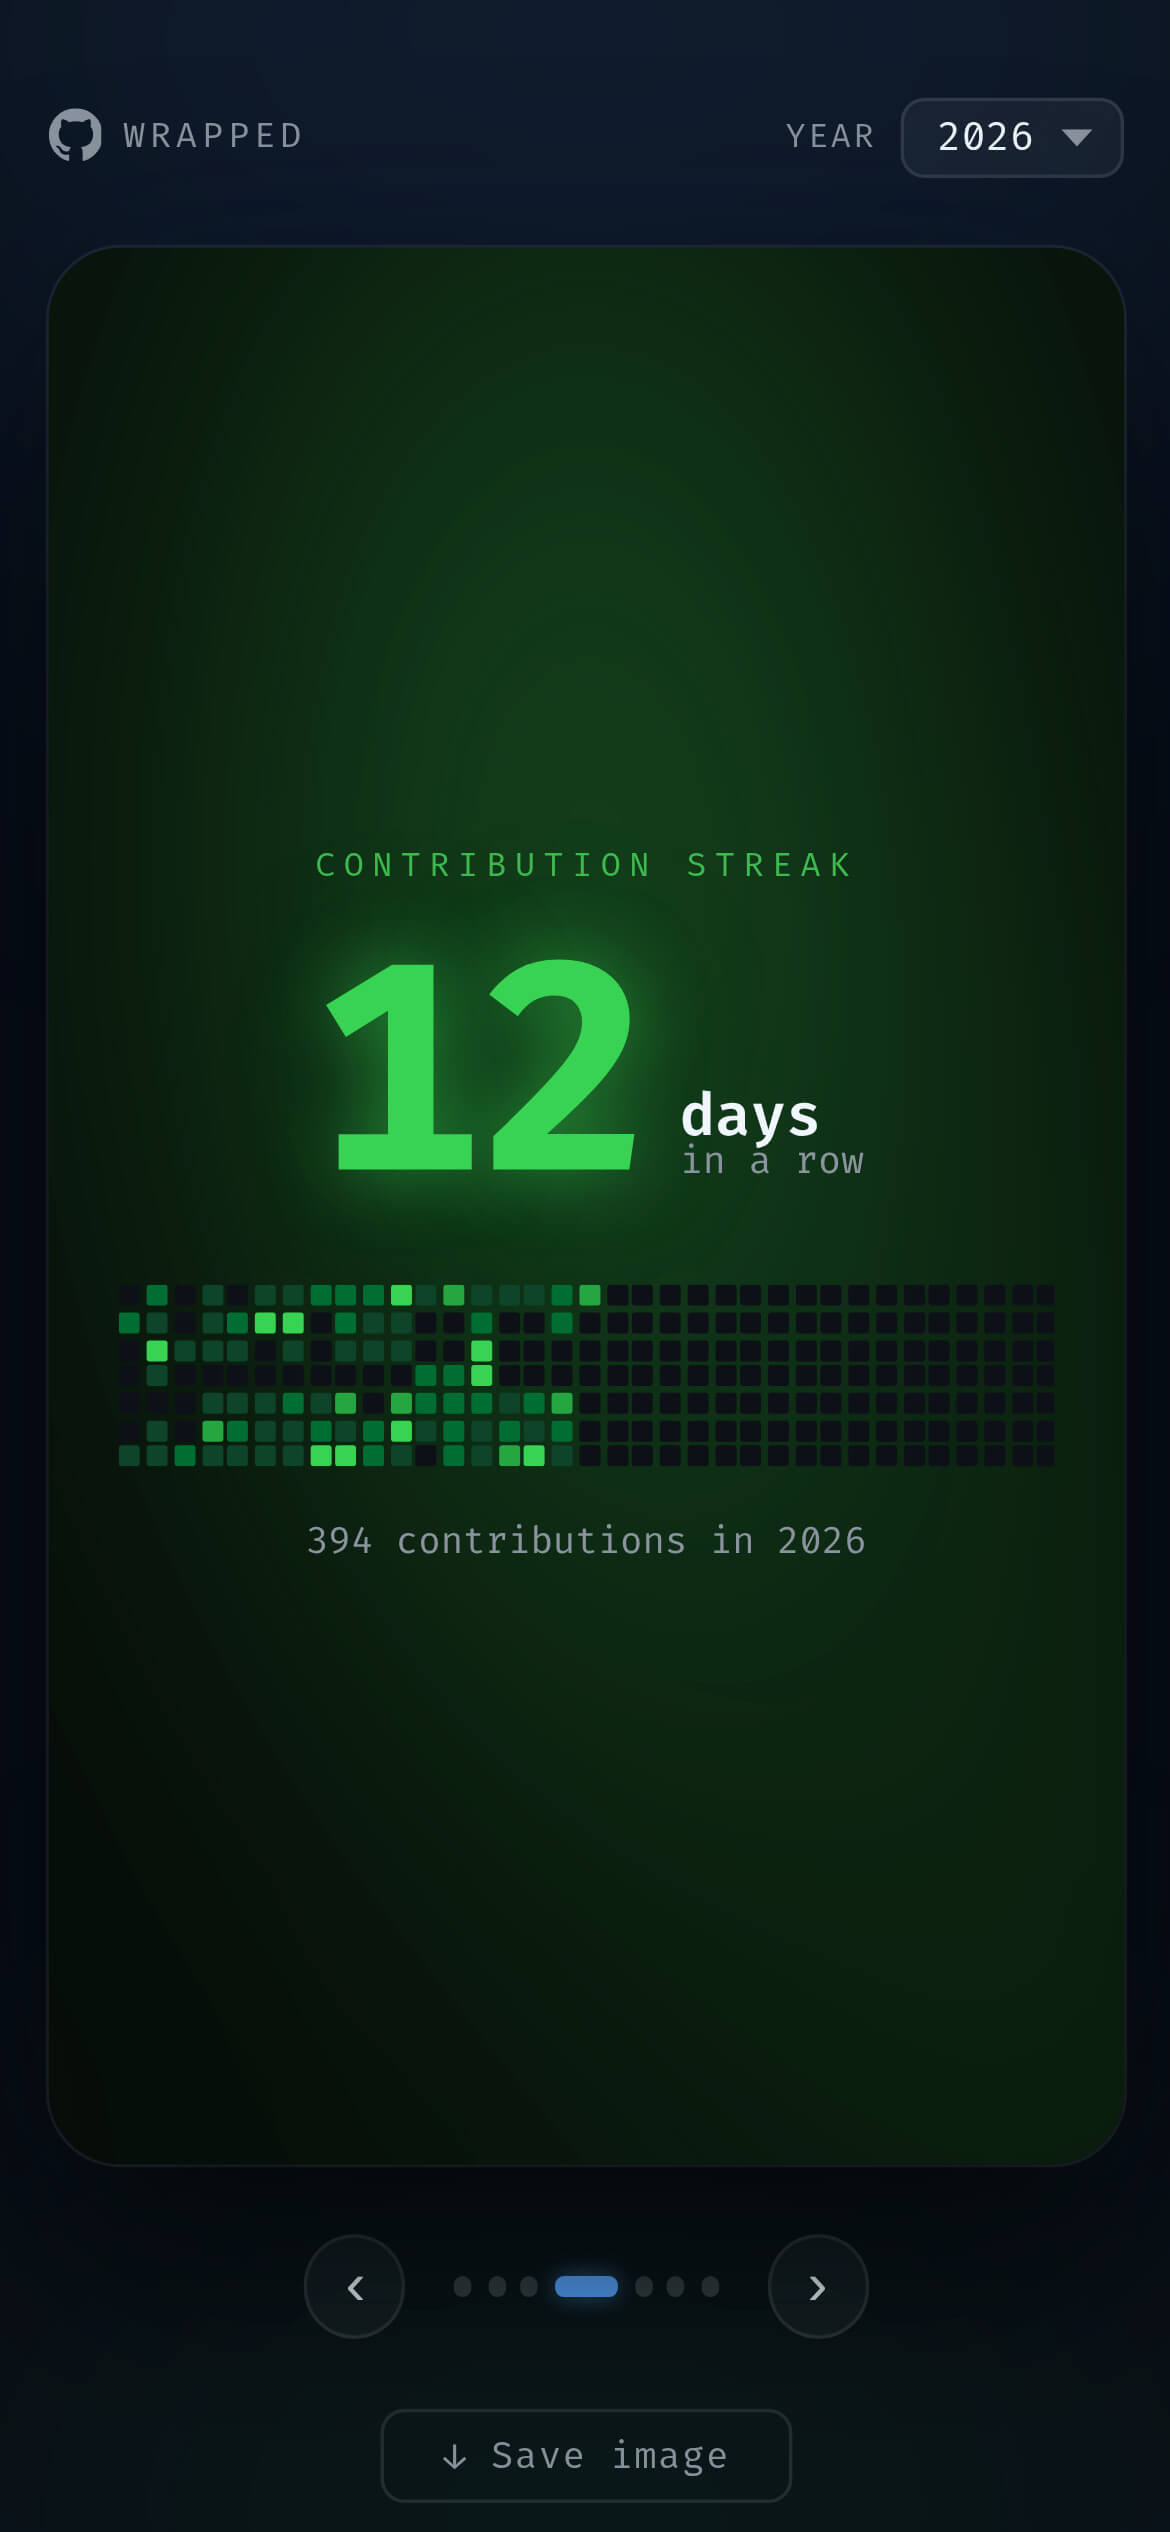
- Streak - longest contribution streak with the full year heatmap
- Repos - top 3 repos by stars, with description, language, and fork count
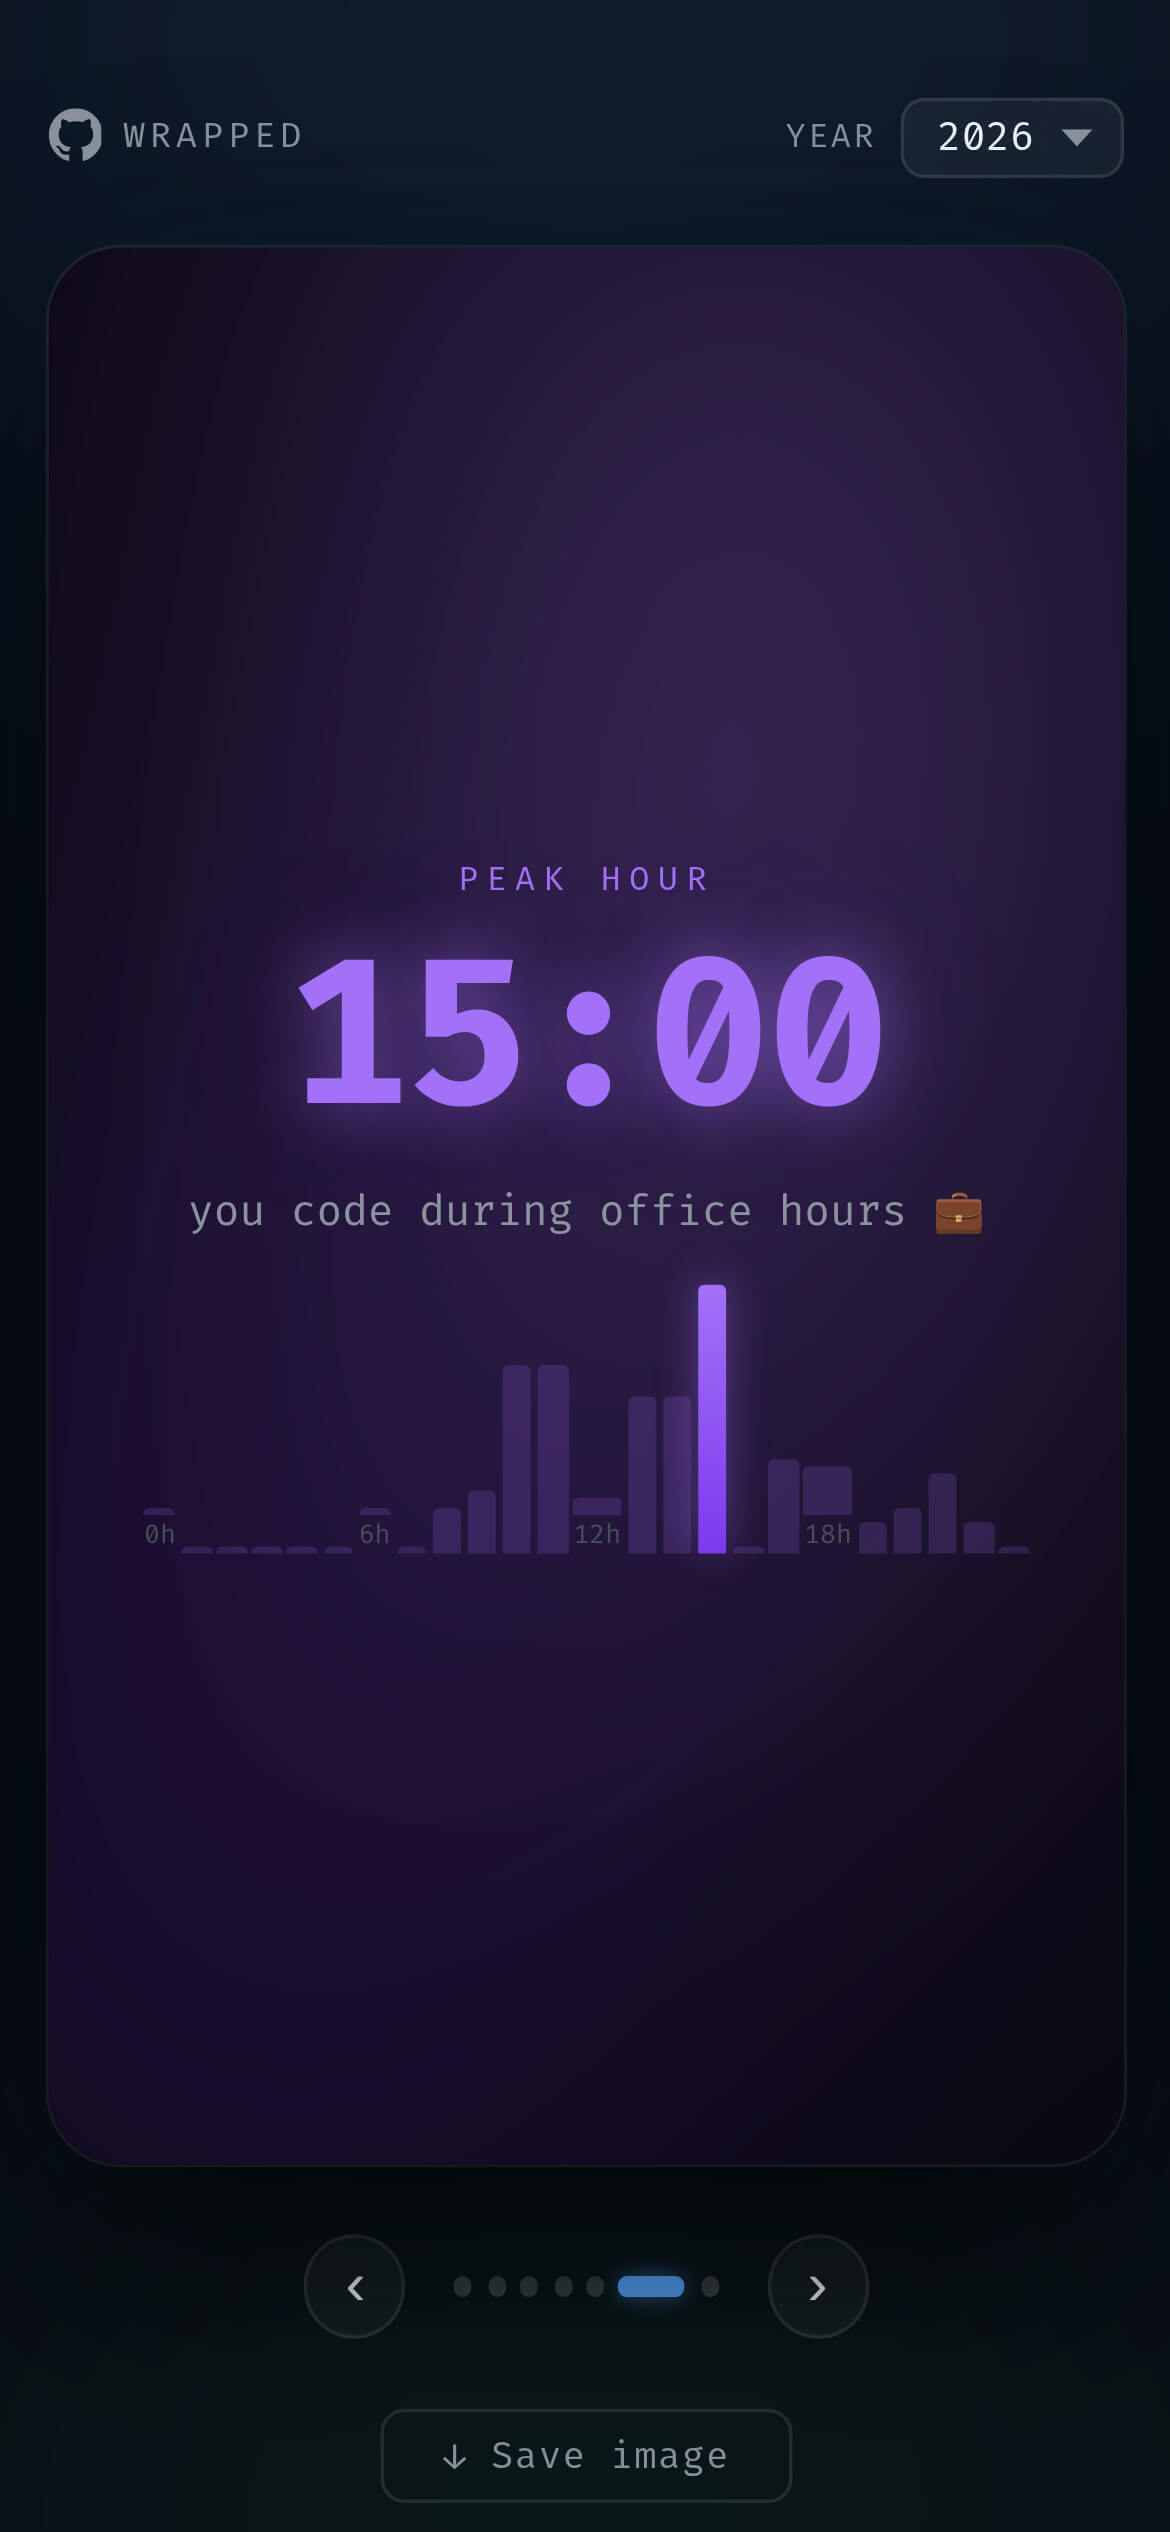
- Peak hour - bar chart of push activity by hour so you know when you actually code
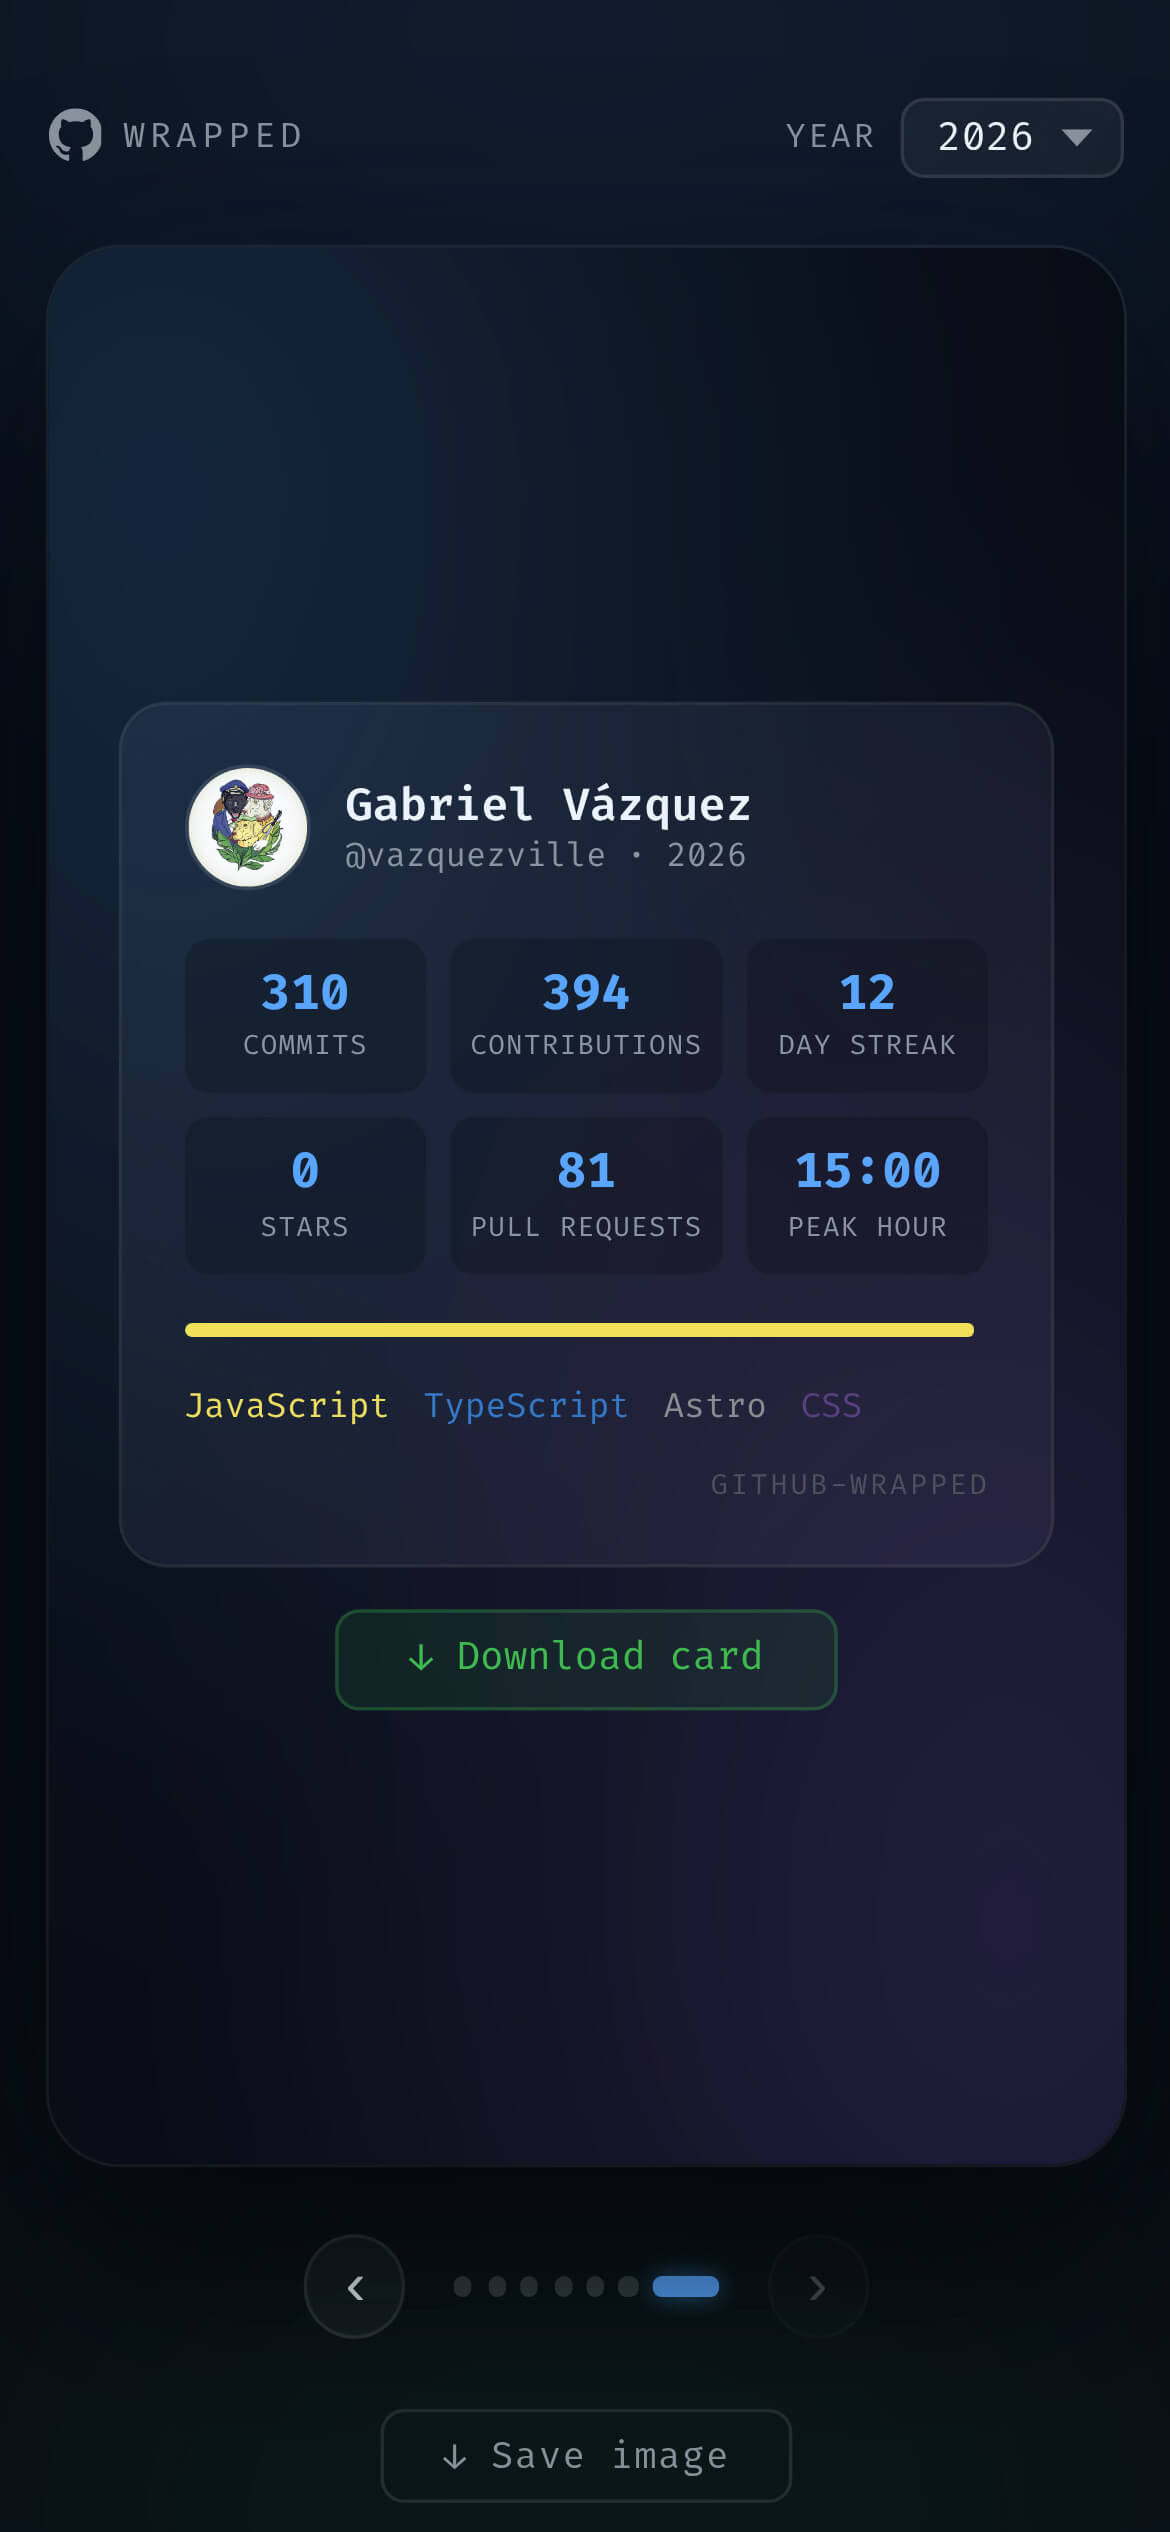
- Summary - shareable card with all stats in one view, exportable as PNG
- Year selector - switch between any year back to 2015, re-fetches live
- Keyboard navigation (arrow keys), swipe on mobile, dot navigation
- Private repos included when the token has the
reposcope
- Vite + Svelte 5 (runes mode)
- GitHub REST API for profile, repos, and events
- GitHub GraphQL API for contribution calendar, streaks, and PR counts
- html2canvas for PNG export
- No backend, no database, no account, everything runs privately in your browser
git clone https://github.com/your-username/github-wrapped
cd github-wrapped
pnpm install
cp .env.example .env
Edit .env:
VITE_GITHUB_TOKEN=ghp_xxxxxxxxxxxxxxxxxxxx
VITE_GITHUB_USERNAME=your_username_here
Then:
pnpm devGo to github.com/settings/tokens and generate a classic token with these scopes:
| Scope | Why |
|---|---|
repo |
Read private repos, languages, and contribution data |
read:user |
Read your profile info |
read:org |
Include org contributions (optional) |
Without repo, only public repo data is shown.
All data is fetched at runtime from the GitHub API and held in memory, nothing is stored, logged, or sent anywhere else. The token lives only in your .env file and is never exposed beyond the local dev server.
The Events API (/users/{username}/events) only covers roughly the last 90 days, so the peak-hour chart reflects recent activity rather than the full year.