##Module 6 Challenge
#WeatherPy The first requirement is to create a series of scatter plots to showcase the following relationships:
Temperature (F) vs. Latitude

Humidity (%) vs. Latitude

Cloudiness (%) vs. Latitude

Wind Speed (mph) vs. Latitude

The second requirement is to compute the linear regression for each relationship. This time, separate the plots into Northern Hemisphere (greater than or equal to 0 degrees latitude) and Southern Hemisphere (less than 0 degrees latitude):
Northern Hemisphere - Temperature (F) vs. Latitude

Southern Hemisphere - Temperature (F) vs. Latitude

Northern Hemisphere - Humidity (%) vs. Latitude

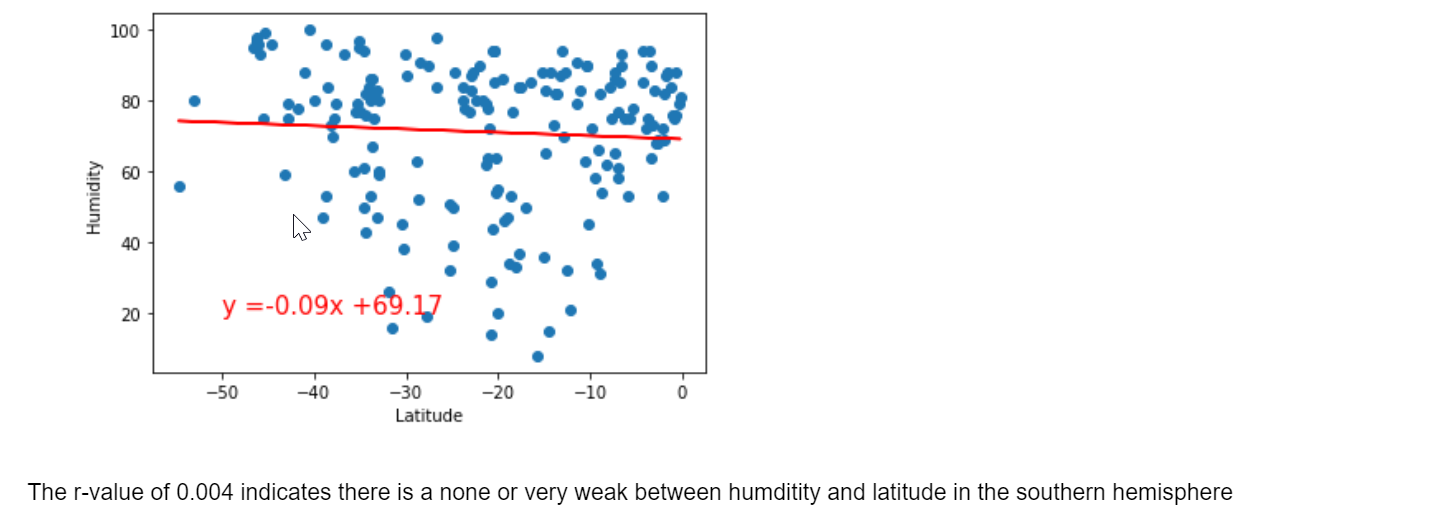
Southern Hemisphere - Humidity (%) vs. Latitude
Northern Hemisphere - Cloudiness (%) vs. Latitude

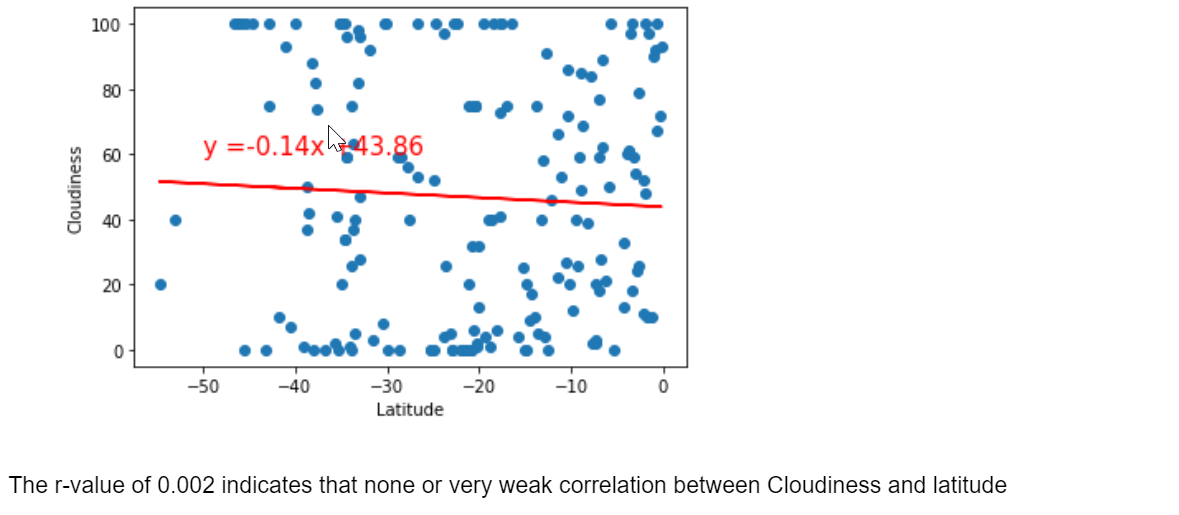
Southern Hemisphere - Cloudiness (%) vs. Latitude
Northern Hemisphere - Wind Speed (mph) vs. Latitude

Southern Hemisphere - Wind Speed (mph) vs. Latitude

#VacacationPy
Create a heat map that displays the humidity for every city from Part 1, that have the following criteria:
A max tempe
Zero cloudiness.
Drop any rows that don't satisfy all three conditions. You want to be sure the weather is ideal.

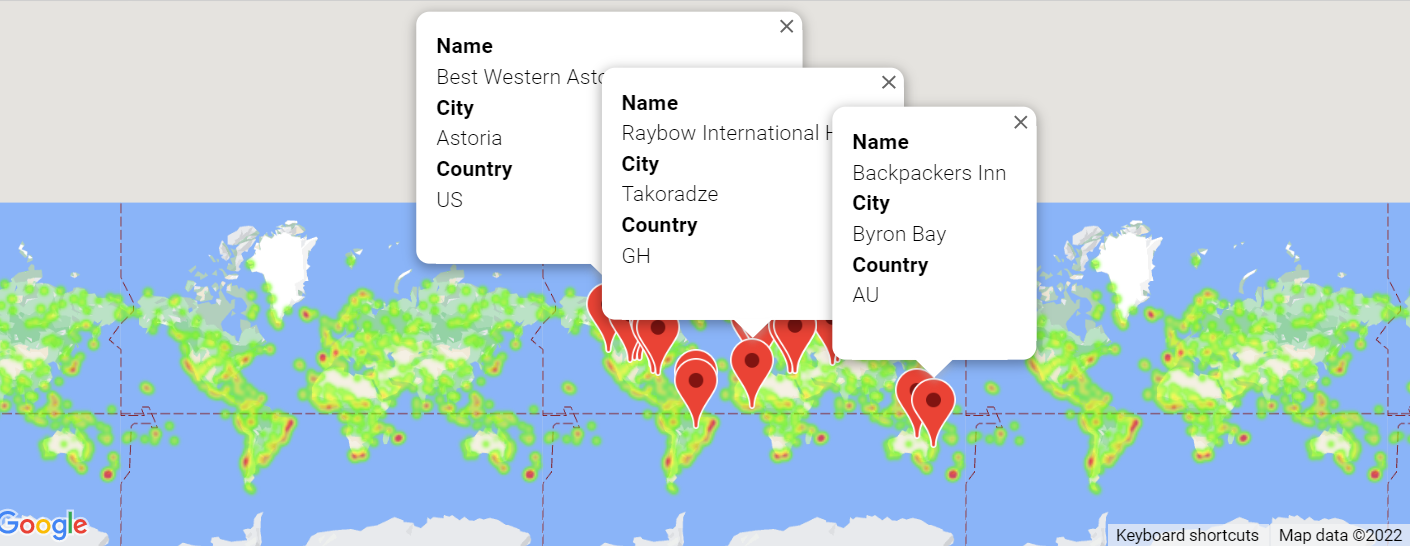
###Use Google Places API to find the first hotel for each city located within 5,000 meters of your coordinates. Plot the hotels on top of the humidity heatmap, with each pin containing the Hotel Name, City, and Country, as in the following image: