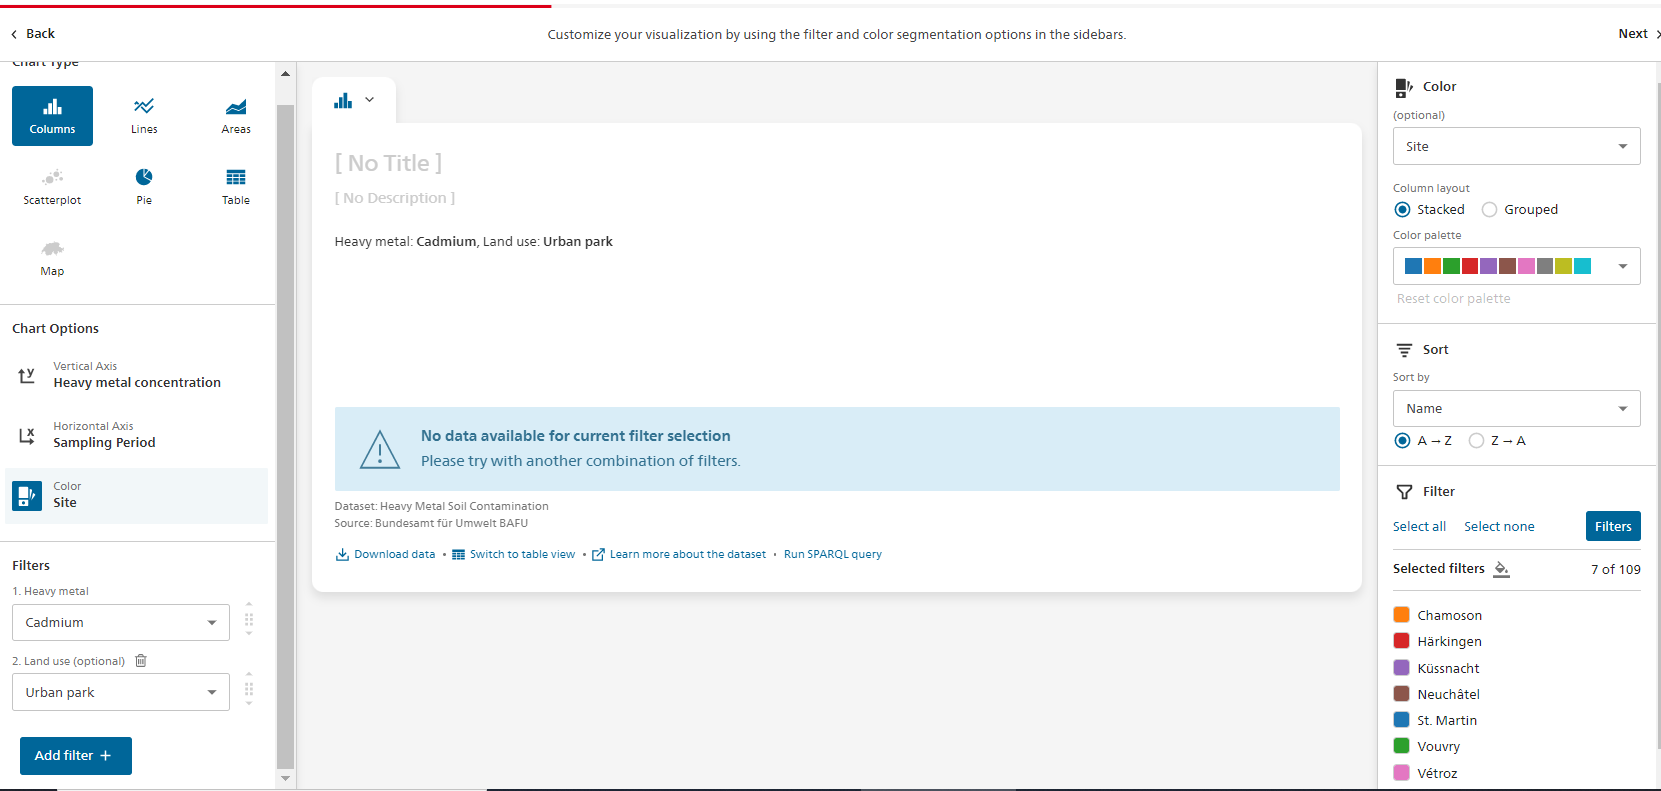
As only 7 categories are selected by default on the color axis, the risk is high of not having any data for the current filter selection. This is a pity, especially now that we have solved this problem with the cascading filters.
To Reproduce
- int.visualize.admin.ch, source : PROD
- Search and open "Soil pollution"
- Choose "sampling period" on the x-axis
- Choose "Site" on the color axis
- Try several Filter combination for dimension "Heavy metal" and "Land use"
Expected behavior
A clear and concise description of what you expected to happen.
Screenshots
If applicable, add screenshots to help explain your problem.
Environment (please complete the following information):
- Visualize environment and version: INT, source PROD, v3.7.11 ([ba2e668]
- Browser : edge
As only 7 categories are selected by default on the color axis, the risk is high of not having any data for the current filter selection. This is a pity, especially now that we have solved this problem with the cascading filters.
To Reproduce
Expected behavior
A clear and concise description of what you expected to happen.
Screenshots
If applicable, add screenshots to help explain your problem.
Environment (please complete the following information):