- Using
Outcomecolumn to find out Success, Failed, Live and Canceled in the campaigns. I’m using soft & Filter function and use different colour fill in the cell. - Create
Percent Fundedto made relative to its initial funding goal. The formula is using pledged column / goal column. - Create
Average Donationto find how much each project backer paid on average. The formula is using pledged column / backers_count column. Separate category & sub-categoryto 2 different columns. It can help to find detail information about which event is good for campaign to get funding.- Convert
Unixtimestamps inlaunched_at and deadline columnto Date Created Conversion and Date Ended Conversion column for the normal date. I’m using {insert function} “=(((L2/60)/60)/24)+DATE(1970,1,1)” to converted.
-
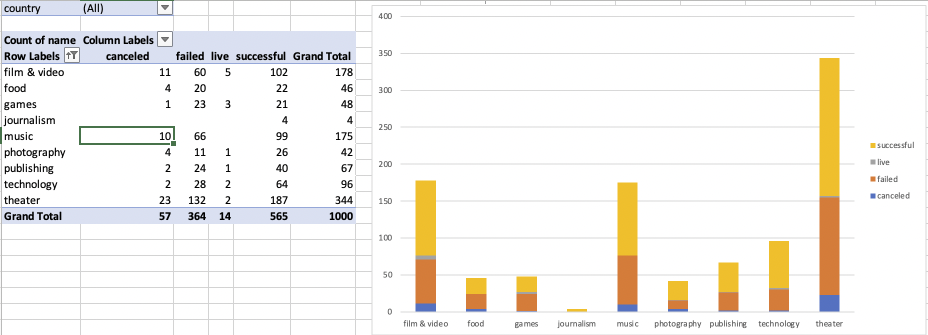
Using PivotTable field in name/outcome/country/Parent Category analyzes which Parent Category Success, Failed, Live and Canceled data. Using 2D Column chart to support my result.
-
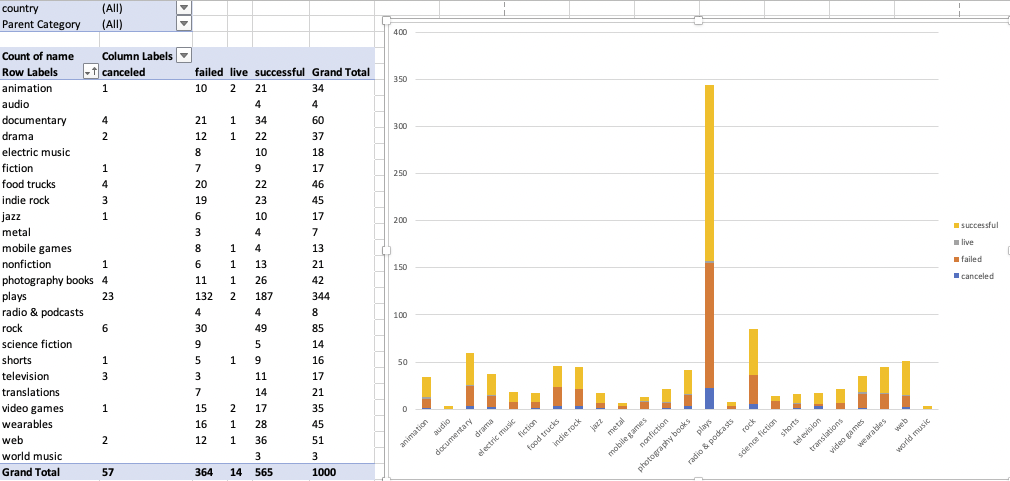
Using PivotTable field in name/outcome/country/Parent Category/sub-category analyzes which Sub-Category Success, Failed, Live and Canceled data. Using 2D Column chart to support my result.
-
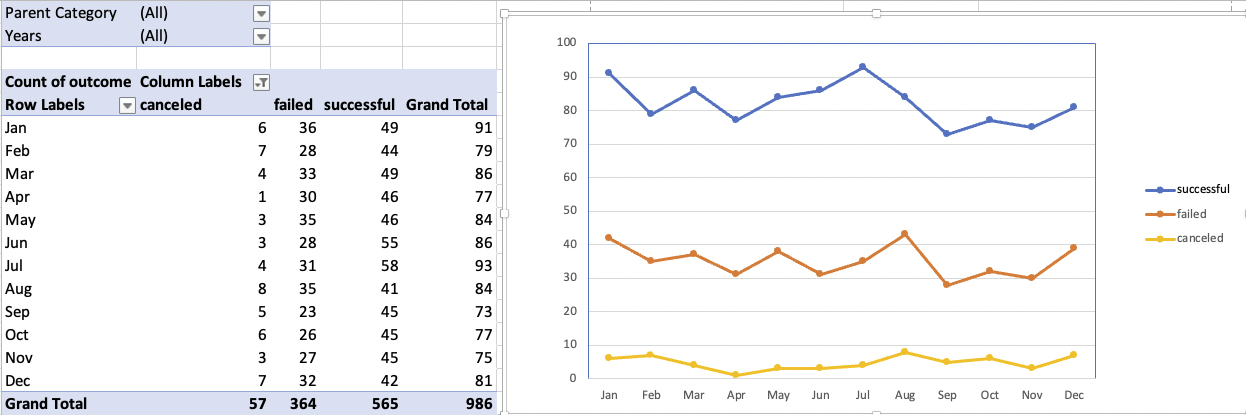
Using PivotTable field in Date Created Conversion/outcome/Years/Parent Category analyzes which Month is going Success, Failed, Live and Canceled data. Using stacked line chart to support my result.
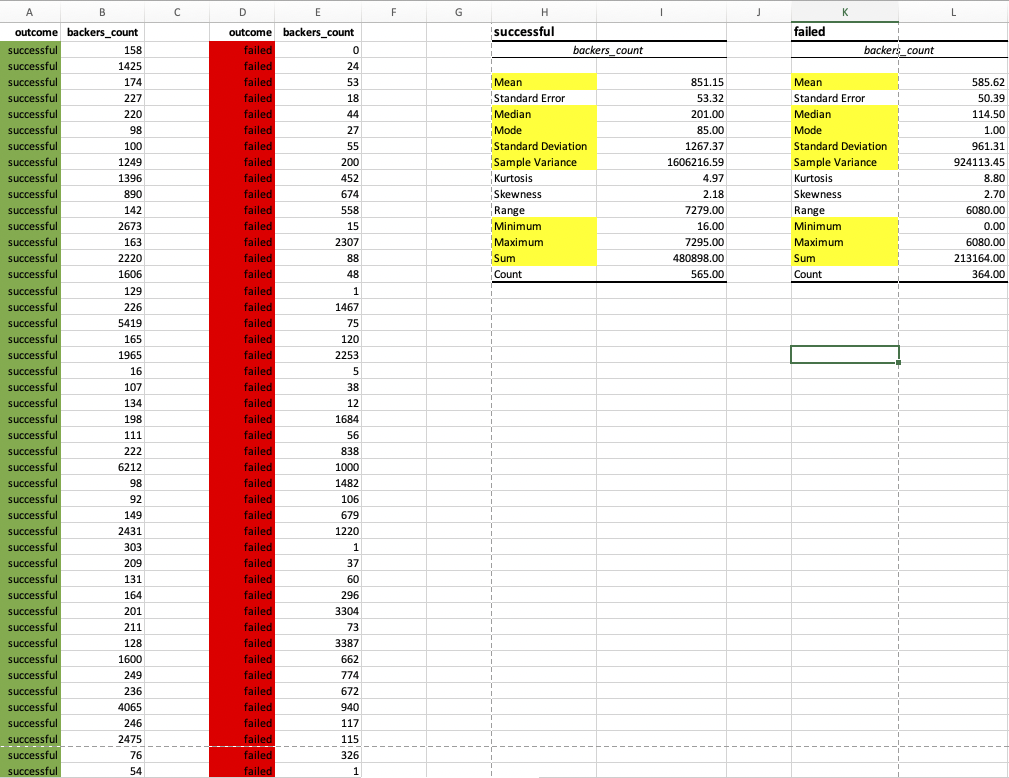
Use campaign backers evaluate the number of backers successful and unsuccessful in campaigns. I’m using data/DataAnalysis/Descriptive Statistics.