A graph-based analytics platform to track and measure meetup.com groups growth over time. Identify community trends and see what people are meeting about in the world.
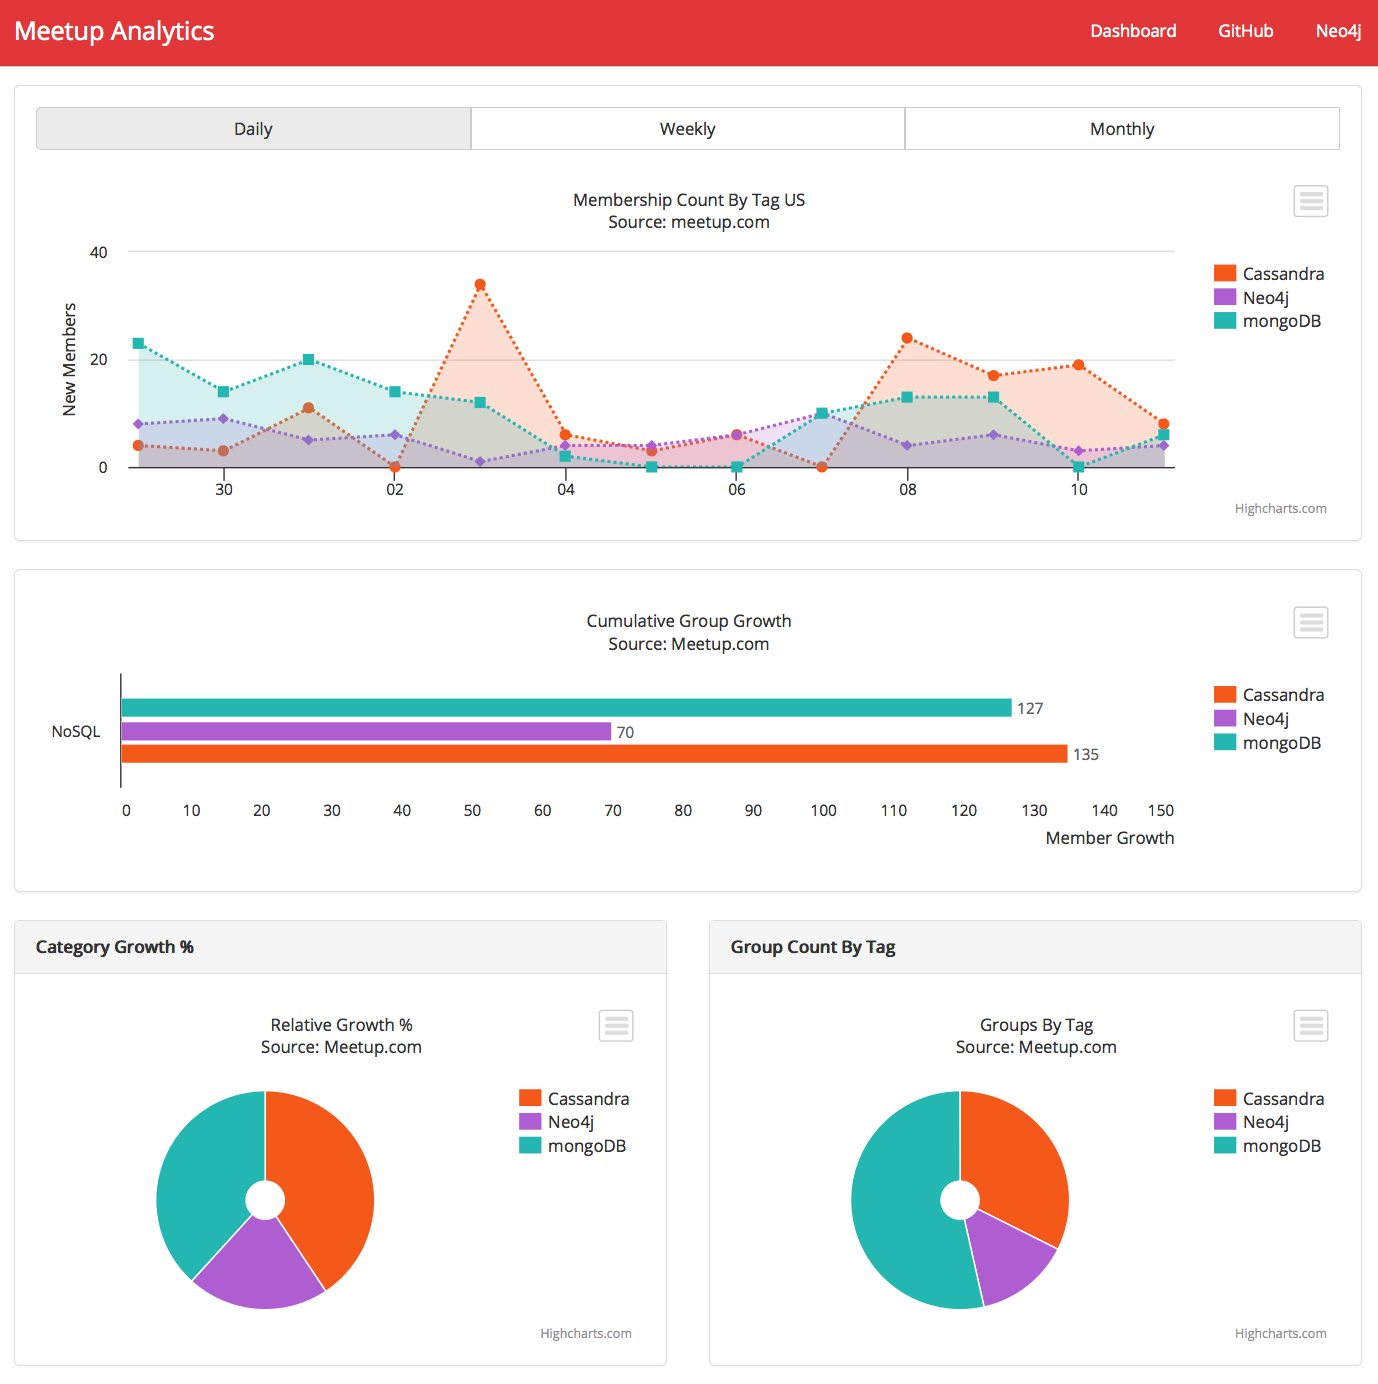
Check out a demo of the dashboard: Meetup Analytics NoSQL Dashboard
Read the full project documentation here: Graph-based Analytics Platform Docs
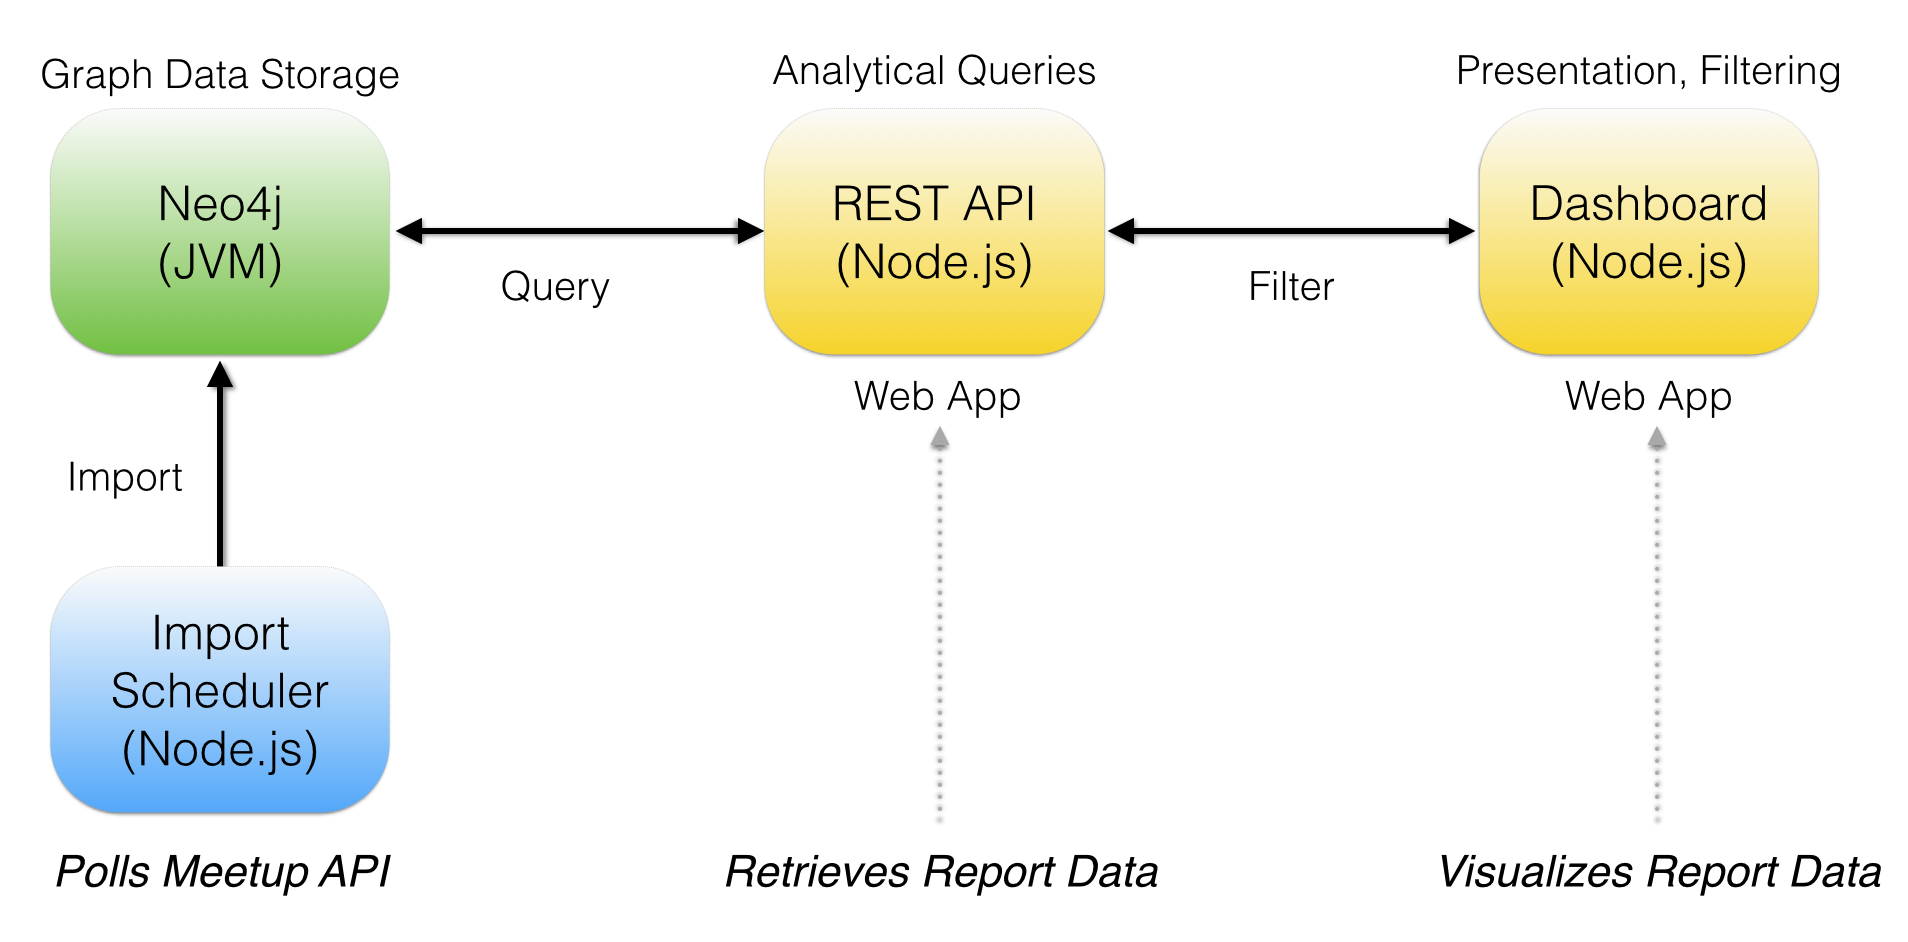
- Front-end web-based dashboard in Node.js and bootstrap
- REST API via Neo4j Swagger in Node.js
- Data import services in Node.js
- Data storage in Neo4j graph database
- An instance of Neo4j (
>=2.1) running locally - http://www.neo4j.org/download - A Meetup.com API Key for running data import services - http://www.meetup.com/meetup_api/
- Installed
node.jsandnpmon your machine
Follow the directions below for each component of the platform.
- Extract the Neo4j store files located in
neo4j/data.zipto your Neo4j data directoryneo4j/data - Start the Neo4j server at
http://localhost:7474
- From the terminal, go to the
apidirectory of the project and runnpm install, afternode_modulesare installed, runnode app. The analytics REST API will be started athttp://localhost:3000
- From the terminal, go to the
dashboarddirectory of the project and runnpm install, afternode_modulesare installed, runnode app. The analytics dashboard will be started athttp://localhost:5000
- From the terminal, go to the
schedulerdirectory of the project and runnpm install, afternode_modulesare installed, runnode app. The Meetup group import scheduler will be started athttp://localhost:3001. It will run once a day 5 minutes after midnight PST.
You can find the project specifications as a GraphGist project app at Neo4j for Graph Analytics: Meetup.com Example
Feedback is welcome. Reach out to me on Twitter @kennybastani if you are interested in contributing to this project.