Stats Revamp: match data across platforms #17745
Conversation
Take data for last 14 days excluding today
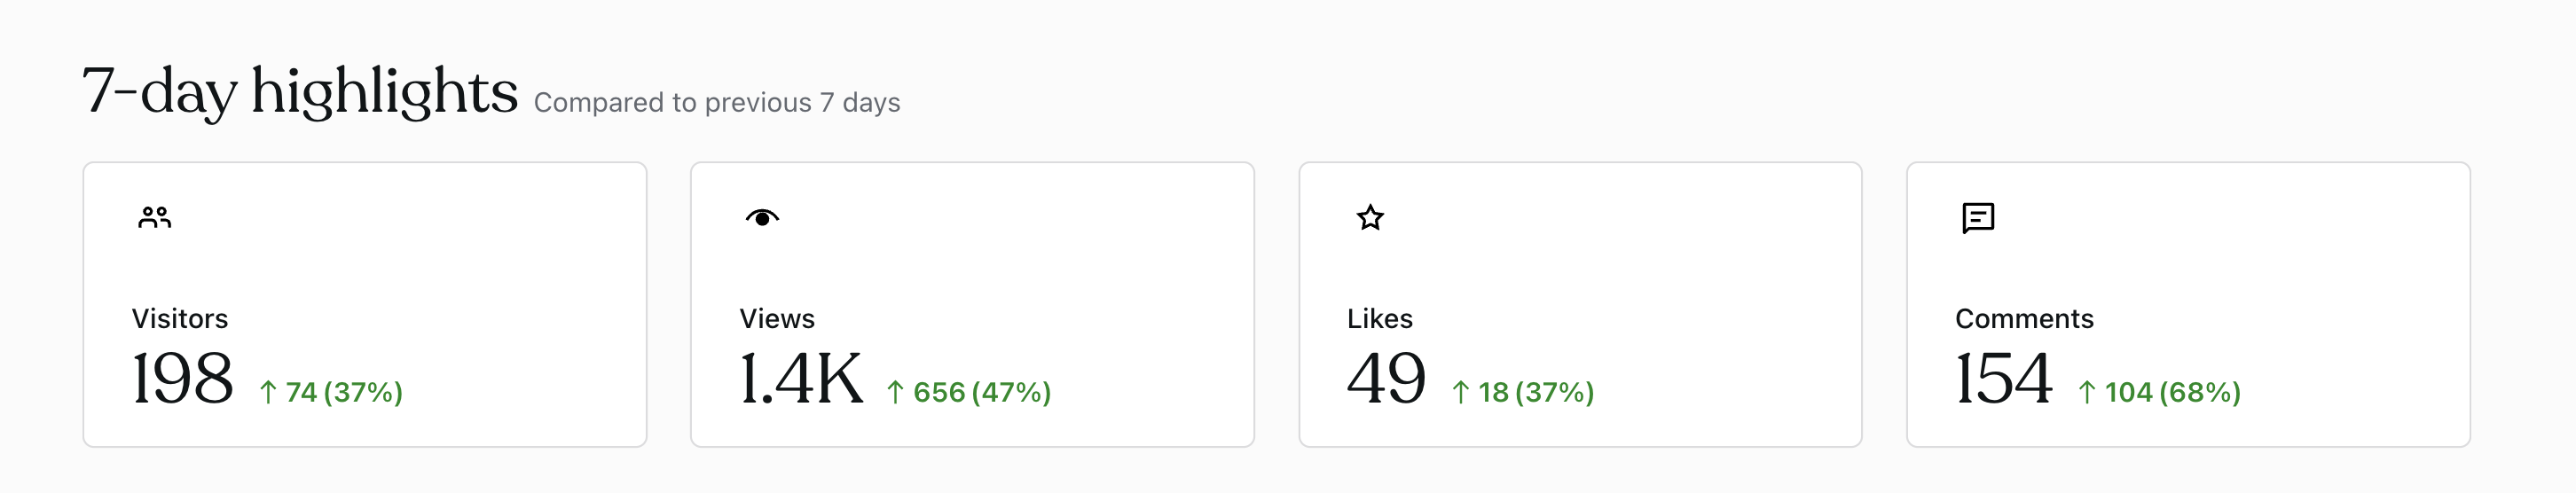
Updated labels to read 7-days instead of Week on Views and Visitors card
Updated labels to 7-days from Week on Total Likes and Total Comments cards
|
|||||||||||

 |
💡 Scan this QR code with your Android phone to download and install the APK directly on it. | |
| App | Jetpack | |
| Build Flavor | Jalapeno | |
| Build Type | Debug | |
| Commit | 288d882 | |
|
|||||||||||

 |
💡 Scan this QR code with your Android phone to download and install the APK directly on it. | |
| App | WordPress | |
| Build Flavor | Jalapeno | |
| Build Type | Debug | |
| Commit | 288d882 | |
|
Hey, thanks for the changes. I'll soon make an equivalent on iOS. However, I am concerned about the graph.
I do think that's misleading for users. If we're labeling the data as "Last 7-days" we should be explicit in the representation of which days we're talking about.
There's no graph for the 7-day highlights elements, which part does it match? I may be missing some context. Thanks!
|
|
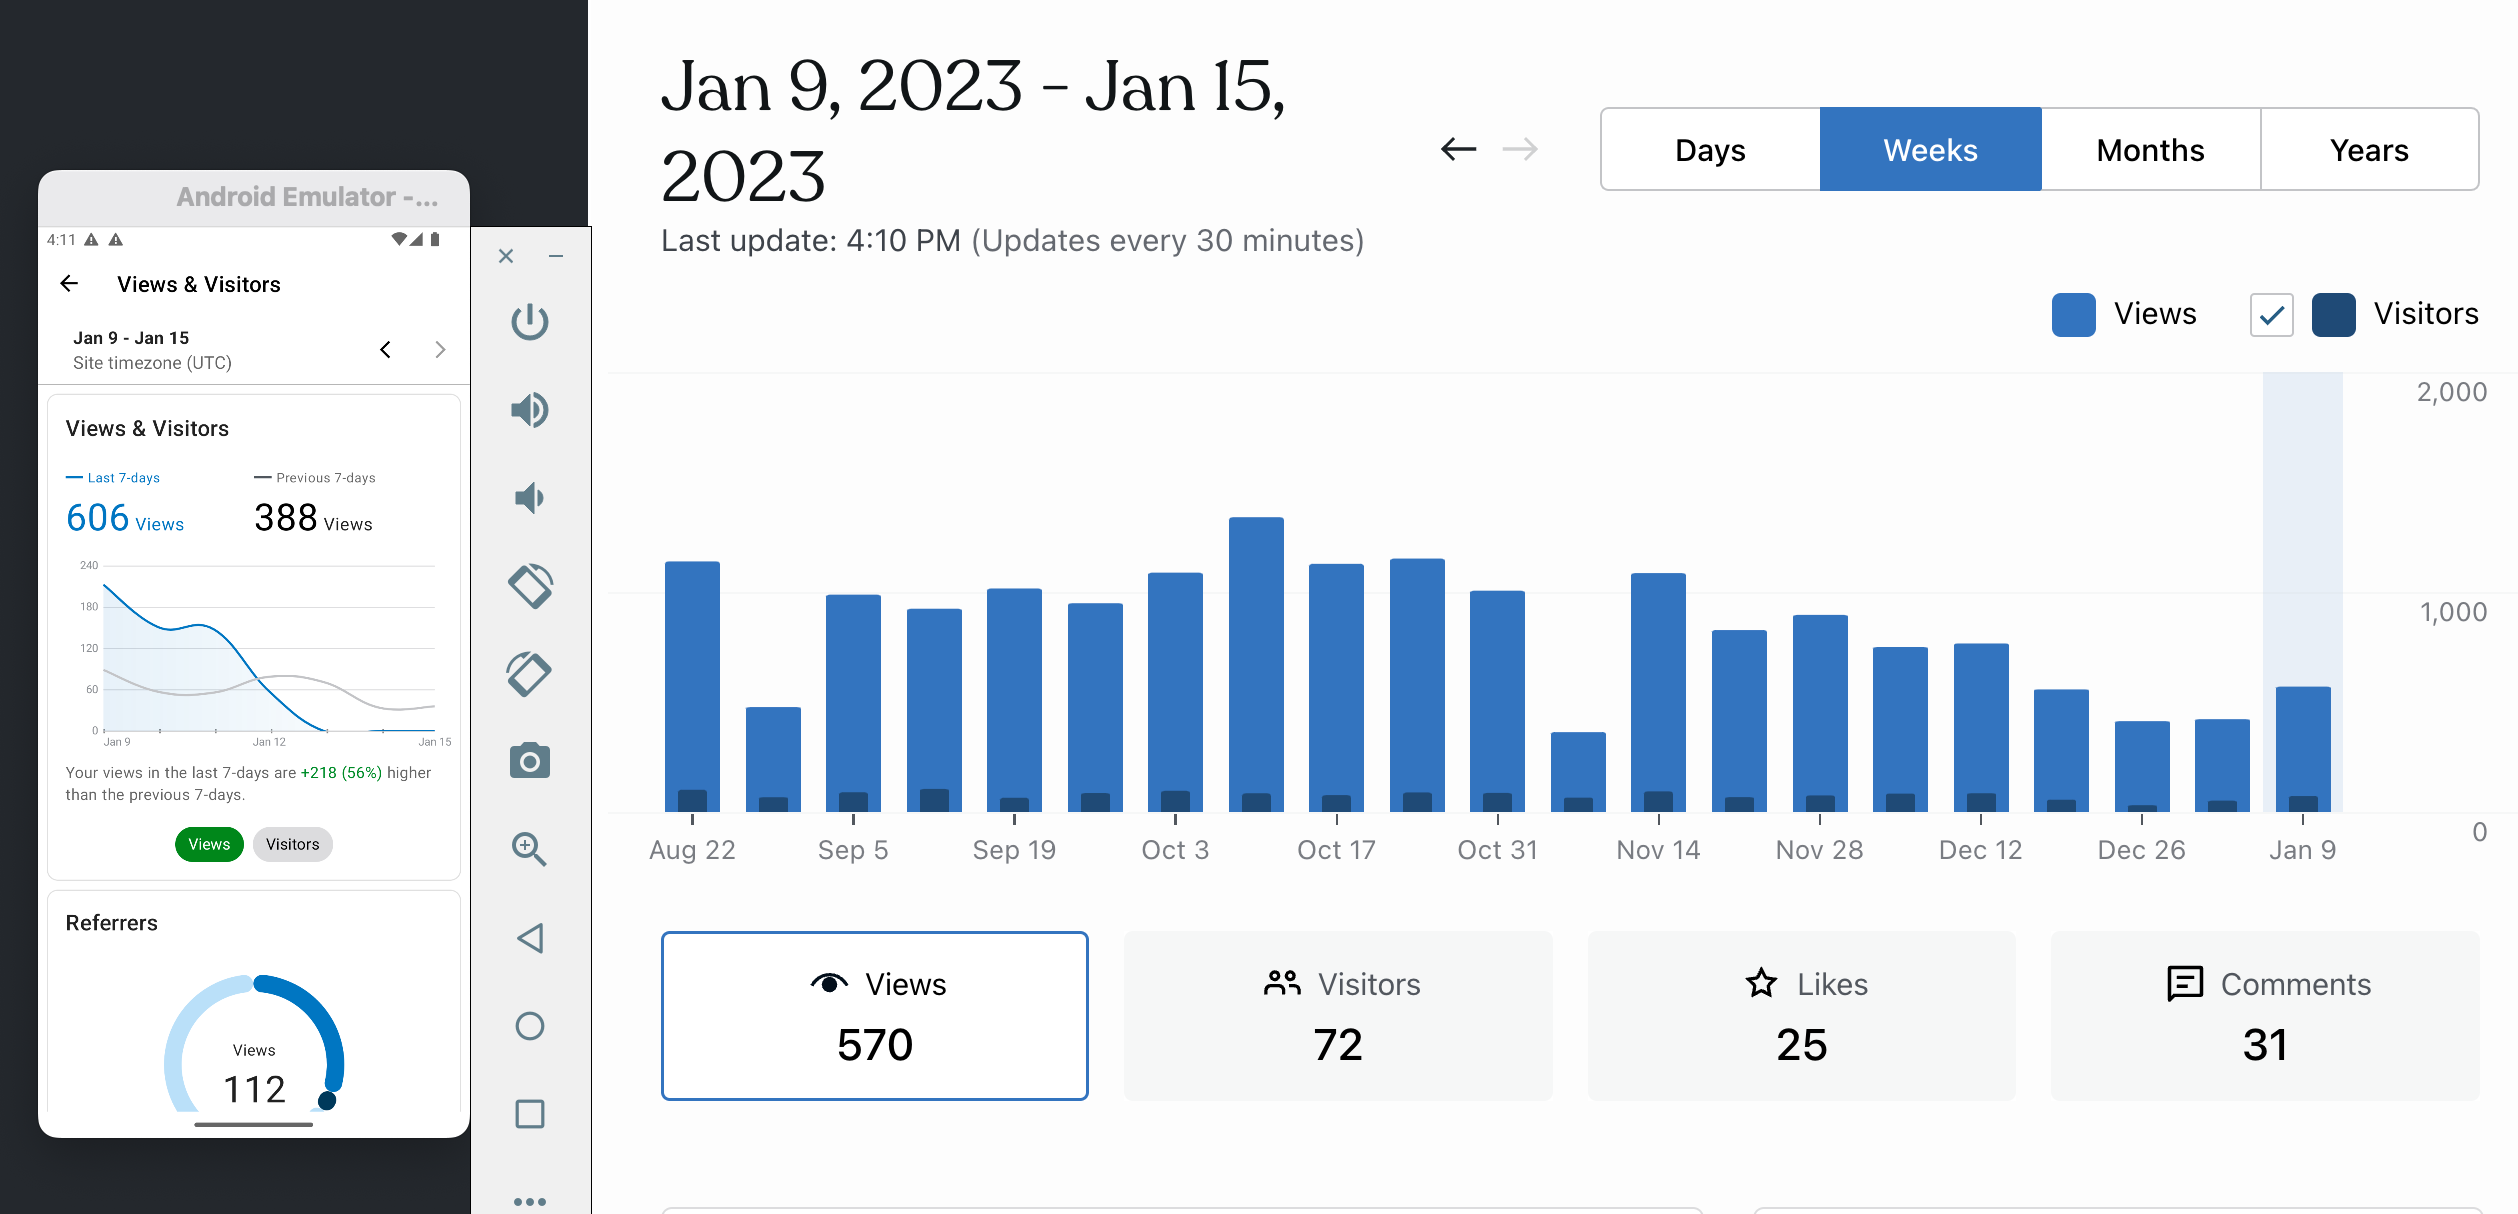
I found one issue: By going into "Week >" I can see that the numbers don't match the web. Android also adds the view count for one more day (January 8th), although the graph and date are from January 9th.
|
Will we fix it too? |
 irfano
left a comment
irfano
left a comment
There was a problem hiding this comment.
- We used to fetch 15 days and we don't use 15 days anymore, right? But usecases are still sending 15 days data to the mappers. If they send 14 days, then we wouldn't need
dropLast(1). - I think previous strings were more proper on the detail screens. Blue line shows "This Week (4 days)", not "Last 7-days". Wdyt?
.../org/wordpress/android/ui/stats/refresh/lists/sections/insights/usecases/TotalStatsMapper.kt
Show resolved
Hide resolved
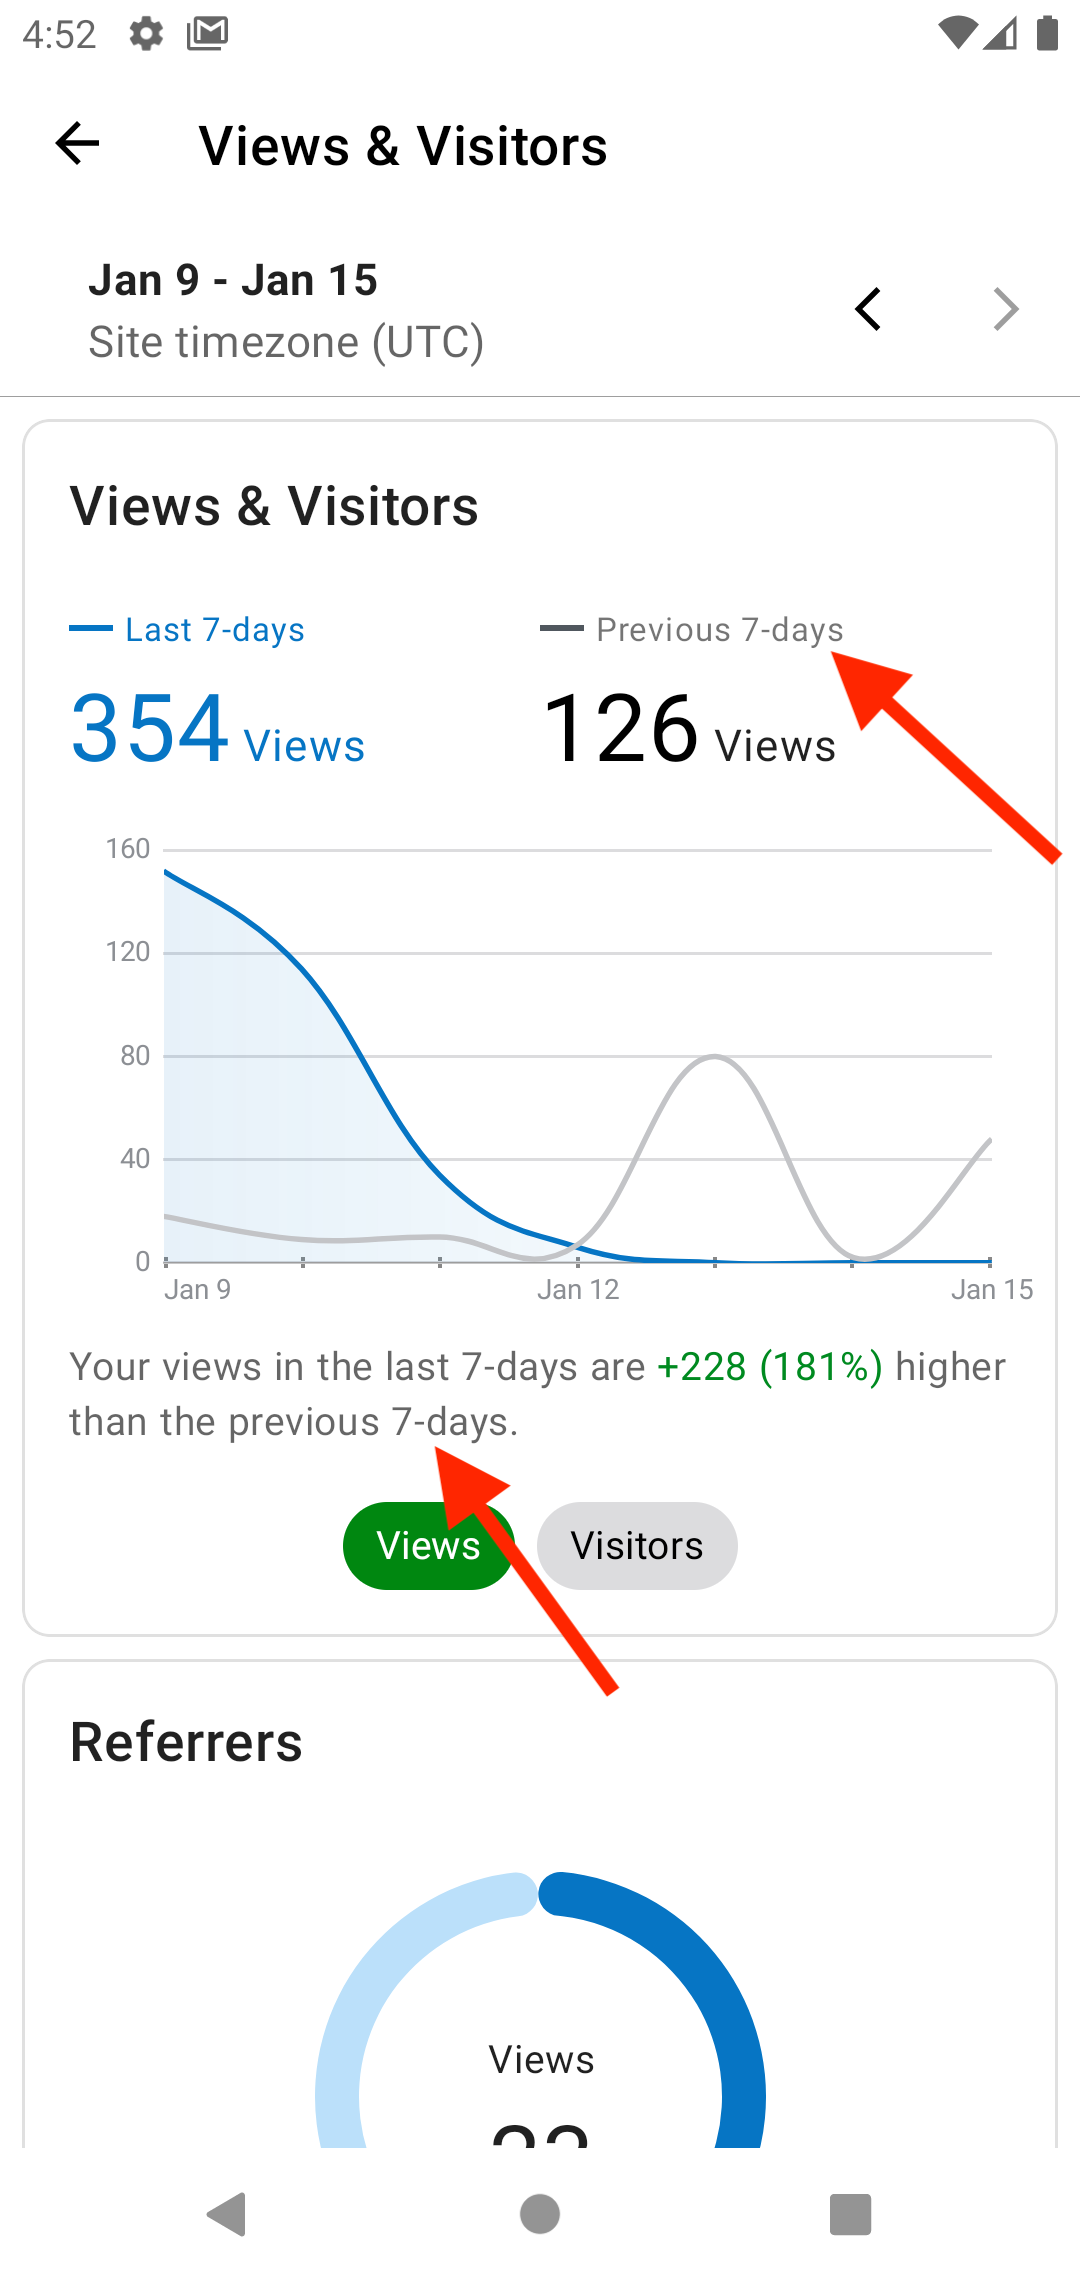
Referring to the bar chart below the highlights section which shows a bar for today |
Strange but true. The detail view is returning a different range of data. On insights it is returning last 15 days counting from today backwards (30-Dec to 13-Jan) while the Week detail view is returning from 1-Jan to 15-Jan. Good catch. Fixed now. Thanks |
When you fetch 14 days it returns 14 days including today, whereas we need 14 days excluding today, so need to fetch 15 and drop last
Then we need to change Previous 7 days to Previous Week too as before. |
irfano
left a comment
There was a problem hiding this comment.
When you fetch 14 days it returns 14 days including today, whereas we need 14 days excluding today, so need to fetch 15 and drop last
Yes, I missed that. We still need 15 days on the detail screen. 👍🏻
The wrong value on the detail screen is fixed. LGTM!
|
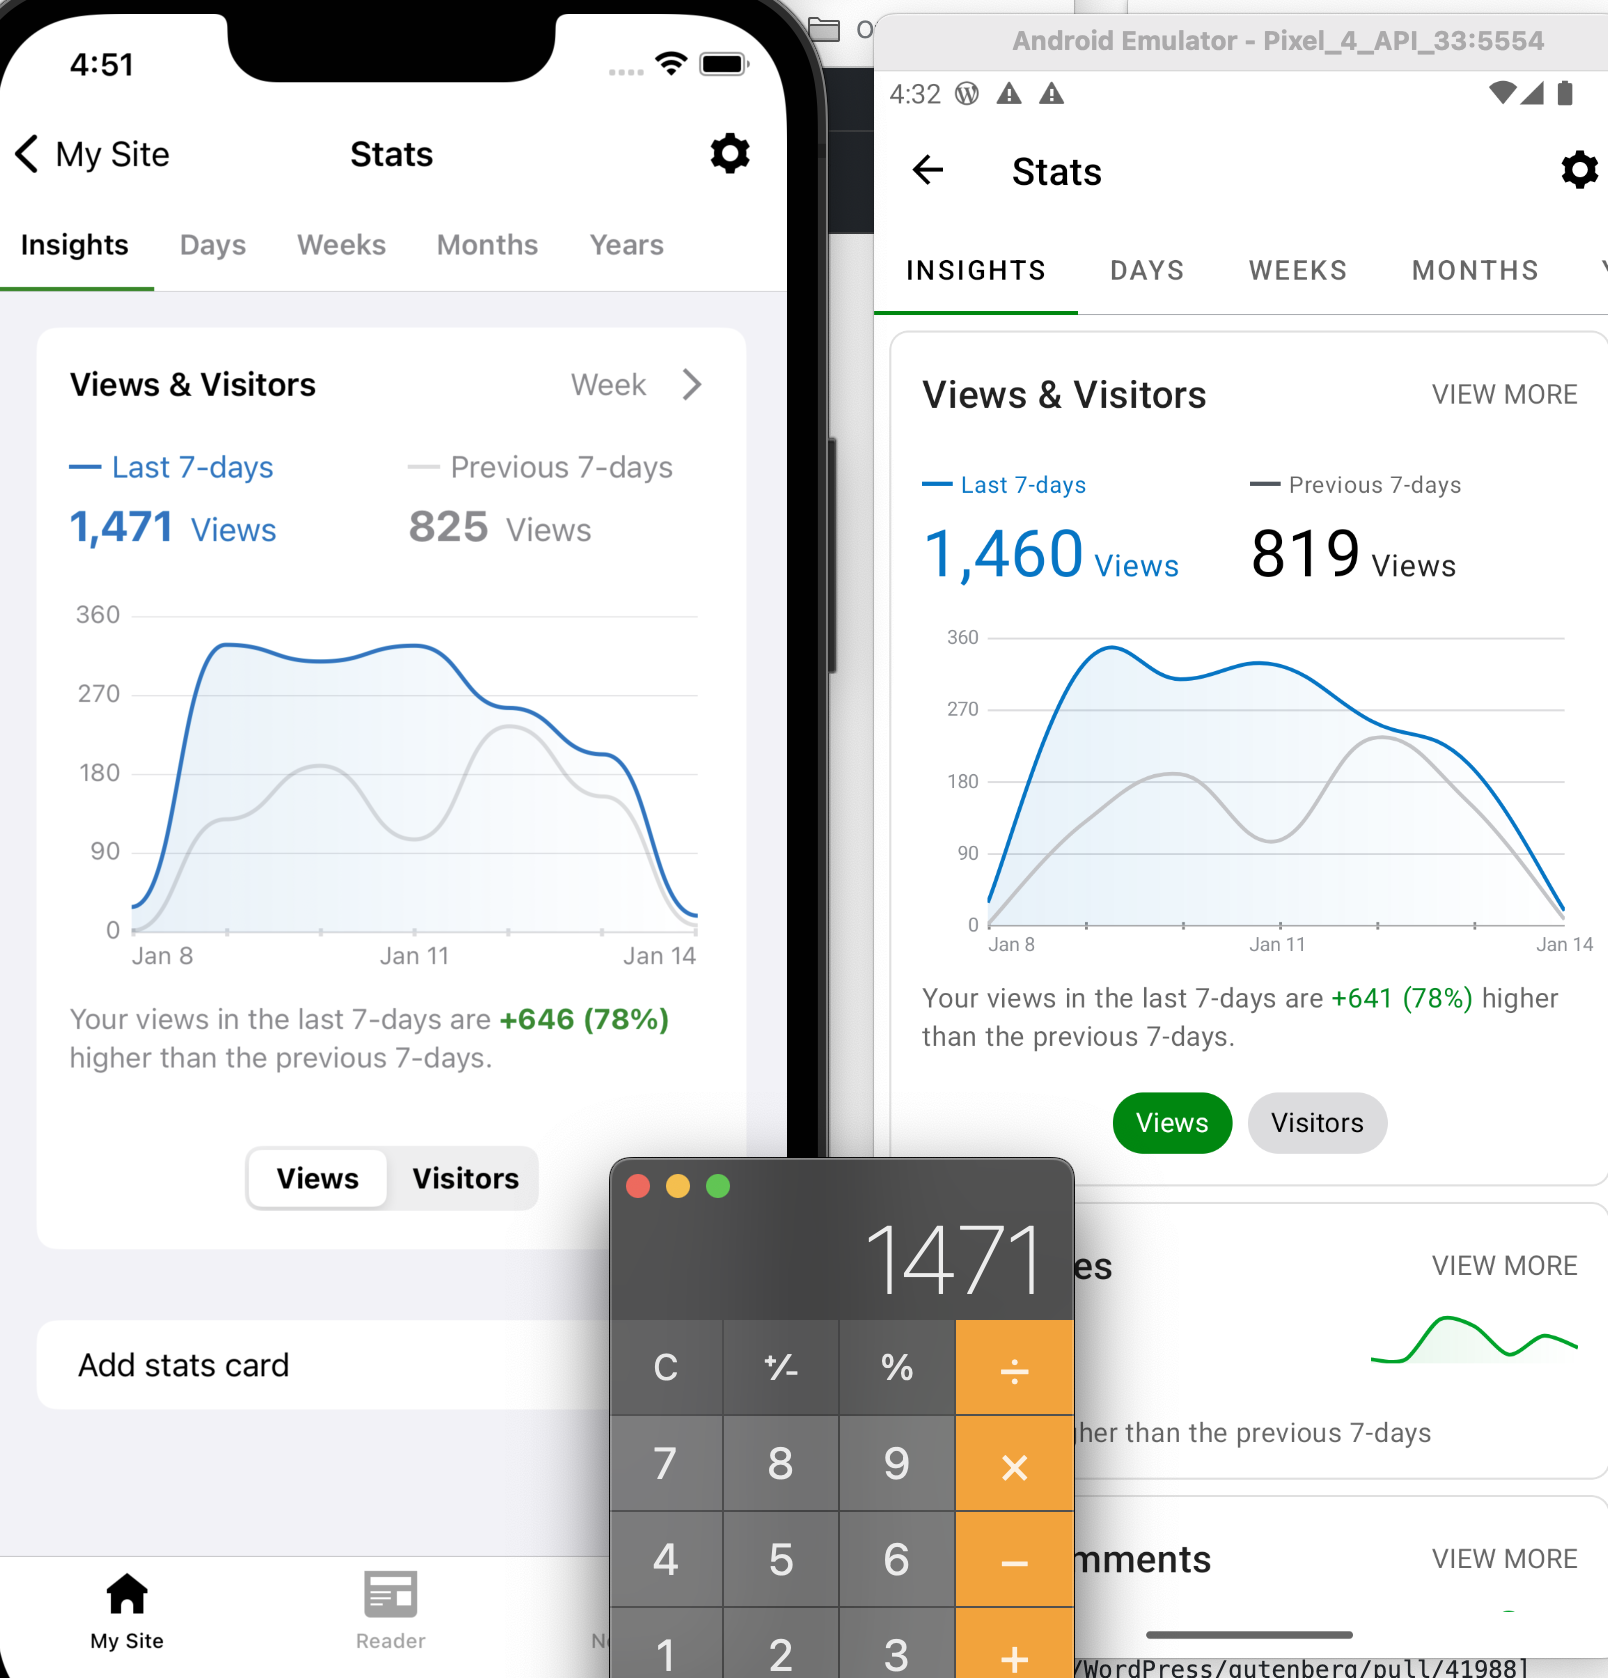
Thank you for the changes in the graph! 🔴 I compared the numbers on iOS, Android, and the Web. Android is reporting a different number. The calculator represents Web's daily numbers added one by one. After further investigation, I saw that Android calculates the numbers for one day behind. Jan 7 - Jan 13, when it's supposed to calculate the total for days Jan 8 - Jan 14 (as the graph shows). CC @ravishanker, @irfano
|
If the 14th is today, then it needs to be excluded to match with Web right? Then it is correct. |
@ravishanker, thanks for the reply! It was Jan 15th, showing the graph until Jan 14th, and loading the data until Jan 13th. I will retest today as well to see what it shows.
Bar chart on the web is a separate element. For me, it's misleading showing calculations for a different data range than displayed on the graph. I'm delaying to merge iOS PR so we could have exactly same behavior and synchronize our solutions. |
I can no longer reproduce this issue. I turned back the clock to yesterday but now the graph was until Jan 15th and calculations until Jan 14th. I've no idea why I had that behavior yesterday 🤷♂️. The only question for me remains the fact that we continue showing the graph up to today. I think we have a disagreement here so it would be good to hear other opinions. |
What was the time when you tested yesterday? Could it be related to timezone difference?
IMO, it's better to remove today from the line chart of "Views & Visitors". |
It's visible on the screenshot, so I tried to come back at the exact same time. Maybe something was wrong with the emulator. |
This PR fixes data consistencies across Web, Android and iOS on Jetpack app
Fixes #17731
To test:
Regression Notes
Potential unintended areas of impact
What I did to test those areas of impact (or what existing automated tests I relied on)
What automated tests I added (or what prevented me from doing so)
PR submission checklist:
RELEASE-NOTES.txtif necessary.