Repository navigation
Gallery
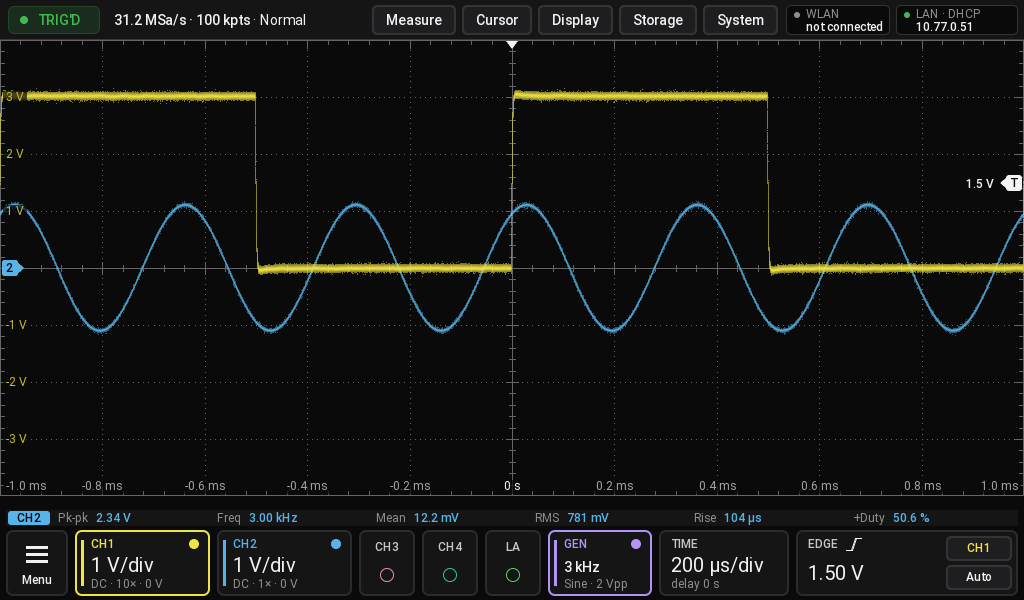
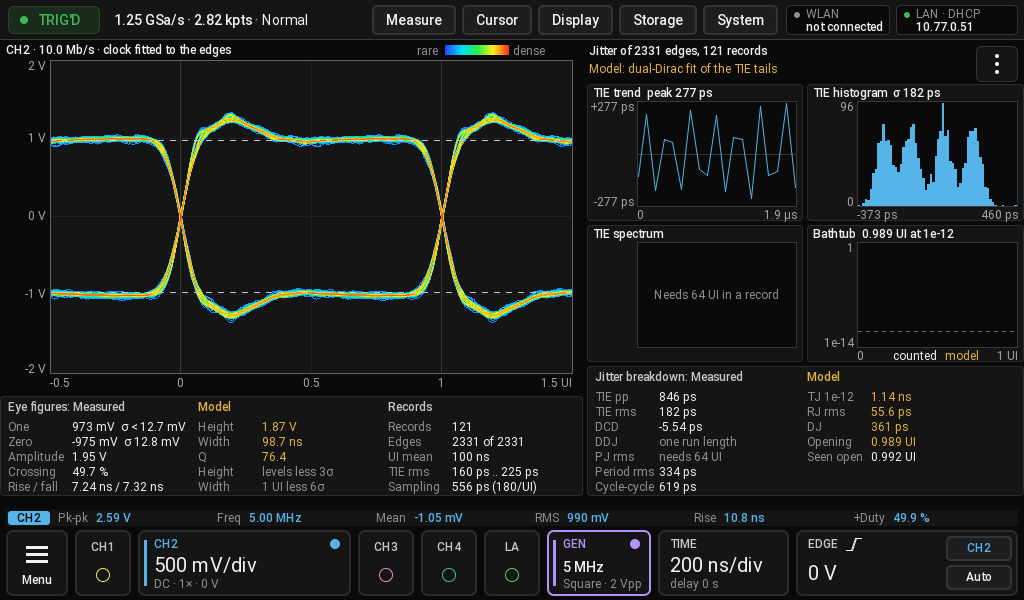
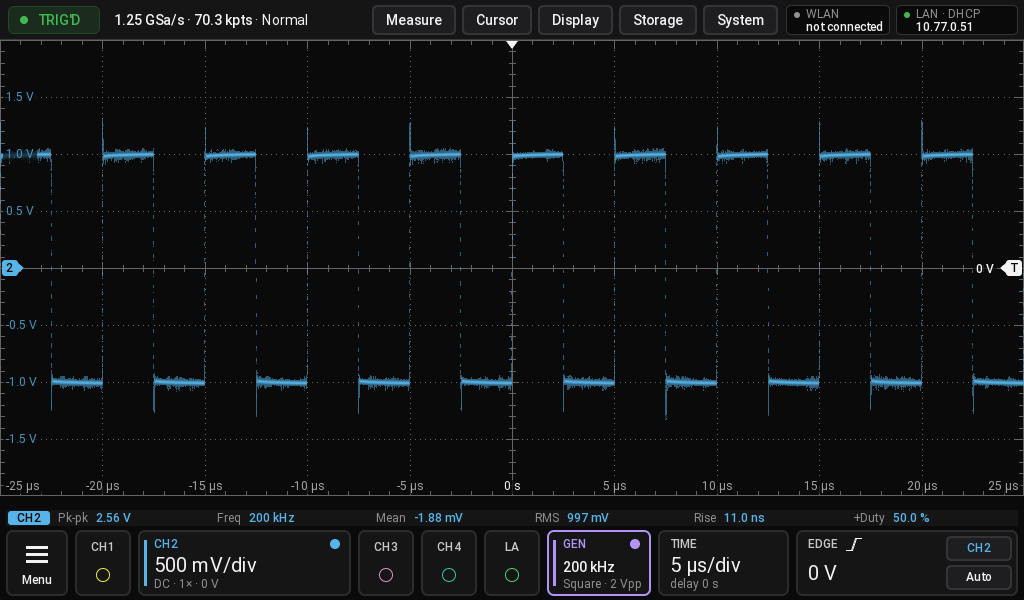
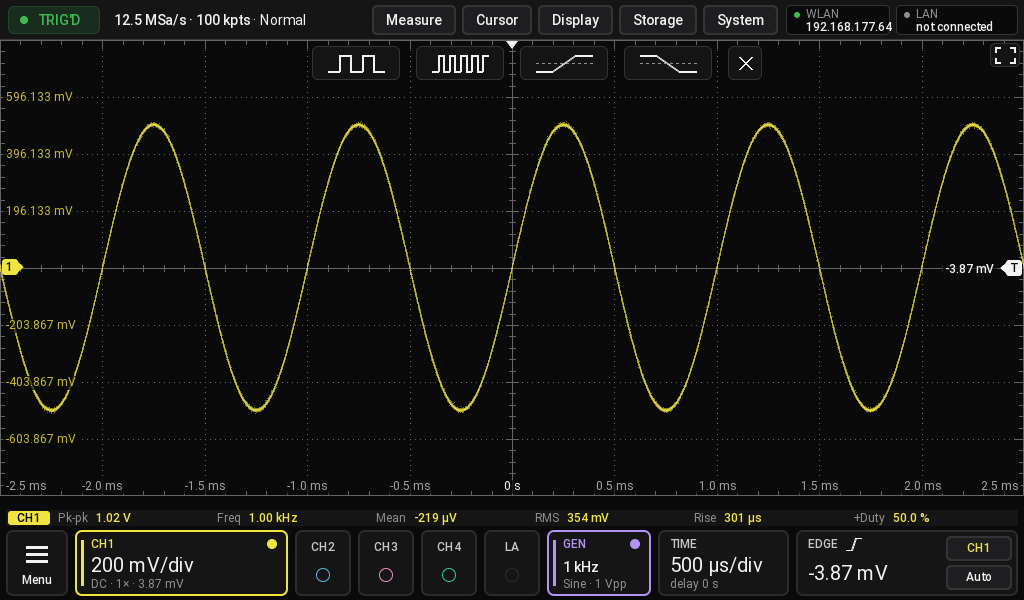
All pictures are screenshots of a DHO924S running OOS.
 |
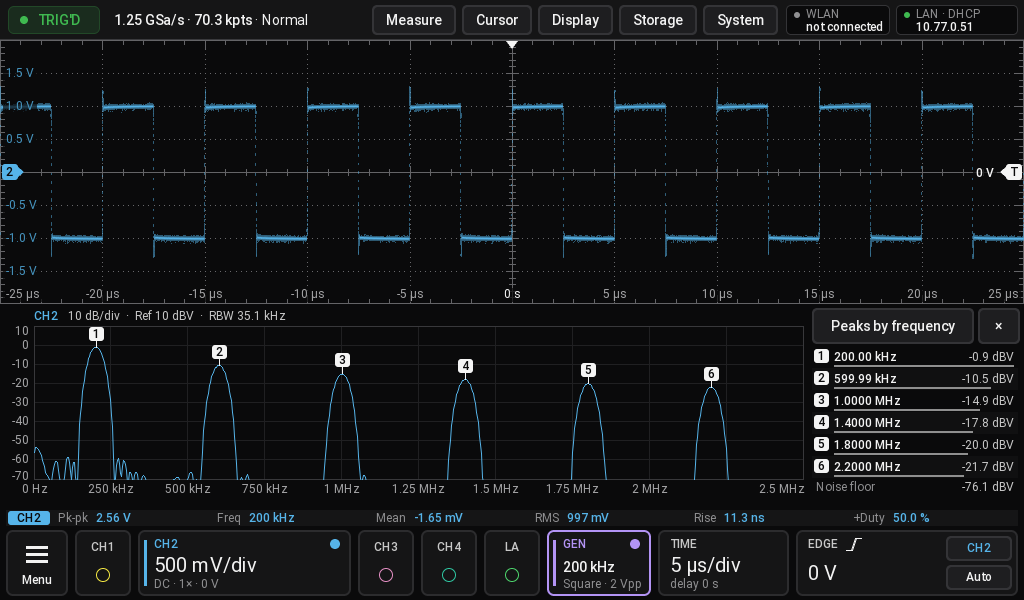 |
| Two channels: a 10:1 probe on the calibration signal and the built-in generator | A square wave with its spectrum and peak list under it |
 |
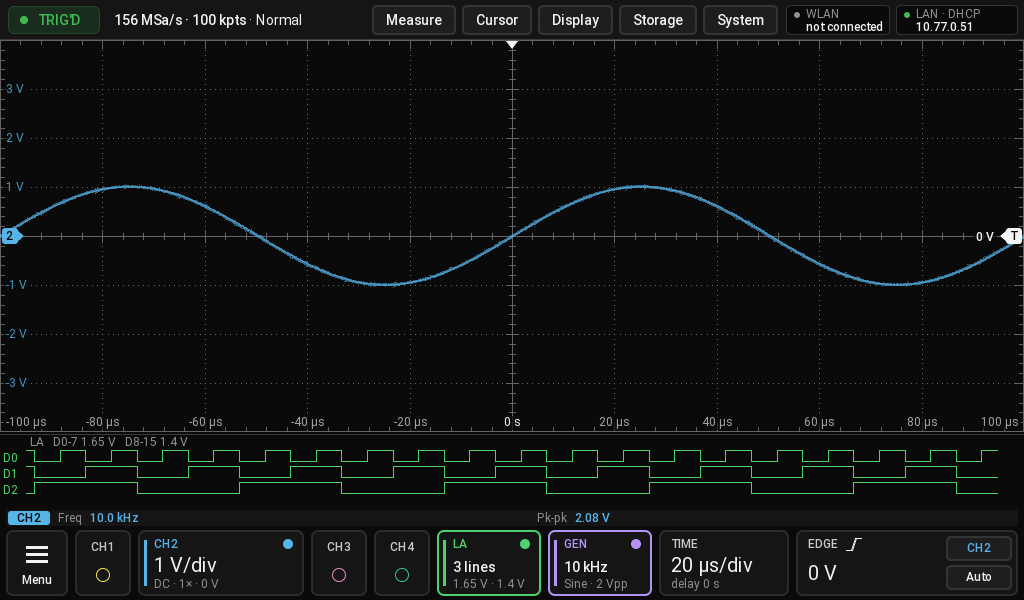 |
| Eye diagram with TIE charts, bathtub and jitter breakdown | Analog channel with three logic analyser lines |
|  |
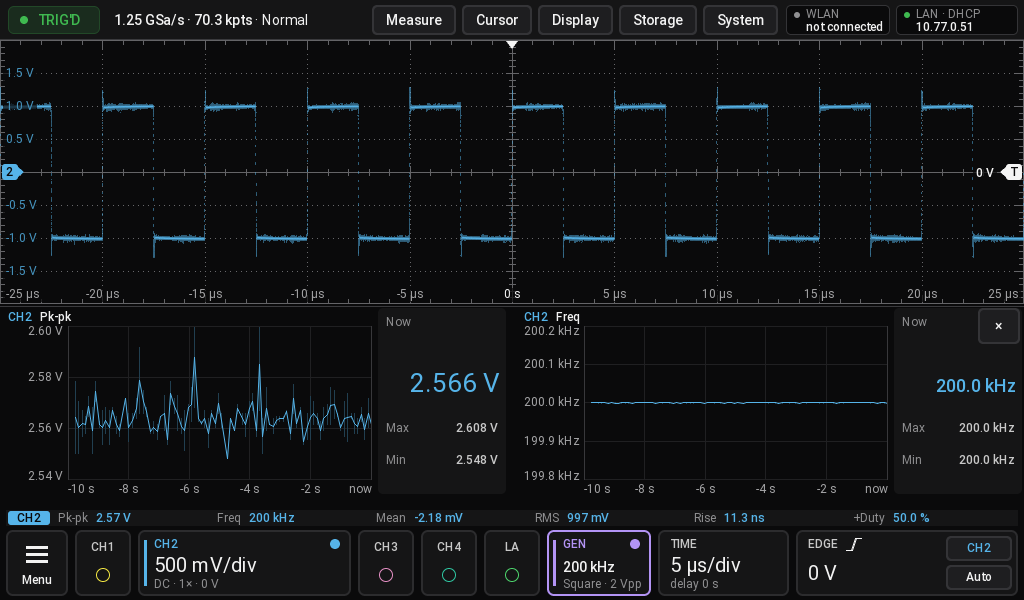 |
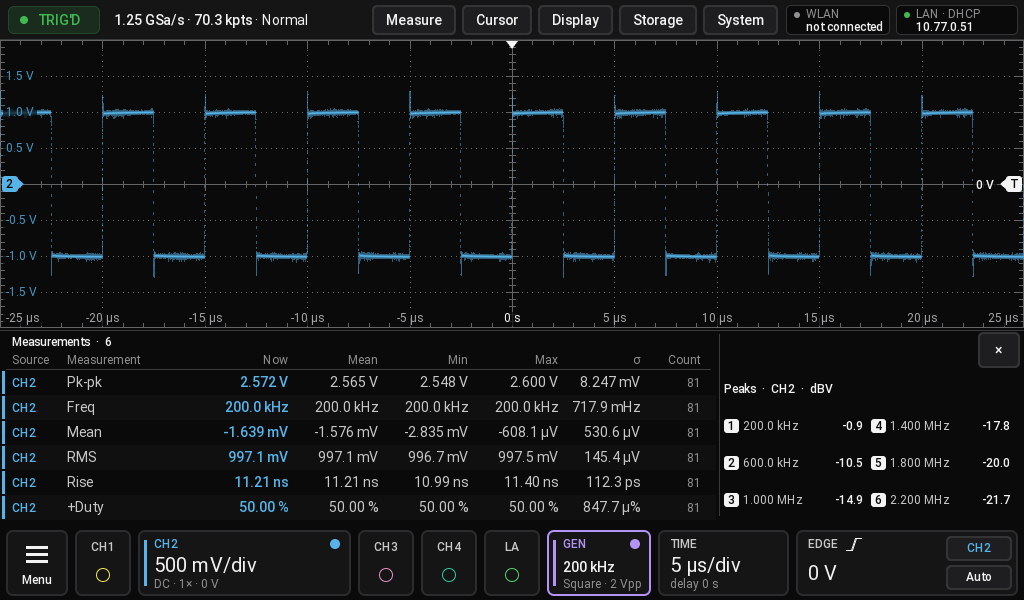
| Results pane: every measurement with statistics, peaks beside it | Trend pane: two measurements over time |
|
 |
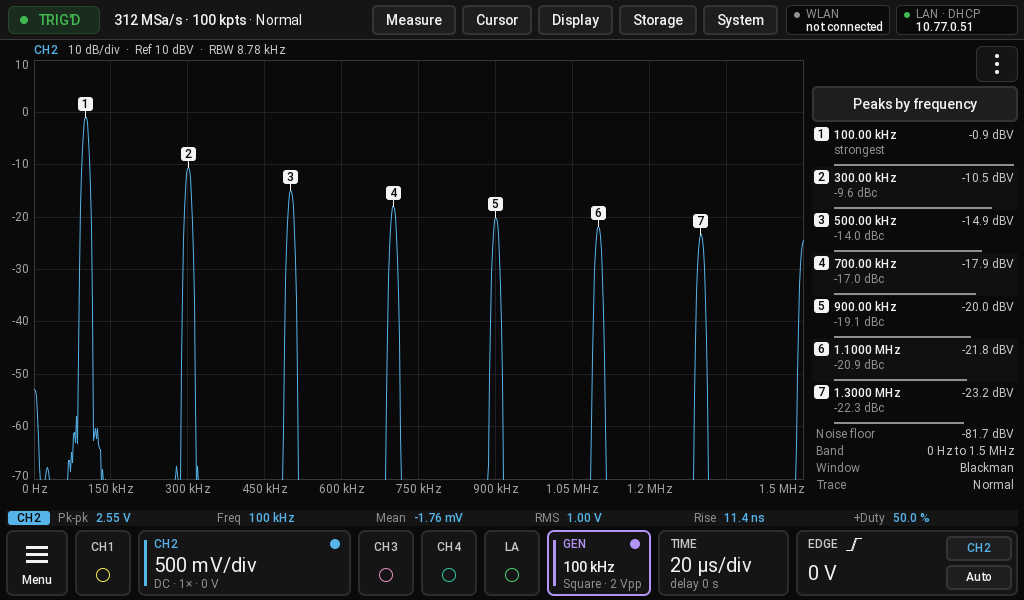 |
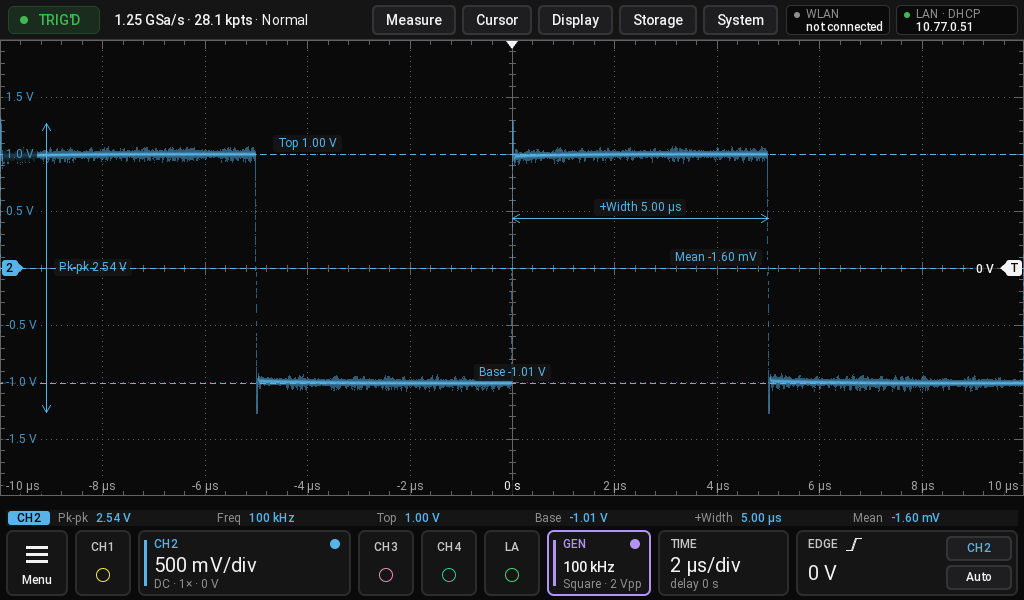
| Measurements labelled on the trace | Spectrum view with its peak list |
|
 |
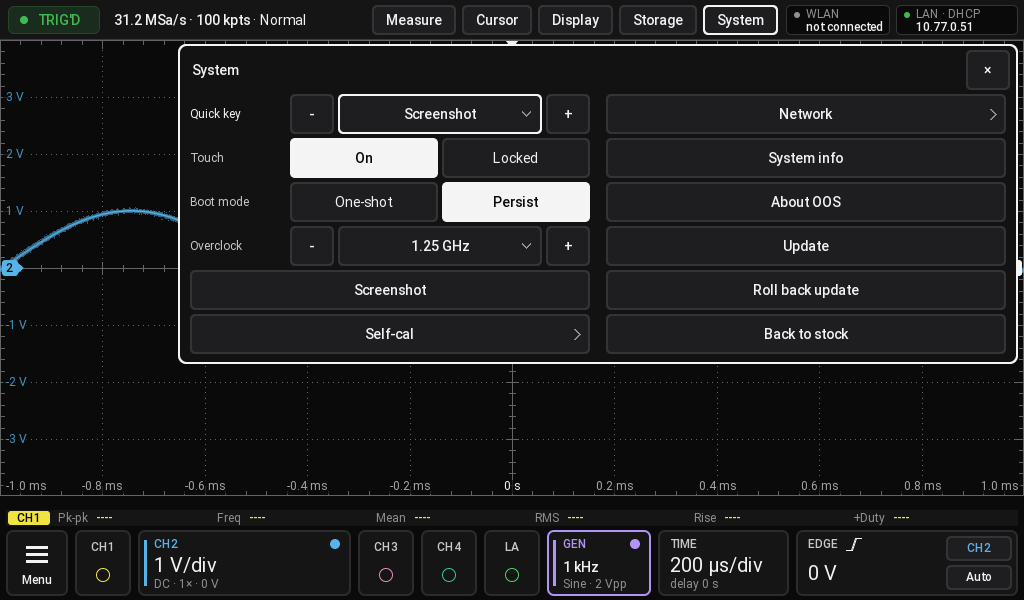 |
| The main screen, 200 kHz from the built-in generator | System menu |
|
 |
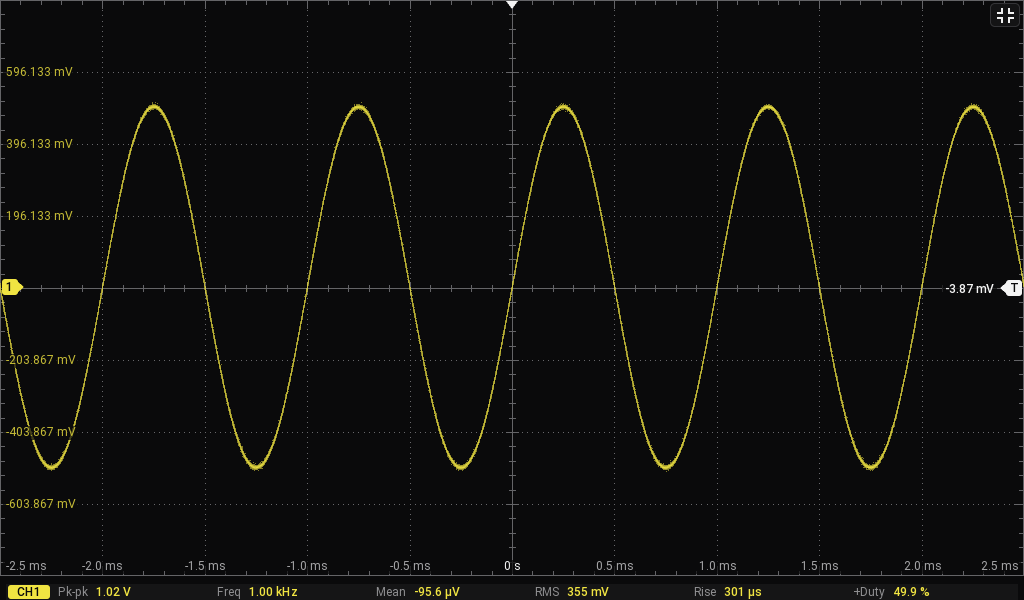 |
| After Auto: a few periods, many periods, rising or falling edge | Full screen, the same button goes back |