Object hierarchies
The previous sections have concentrated upon individual objects in QuPath, and several of their properties: ROIs, measurements, names and classifications.
This section focusses on two other things that all objects can have: parents and children. This is what lets QuPath maintain relationships between objects, within a tree-like structure called the object hierarchy.
The object hierarchy is fundamental to how QuPath works. In fact, when working with an image, the only way to retain a new object in QuPath is by putting it into a hierarchy, by assigning it as the child of an existing object (which will become the new object's parent).
Note: The Ki67 image used in several of the figures below is from the OpenSlide freely-distributable test data (OS-2.ndpi).
In principle, QuPath uses object hierarchies because they can support a natural understanding of how structures appear in images.
To help make sense of this statement, consider the following simple example:
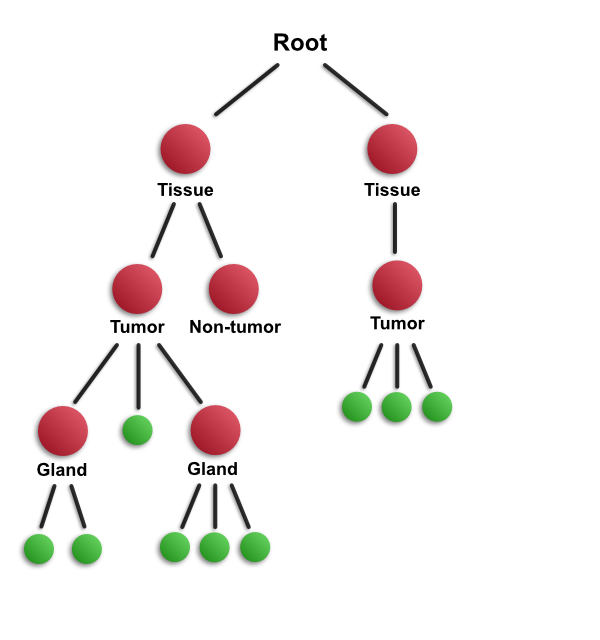
This diagram aims to depict important structures within an image in a hierarchical way - specifically, a slide scan that contains two separate pieces of tissue. One way to look at the image is from low to high magnification. This is represented in the diagram looking from top to bottom. Specifically, if you start out looking at the slide at low magnification, the first thing you will notice is likely to be the presence of two pieces of tissue. As you look more closely, you are then likely to see the main areas (e.g. tumor or non-tumor regions), and then smaller structures within these (e.g. individual glands). Finally, if you zoom in more, you will see individual cells.
Alternatively, we might go in the opposite direction - starting at high magnification, where we can see a number of individual cells. Zooming out, we might see that these cells form a gland, and zooming out further we may see that they occur within an area of tumor within a segment of tissue.
The hierarchy encodes all this information, and it can be accessed in either way: by looking from top-to-bottom or from bottom-to-top.
Hierarchies are essential for QuPath. It could be argued that the entire goal of image analysis with QuPath involves is to create a meaningful object hierarchy, and to use it to understand the image.
This is because, as described previously, working with QuPath means trying to create objects from image data. These objects need to go somewhere, and that 'somewhere' is the object hierarchy. Specifically, every image that is analyzed within QuPath has an object hierarchy associated with it, and all objects associated with that image are stored inside the same hierarchy.
When you save a .qpdata file, almost all of the file is devoted to saving the object hierarchy. There are a few other bits and pieces (e.g. workflows), but the hierarchy is the main thing that is stored... because it contains almost all of the interesting information generated during the analysis.
This might seem a bit unnecessary, since often the hierarchical nature of the analysis isn't very visible and it doesn't seem necessary to have them. Nevertheless, where that's the case then a hierarchy can still be used - it will just be quite a simple one. By using hierarchies consistently, QuPath can support both simple and more complicated applications in the same way.
Before we get too deep into that, first we need to explore how hierarchies are made and represented.
Every time you open an image within QuPath, QuPath will create an object hierarchy for the image - in preparation for storing any objects (annotations, detections) that might be needed.
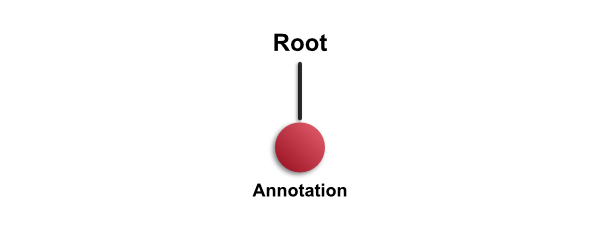
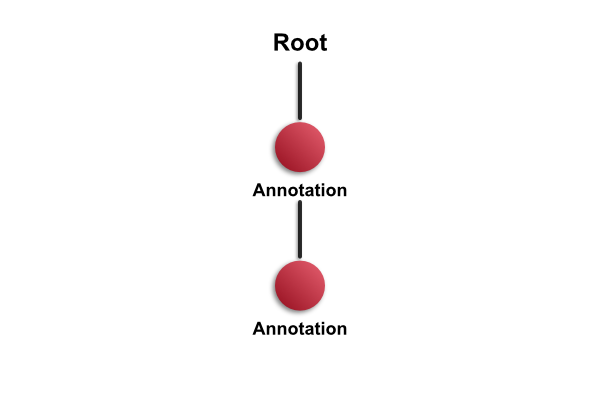
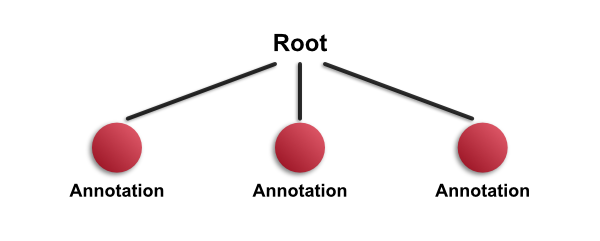
At first, every hierarchy contains only one object: the root object. The entire hierarchy is depicted in the following diagram:

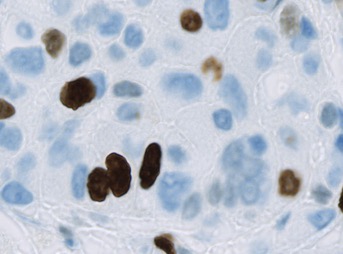
The a conceptual illustration of the hierarchy is depicted above, and a corresponding example image below.
You can think of the root object as representing the entire image or slide. Because it's always there - and it isn't drawn on top of the image - it's easy to ignore, and not very interesting. But it enables QuPath to enforce the following rule:
** The only way to add an object to an object hierarchy, is to insert it as a child of an existing object that is already in the hierarchy.**
Therefore the root is needed to have somewhere to add more objects.
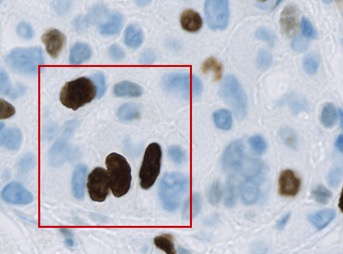
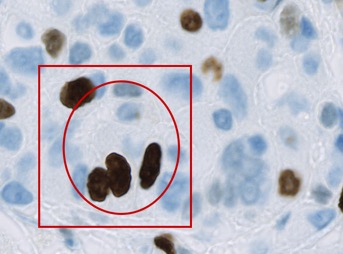
This is what happens when you draw an annotation. A new annotation object is created, and added as the first child of the root object:
Having done this, you can proceed to add another annotation. But what happens next depends upon where you draw the annotation. If your new annotation is completely contained within the existing annotation, then QuPath will add it as a child of the earlier annotation (and therefore grandchild of the root).
This will be referred to as the 'completely contained rule' later, and is used to determine where a new annotation will fit into an existing hierarchy.
However, if the new annotation is outside the existing one - or only partially overlaps it - then it will be added as a child of the root object instead.
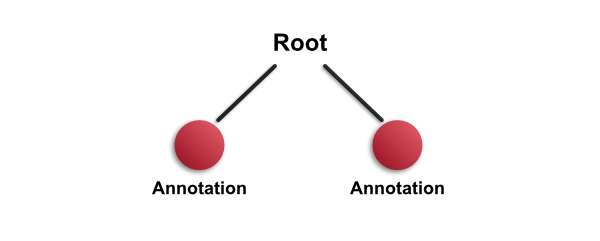
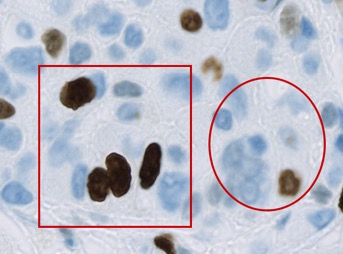
Therefore the relationships in the hierarchy depend upon where the objects are located in the image.
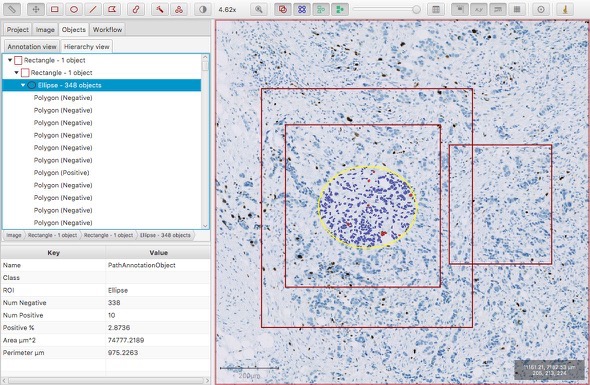
Let's assume that you have an image with three annotations drawn on it - and none of them is completed contained withing any of the others. The hierarchy looks as follows:
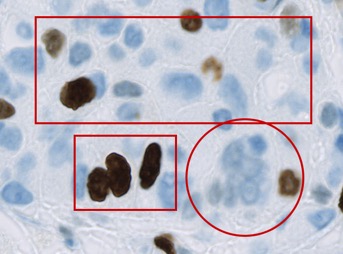
Note: In the example image, the circle annotation slightly overlaps the top rectangle. This is not enough to make either a child of the other, since neither annotation 'completely contains' the other. Therefore they are both children of the root object (and siblings of one another).
Suppose then that you select an annotation, and run a detection command within it - such as cell detection. The resulting detection objects will be added as children of the annotation that was selected, so the new hierarchy will be:
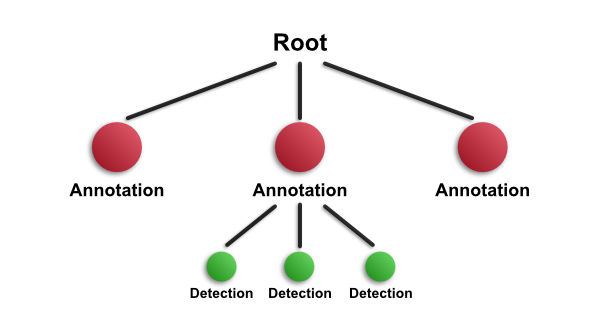
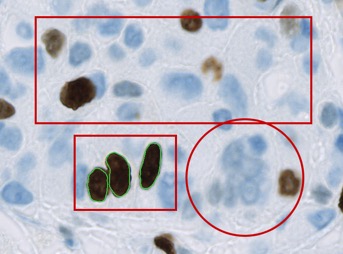
This is another way to build up the hierarchy - through a combination of drawing and detecting.
The idea works in exactly the same with with TMAs, except that in this case TMA core objects are the children of the root, and the detections fall within these. In the following diagram, we have run cell detection on three TMA cores.
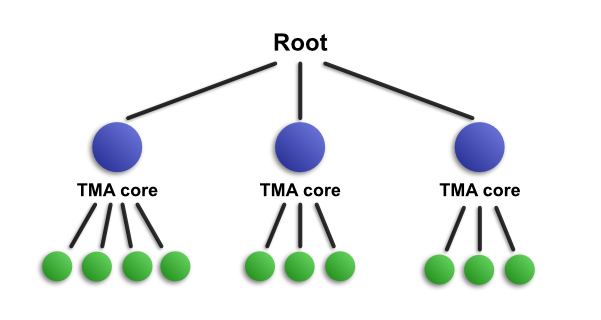
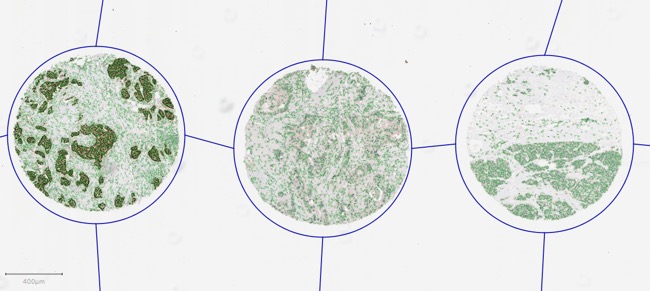
For reasons of space and simplicity, only 10 detections are included in the diagram - although 11 657 cells are shown in the image.
The same principles also apply as more objects are added, moved and removed. A very common application of this is when training tumor identification within TMAs. Here, you would start off by dearraying and then detecting cells - leading to a hierarchy such as the one shown above. You then proceed to add annotations to label regions according to the type of cell they contain. As you do these, QuPath will update the hierarchy accordingly - so that it might look like this.
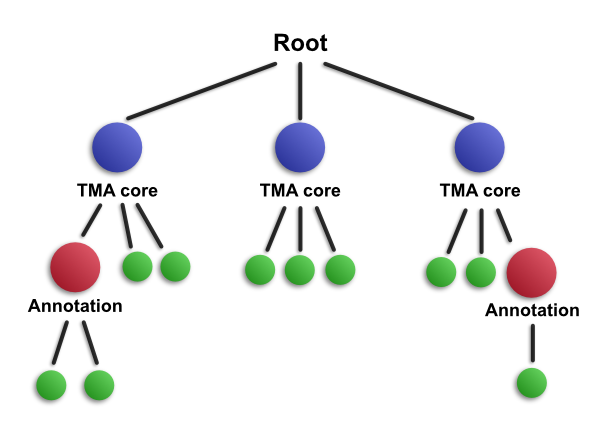
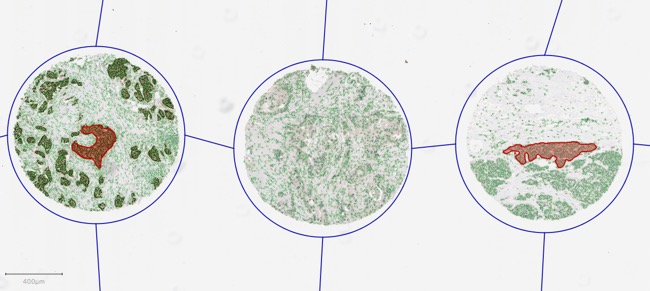
Here, you can see that annotations have been drawn inside two TMA cores - and when this has happened, they are inserted at the appropriate place in the hierarchy according to their location. This means that they become child objects for the cores and parents of the detections that they contain. Again, not all detections are shown, for reasons of space and simplicity.
Note: This means that, in a deviation from normal biology, parents don't need to be created before their children. The hierarchy aims to present a logical arrangement of objects, and the objects contained within them. But the hierarchy doesn't enforce an order in which it needs to be built: you can construct a hierarchy by detecting the large structures first, and then the smaller ones - or perhaps from detecting the smaller ones, and adding their larger parents and ancestors later. In other words, an object hierarchy can be build using either a top-down or a bottom-up approach... or even some combination of both.
The best way to get used to the idea of objects hierarchies is to play around in QuPath and see what happens.
To do this, open the Hierarchy view - it is found in the Analysis panel under the Objects tab, as shown below:
This provides a tree-like structure that shows the relationships between objects. If you draw several annotations, and then move them around, you should see that this tree updates automatically to reflect changes in the hierarchy.
Also, note the 'breadcrumb bar' below:

Whenever an object is selected this shows its ancestor objects, right back to the root object (referred to as 'Image' here).
One way to select objects further up the ancestor chain is to click on the breadcrumb bar. Another is to click more times on an image. With the Move tool selected ![]() , double-clicking on an object will select it. However triple-clicking will select its parent. And quadruple-clicking will select its grandparent... and so on, for as many generations as are available.
, double-clicking on an object will select it. However triple-clicking will select its parent. And quadruple-clicking will select its grandparent... and so on, for as many generations as are available.
QuPath aims to handle hierarchies in an intuitive way. Therefore it's probably doing what you think it's doing.
However, it's good to check - especially if you're doing something a bit more complicated from the standard analysis outlined in the documentation. Therefore here is some further technical information regarding how QuPath uses and maintains hierarchies, for anyone who is interested.
In general, QuPath will try its very best to ensure that any new objects inserted into the hierarchy in an intuitive way - so generally you don't need to worry about the details. This section is included for reference, in case someone finds that QuPath's behavior surprising on some occasions.
Here are the main rules that QuPath will apply:
- TMA core objects are always direct children of the root object. It's not possible for a TMA core object to have any other parent, even if an annotation is drawn around it.
- Annotations are assigned as the child of another object only if the ROI for the annotation is completely contained inside the ROI of the other object. If this never applies, the annotation is inserted as a child of the root object.
- Detections are initially assigned as the children of whichever object (generally an annotation or TMA core) they were created inside.
- If an annotation created around a detection, then the detection will become children of the annotation if the centroid of its ROI falls inside the annotation ROI. Note: this is a more relaxed criteria compared to the 'completely-contains' rule that applies to annotations.
- With scripting it is possible to change the hierarchy in any way, and have a lot more control over the details of where objects are inserted.
Because of the last point, QuPath can't make any guarantees regarding the state of the hierarchy. It aims to keep things in order during normal use, but it doesn't restrict programmers from doing whatever they like.
Note in case you are interested: It may seem strange that two different criteria are used for assigning objects to parents depending upon whether the object in question is an annotation or a detection. Originally it was different: the 'completely contained' rule was applied to detections as well. However, in this end this was relaxed for two reasons:
- It was really fiddly when drawing annotations to train a classifier if you needed to always make sure every detection you wanted was completely contained inside your annotation.
- A lot of calculations are required to enforce the 'completely-contains' rule, and this slowed things down a lot when millions of detections were present in the image.
Therefore for intuition and practical reasons, the 'completely contains' rule was changed for detections. However it remains for annotations because the centroid test alone can lead to weird results whenever complex shapes are drawn, such as self-intersecting polygons or shapes with holes inside them.
As described in Object measurements, QuPath can create summary statistics for TMA core and annotation objects. These are based upon the detections they contain, e.g. number of cells, percentage of positive cells etc.
For any parent object (TMA core or annotation), the summaries are calculated from all descendent detection objects, as shown below:
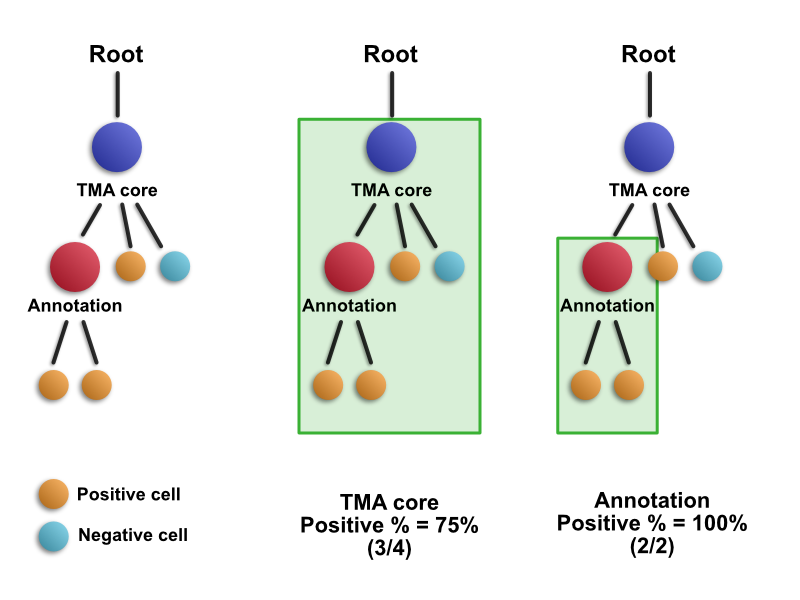
This means that all detections within a TMA core (or larger) annotation contribute to its summary score. For this reason, 3/4 cells are positive in the TMA core - and that value would stay the same even if the annotation inside the core were to be removed. If this wasn't the case, and only the direct children of the core were used, then the score would have been 50% - and annotating cores would change results. This is almost certainly not what the user would want.
For the annotation within the core, the same rule applies - all its descendant objects contribute to the summary measurement.
This is something that helps enormously when using or developing QuPath, because it allows summary measurements to be calculated dynamically. For example, if you click on a TMA core within QuPath and bring up a measurement table to see the H-score (for example) for that core, QuPath doesn't need to check some stored value it calculated when the analysis was first performed. Rather, QuPath will take the TMA core object, and count up all the classified cells that are descended from it in the hierarchy at the time when it needs to give the measurement. These calculations are performed extremely quickly, on demand, and will be repeated the next time the H-score is requested for the same core if anything has changed in the hierarchy in the meantime (e.g. cells added/removed/reclassified). This ensures that result will always be up to date.
This is nice for users, since measurement tables and survival curves can automatically update to reflect changes in the underlying hierarchy. It also helps developers creating new commands for QuPath, since it means they don't need to worry about calculating their own scores and keeping them up to date - QuPath will do most of the work for them.
When you add in training annotations to create a classifier, QuPath inserts your new annotations into the hierarchy as described above (e.e. see Classifying objects).
The classifier is then trained using the direct child objects of the annotations you have added.
For example, suppose you have 5 tumor training annotations and 5 stroma training annotations. When creating a new detection classifier, QuPath will find your 10 training annotations within the hierarchy. Then it will take all the (detection) child objects from these annotations, and group them separately depending upon whether their parent is classified as tumor or stroma. Then, it will use the measurements of all these child objects to look for patterns that can distinguish between the tumor and stroma detections. Finally, it will apply what it has learned to all the detections inside the image to classify them accordingly.
Therefore if you want to tell QuPath 'this is a tumor cell, learn from it' you need to draw a tumor annotation that will contain that cell. You can check which cells will be used for training by clicking on your classified annotations, and checking their child lists in the hierarchy view.
From the above, you'll see that hierarchies start off as quite a simple idea - but it rapidly becomes quite complicated once you get into the details. For these reasons, hierarchies could be considered one of QuPath's strengths... but also a potential weakness.
On the one hand, hierarchies allow QuPath to easily represent relationships between different structures, in addition to being able to perform many dynamic measurements and calculations quickly by traversing the hierarchy to pull out only the objects that it needs. They also allows ROIs for objects to be represented efficiently using arbitrarily polygons, with no need to store a rasterized version (i.e. each pixel in an object).
However, on the other hand, the flexibility of the representation makes it very difficult to stop objects being created which overlap one another - and this can be the source of some subtle bugs or misinterpretations in very complex cases. Also, when many thousands of objects are present within an image, evaluating the criteria necessary to determine the correct insertion point for a new object in a hierarchy can still be a performance bottleneck.
Therefore for now, hierarchies are here to stay. They offer too many advantages, and are too embedded in QuPath, to be easily removed. But it's possible that the concept will be refined in the future.