Types of object
As described previously, objects can relate to very different things, e.g. cells, hand-drawn regions, tissue microarray cores. Classifications can be used to distinguish between objects that are otherwise basically similar (e.g. different types of cell), but they don't deal with distinctions between objects that are entirely different (e.g. a cell and a TMA core).
Furthermore, it some cases it might make sense for objects to have the same classification, but still be quite different in nature. For example, it can often be desirable to hand-draw a region and classify it as tumor - but this hand-drawn region is not directly comparable to a detected tumor cell with the same classification.
Therefore, classifications are only part of the story, and there needs to be an additional way to distinguish between kinds of object. This is where the type of the object comes in.
Currently, there are three main object types within QuPath, which are:
| Type | Example | Description |
|---|---|---|
| Annotation | Hand-drawn ROI, Tissue ROI | Usually hand-drawn by the user, but sometimes also created by a detection command where a larger region of interest is needed, e.g. to represent an entire region of tissue. |
| Detection | Nucleus | Usually something small and detected by running a QuPath command, e.g. a cell nucleus. |
| TMA core | TMA core | Used only for TMA analysis. Has a extra isMissing property that is used to indicate a core that shouldn't be analyzed or included in output results. |
We have met these types before, but here we consider what they mean in more detail. The distinction between objects of different types is very important for how they are represented, behave and are displayed.
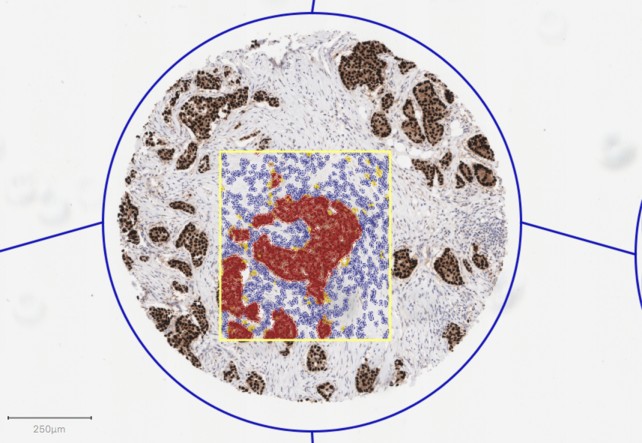
The three main object types are shown in the image above:
- a TMA core (blue outline)
- a selected annotation (yellow outline)
- and numerous detections (blue, yellow, orange and red-colored cells).
For example, in a whole slide image there can easily be millions of detected cells. It's essential that these are stored and displayed efficiently. For practical viewing purposes they should also get smaller when zooming out to low magnifications. They may be viewed as outlines, but are often they are easier to see if they are displayed 'filled-in'. Objects of this type are detections.
Annotations are different. These represent larger areas, which are often (but not always) drawn by hand using one of QuPath's drawing tools. As such, there typically isn't more than a hundred or so annotations per image (and often far fewer). They may be viewed as 'filled-in', but are more often displayed as outlines to avoid obscuring the image below, or other detections. Also, annotations should remain visible when viewing the image at low magnification. This means the thickness of their outlines needs to be adjusted depending on magnification to avoid them disappearing when zoomed out.
Generally, annotations are for defining larger regions, and detections are made inside them. When this happens, detections are stored in the 'child list' of the annotation. The annotation is stored in the 'parent' property of each detection. That way, every annotation knows about the detections it contains, and every detection knows about the annotation it belongs to. This is described in more detail in Object hierarchies.
TMA cores behave quite similarly to annotations in terms of how they are shown, but they are intended only for use with Tissue-Microarrays. Notably, they are stored in a grid, and shown with lines connecting the different cores - so that the grid can easily be verified by eye.
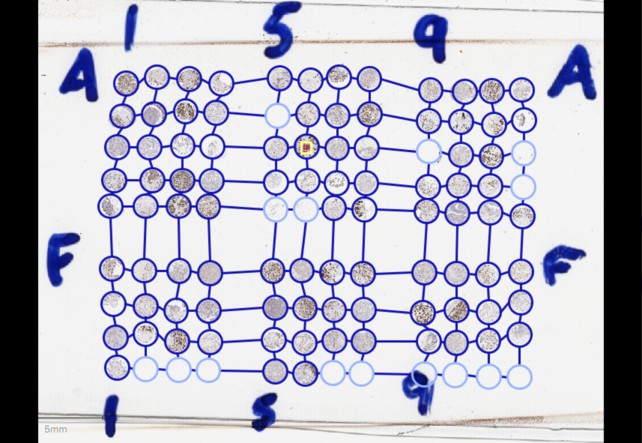
The zoomed-out version of the image above shows a full grid of TMA cores, with connecting lines. Note that the line thicknesses for the TMA cores and annotation are the same as in the previous screenshot, while the detections have been shrunk down to be indistinguishable from one another.
While the three general object types described above are sufficient for many applications, developers are also able to create more 'specialized' versions of each of them if required.
These specialized types derive most of their behavior from one of the three objects described above, but may behave a little differently or add some additional benefits.
Two examples are used commonly - both of which are derived from the detection object type.
| Type | Description |
|---|---|
| Cell | This has two ROIs - the main one represents the cell boundary, while a second (optional) ROI represents the nucleus. |
| Tile | Differs from a standard detection, in that a tile has less intrinsic 'meaning' in itself - i.e. it does not directly correspond to a recognizable structure within the image. Used to represent a (usually small) region of an image suitable for classification. Larger objects can be created by merging tiles with the same classification together. This is one way to automatically create annotations for regions of interest. |
Based upon this, it is evident that the detections shown in the screenshot above are really cells - since they have both an outer border and a nucleus ROI.
Programming note: In terms of implementation within Java, PathCellObject and TileObject are simply subclasses of PathDetectionObject... which in turn is subclassed from PathObject.