The objective of this lab is to make familiar a few technologies like IoT, Kubernetes, nodered ... in IBM Public Cloud The idea is be able to execute it, with a Academic initiative account. It is inspired (or copy, or adapted) from John Walicki Follow him, a person with always interesting ideas!!!
- Kubernetes
- Container registry
- Continous delivery
- IoT Platform
- Cloudant
- Toolchain
NOTE: We have found some issues when we execute this lab in some browsers configured in other languaje than English. I would recomend change the browser to english to follow this lab.
Install IBM Public cloud cli
https://cloud.ibm.com/docs/cli?topic=cli-getting-started&locale=en
and install Kubernetes cli
https://kubernetes.io/docs/tasks/tools/
Now you can login (if there is a problem with your credentials, continue reading)
ibmcloud login -a cloud.ibm.com -r eu-es -g Default
if there is problem accesing with ibmcloudcli you have two options:
1.- eliminate the need of MFA that disable the ability to login just with user password
https://cloud.ibm.com/iam/settings?tab=authentication
click -- No MFA, disabled CLI logins--
Unmark -- disble cli login with only a password ...
click -- apply
or
2.- login with sso (after login in ibm cloud in the web browser
ibmcloud login -a cloud.ibm.com -r eu-es -g Default -sso
in case it doesnt work create a temporary login with token
get a temporary token from console (the passcode you have to get from the console at top right
ibmcloud login -a https://cloud.ibm.com -u passcode -p <<<passcode that yu see in the console>>>>
after login select region and resoruce group
ibmcloud target -g Default -r eu-es
SELECT IBM PoC account , not user one.
(This lab is a subset of https://digidevcon.gitbook.io/kubernetes-coderdojo/exercise-0a)
Run the ibmcloud ks clusters command to verify the terminal and setup for access to the cluster
ibmcloud ks clusters
it's ok to ignore warnings you may see about versions of plugins or kubernetes cluster versions
Confirm cluster access Configure the kubectl cli available within the terminal for access to your cluster.
ibmcloud ks cluster config --cluster iot (use iot as name of the cluster)
Verify access to the Kubernetes API.
kubectl get namespace
You should see output similar to the following, if so, then your're ready to continue.
NAME              STATUS   AGE
default           Active   125m
ibm-cert-store    Active   121m
ibm-system        Active   124m
kube-node-lease   Active   125m
kube-public       Active   125m
kube-system       Active   125m
Create your own namespace
my-name substitute your user
..... PLEASE dont create a namespace userxxxxx , substitute xxxx with your number!!!!!
kubectl create namespace userxxxxx
and
kubectl get pods --namespace=userxxxxx
(you will see nothing....)
kubectl config set-context --current --namespace=userxxxx
and
kubectl config view --minify | grep namespace
Clone the lab repository
git clone https://github.com/timroster/digidevcon-iks
you should see:
Cloning into 'digidevcon-iks'...
remote: Enumerating objects: 61, done.
remote: Counting objects: 100% (61/61), done.
remote: Compressing objects: 100% (44/44), done.
remote: Total 61 (delta 13), reused 61 (delta 13), pack-reused 0
Unpacking objects: 100% (61/61), done.
Create the guestbook application deployment:
kubectl create deployment guestbook --image=ibmcom/guestbook:v1
This action will take a bit of time. To check the status of the running application, you can use:
kubectl get pods
You should see output similar to the following:
NAME                          READY     STATUS              RESTARTS   AGE
guestbook-59bd679fdc-bxdg7    0/1       ContainerCreating   0          1m
Eventually, the status should show up as Running.
kubectl get pods
it will answer
NAME                          READY     STATUS              RESTARTS   AGE
guestbook-59bd679fdc-bxdg7    1/1       Running             0          1m
The end result of the run command is not just the pod containing our application containers, but a Deployment resource that manages the lifecycle of those pods.
Once the status reads Running, we need to expose that deployment as a Service so that it can be accessed. By specifying a service type of NodePort, the service will also be mapped to a high-numbered port on each cluster node. The guestbook application listens on port 3000, so this is also specified in the command. Run:
kubectl expose deployment guestbook --type="LoadBalancer" --port=3000
service "guestbook" exposed. As it will create a load balancer, it will take several minutes. Dont wait for it.
To find the port used on that worker node, examine your new service:
kubectl get service guestbook
it will answer
NAME        TYPE       CLUSTER-IP      EXTERNAL-IP   				PORT(S)          AGE
guestbook   NodePort   172.21.12.235   d052bce2-eu-de.lb.appdomain.cloud        3000:30805/TCP   1m
The output shows that the is 30805. The service will take incoming connections to the load balancer and forward to port 3000 to the container inside the pod.
guestbook is now running on your cluster, and exposed to the internet.
We need to find out where it is accessible. The worker nodes running in the container service get external IP addresses. Run $ ibmcloud cs workers , and note the public IP listed on the line.
ibmcloud ks workers -c iot
it will answer
ID Primary IP Flavor State Status Zone Version Operating System
kube-cvc07o3f0286kdik2jt0-ioc-default-0000011c 10.243.0.4 bx2.8x32 normal Ready eu-de-1 1.32.1_1532 UBUNTU_24_64
kube-cvc07o3f0286kdik2jt0-ioc-default-000002f0 10.243.128.4 bx2.8x32 normal Ready eu-de-3 1.32.1_1532 UBUNTU_24_64
kube-cvc07o3f0286kdik2jt0-ioc-default-00000380 10.243.64.4 bx2.8x32 normal Ready eu-de-2 1.32.1_1532 UBUNTU_24_64
kube-cvc07o3f0286kdik2jt0-ioc-default-000004fd 10.243.64.12 bx2.8x32 normal Ready eu-de-2 1.32.1_1532 UBUNTU_24_64
kube-cvc07o3f0286kdik2jt0-ioc-default-00000512 10.243.0.12 bx2.8x32 normal Ready eu-de-1 1.32.1_1532 UBUNTU_24_64
kube-cvc07o3f0286kdik2jt0-ioc-default-000006e2 10.243.128.11 bx2.8x32 normal Ready eu-de-3 1.32.1_1532 UBUNTU_24_64
Now that you have both the address and the port, you can now access the application in the web browser at :. In the example case this is d052bce2-eu-de.lb.appdomain.cloud:3000. Enter in a browser tab your IP address and NodePort for your deployment. Try out the guestbook by putting in a few entries. Keep this browser tab handy as you can use it in the next exercise as well.
Congratulations, you've now deployed an application to Kubernetes!
Scale apps with replicas
A replica is a copy of a pod that contains a running service. By having multiple replicas of a pod, you can ensure your deployment has the available resources to handle increasing load on your application.
kubectl provides a scale subcommand to change the size of an existing deployment. Let's increase our capacity from a single running instance of guestbook up to 10 instances using:
kubectl scale --replicas=10 deployment guestbook
and deployment "guestbook" scaled
If you remember back to the architecture overview in the previous exercise, the kubectl scale command updates the desired state in the etcd database in Kubernetes. The watchers and controllers will now try to make reality match the desired state of 10 replicas by starting 9 new pods with the same configuration as the first.
To see your changes being rolled out, you can run:
kubectl rollout status deployment guestbook
The rollout might occur so quickly that you may only see deployment "guestbook" successfully rolled out for the output.
Waiting for rollout to finish: 1 of 10 updated replicas are available...
Waiting for rollout to finish: 2 of 10 updated replicas are available...
Waiting for rollout to finish: 3 of 10 updated replicas are available...
Waiting for rollout to finish: 4 of 10 updated replicas are available...
Waiting for rollout to finish: 5 of 10 updated replicas are available...
Waiting for rollout to finish: 6 of 10 updated replicas are available...
Waiting for rollout to finish: 7 of 10 updated replicas are available...
Waiting for rollout to finish: 8 of 10 updated replicas are available...
Waiting for rollout to finish: 9 of 10 updated replicas are available...
deployment "guestbook" successfully rolled out
Once the rollout has finished, ensure your pods are running by using:
kubectl get pods
You should see output listing 10 replicas of your deployment:
NAME                        READY     STATUS    RESTARTS   AGE
guestbook-562211614-1tqm7   1/1       Running   0          1d
guestbook-562211614-1zqn4   1/1       Running   0          2m
guestbook-562211614-5htdz   1/1       Running   0          2m
guestbook-562211614-6h04h   1/1       Running   0          2m
guestbook-562211614-ds9hb   1/1       Running   0          2m
guestbook-562211614-nb5qp   1/1       Running   0          2m
guestbook-562211614-vtfp2   1/1       Running   0          2m
guestbook-562211614-vz5qw   1/1       Running   0          2m
guestbook-562211614-zksw3   1/1       Running   0          2m
guestbook-562211614-zsp0j   1/1       Running   0          2m
Now you can test in different browser to understand how important is a shared storage solution. We have deployed a stateless solution, without a storage replication.
Update and roll back apps Kubernetes allows you to do a rolling upgrade of your application to a new container image. Kubernetes allows you to easily update the running image but also allows you to easily undo a rollout if a problem is discovered during or after deployment.
In the previous lab, we used an image with a v1 tag. For our upgrade, we'll use the image with the v2 tag.
To update and roll back:
Using kubectl, you can now update your deployment to use the v2 image. kubectl allows you to change details about existing resources with the set subcommand. We can use it to change the image being used.
kubectl set image deployment/guestbook guestbook=ibmcom/guestbook:v2
Note that a pod could have multiple containers, each with its own name. Each image can be changed individually or all at once by referring to the name. In the case of our guestbook Deployment, the container name is also guestbook. Multiple containers can be updated at the same time. (More information.)
Check the status of the rollout. The rollout might occur so quickly that you may only see deployment "guestbook" successfully rolled out for the output.
kubectl rollout status deployment/guestbook
it would
Waiting for rollout to finish: 2 out of 10 new replicas have been updated...
Waiting for rollout to finish: 3 out of 10 new replicas have been updated...
Waiting for rollout to finish: 3 out of 10 new replicas have been updated...
Waiting for rollout to finish: 3 out of 10 new replicas have been updated...
Waiting for rollout to finish: 4 out of 10 new replicas have been updated...
Waiting for rollout to finish: 4 out of 10 new replicas have been updated...
Waiting for rollout to finish: 4 out of 10 new replicas have been updated...
Waiting for rollout to finish: 4 out of 10 new replicas have been updated...
Waiting for rollout to finish: 4 out of 10 new replicas have been updated...
Waiting for rollout to finish: 5 out of 10 new replicas have been updated...
Waiting for rollout to finish: 5 out of 10 new replicas have been updated...
Waiting for rollout to finish: 5 out of 10 new replicas have been updated...
Waiting for rollout to finish: 6 out of 10 new replicas have been updated...
Waiting for rollout to finish: 6 out of 10 new replicas have been updated...
Waiting for rollout to finish: 6 out of 10 new replicas have been updated...
Waiting for rollout to finish: 7 out of 10 new replicas have been updated...
Waiting for rollout to finish: 7 out of 10 new replicas have been updated...
Waiting for rollout to finish: 7 out of 10 new replicas have been updated...
Waiting for rollout to finish: 7 out of 10 new replicas have been updated...
Waiting for rollout to finish: 8 out of 10 new replicas have been updated...
Waiting for rollout to finish: 8 out of 10 new replicas have been updated...
Waiting for rollout to finish: 8 out of 10 new replicas have been updated...
Waiting for rollout to finish: 8 out of 10 new replicas have been updated...
Waiting for rollout to finish: 9 out of 10 new replicas have been updated...
Waiting for rollout to finish: 9 out of 10 new replicas have been updated...
Waiting for rollout to finish: 9 out of 10 new replicas have been updated...
Waiting for rollout to finish: 1 old replicas are pending termination...
Waiting for rollout to finish: 1 old replicas are pending termination...
Waiting for rollout to finish: 1 old replicas are pending termination...
Waiting for rollout to finish: 9 of 10 updated replicas are available...
Waiting for rollout to finish: 9 of 10 updated replicas are available...
Waiting for rollout to finish: 9 of 10 updated replicas are available...
deployment "guestbook" successfully rolled out
Test the application as before, by accessing : (use the same as the previous lab) in the browser to confirm your new code is active.
Remember, to get the "nodeport" and "public-ip" use:
kubectl describe service guestbook
and (replace mycluster below if you used a different name for your cluster , "IOT" probably):
ibmcloud ks workers -c iot
To verify that you're running "v2" of guestbook, press down shift while clicking on reload to discard the cached content and look at the title of the page, it should now be Guestbook - v2
If you want to undo your latest rollout, use:
kubectl rollout undo deployment guestbook
You can then use kubectl rollout status deployment/guestbook to see the status.
When doing a rollout, you see references to old replicas and new replicas. The old replicas are the original 10 pods deployed when we scaled the application. The new replicas come from the newly created pods with the different image. All of these pods are owned by the Deployment. The deployment manages these two sets of pods with a resource called a ReplicaSet. We can see the guestbook ReplicaSets with:
kubectl get replicasets -l app=guestbook
NAME DESIRED CURRENT READY AGE guestbook-5f5548d4f 10 10 10 21m guestbook-768cc55c78 0 0 0 3h
Before we continue, let's delete the application so we can learn about a different way to achieve the same results by using resource files instead of providing command line options.
To remove the deployment, use:
kubectl delete deployment guestbook
To remove the service,use:
kubectl delete service guestbook
Access the platform
request a created instance (it will be something like this 2zn7uj (request for your exercise)
so the url would be something like this (this is not real) https://2zn7uj.internetofthings.ibmcloud.com/dashboard/
Wait for a few seconds if a session expired page appears Then in the top right click on login, and after that, once again in the top right select the space.
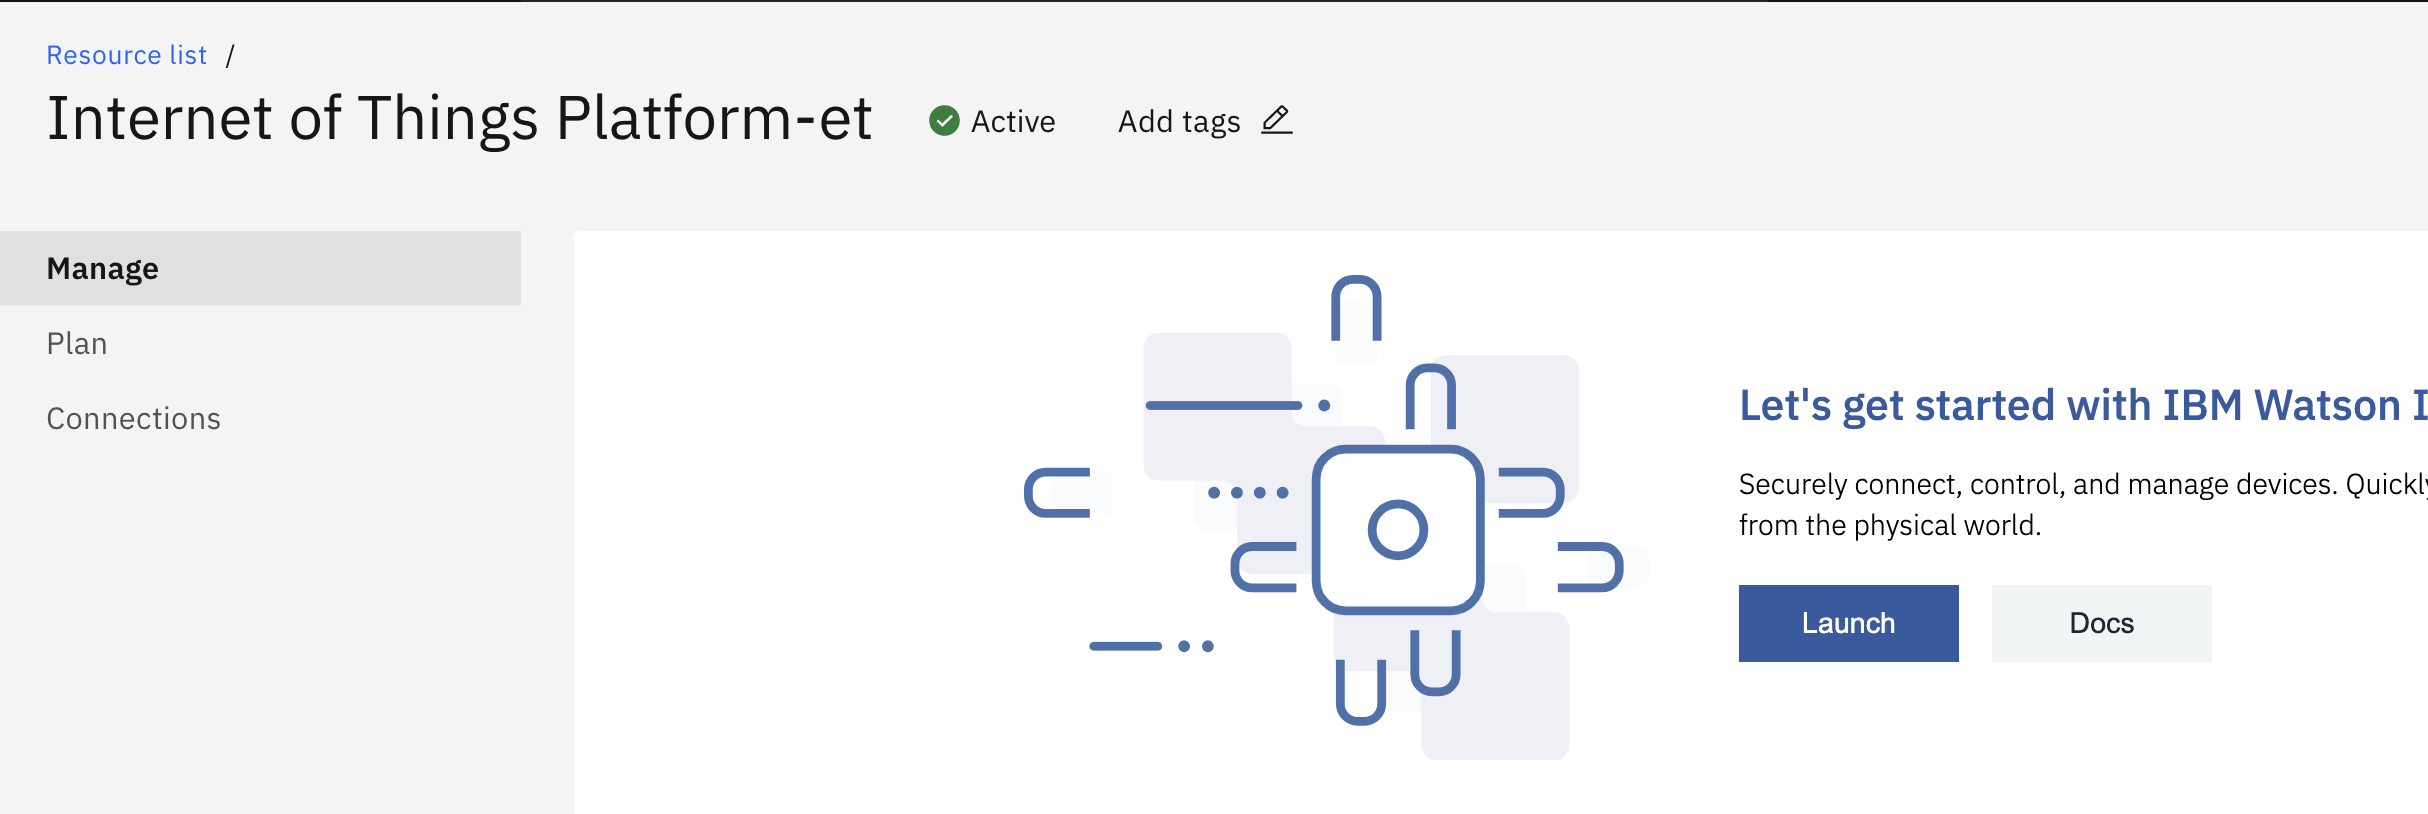
If you have some problems accesing, "login" (the user will appear at top right) and back to the previous screen and click it again.
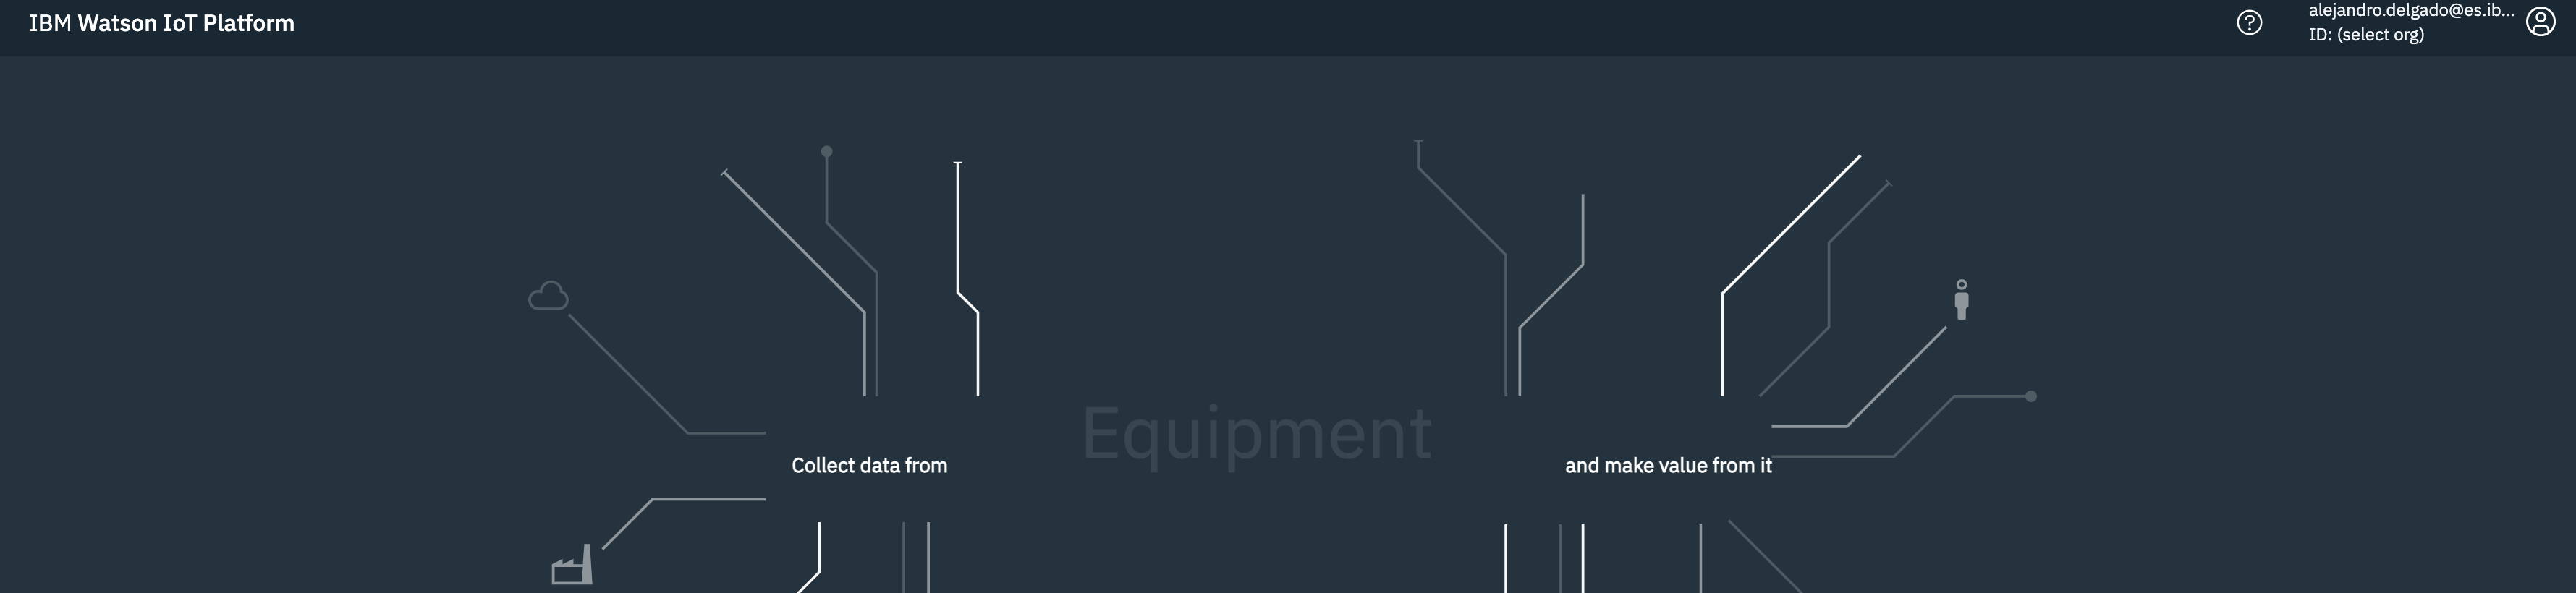
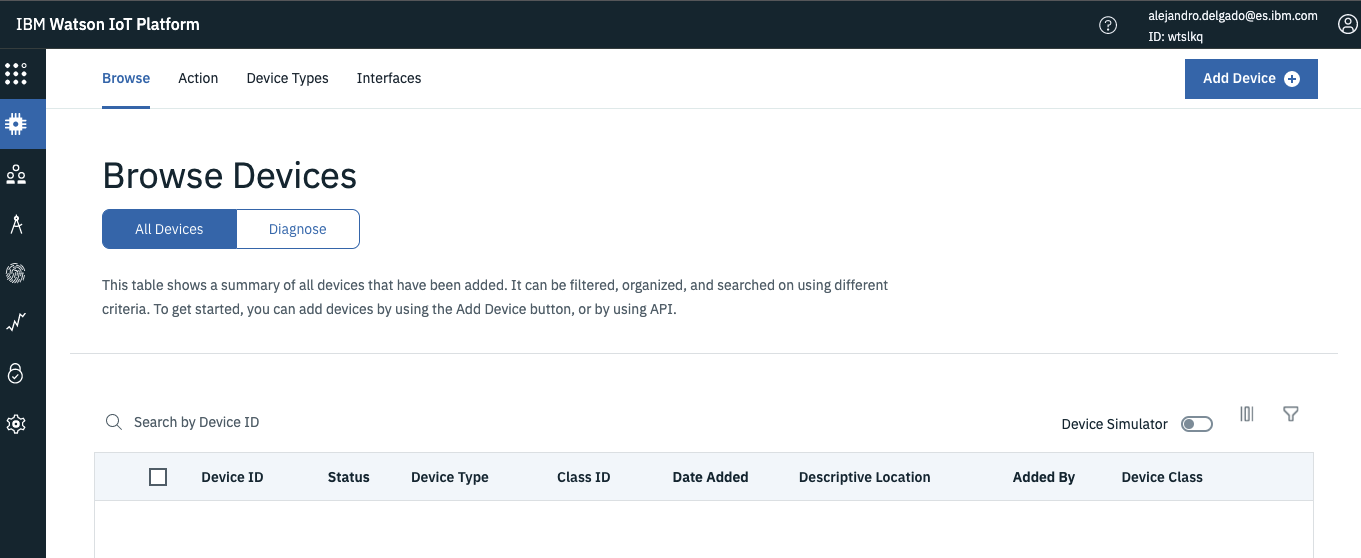
Now you are ready for create or add a device
Lets give it a type and an ID (Android in our lab, but add your name to identify it in the platform)=> Be care, the app we will use need this device, if you use the app, name "Android".
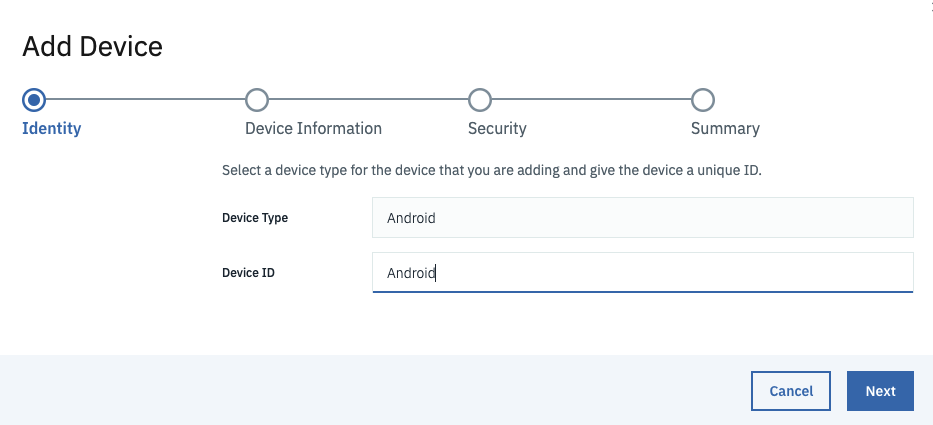
In our exercise we will skip the device information Next
we will create an authentication token (write down it, you will not be able to recover later) 12345678 in our lab
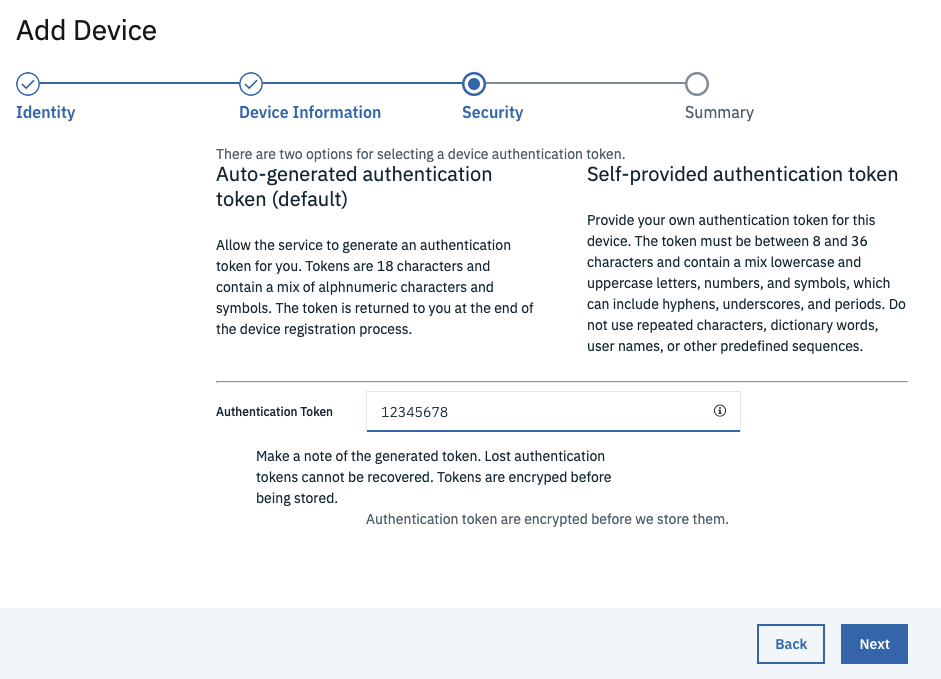
Dont forget to finish !!!!
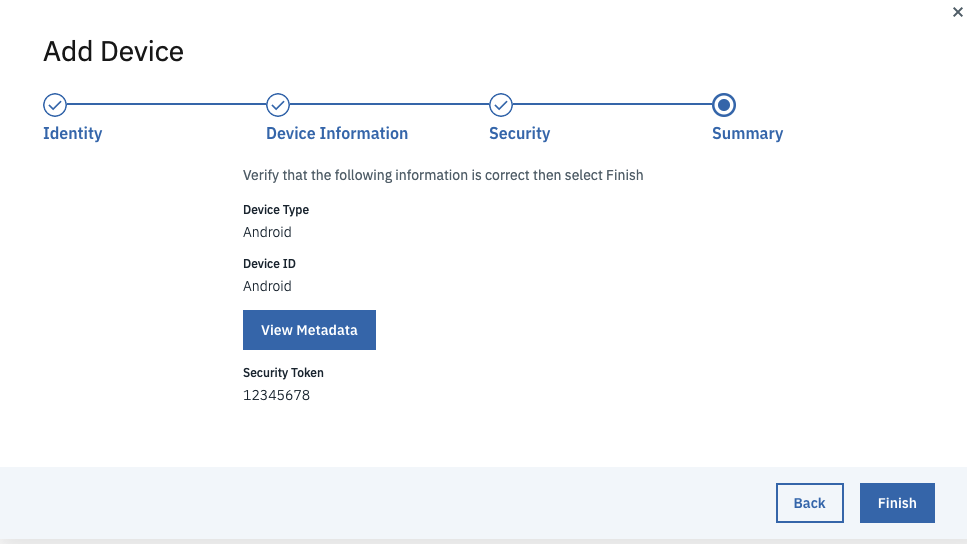
It is time to test it, you have two option simulate or download the app.
1.-Download in yor Android Accelerator app "https://ibm.biz/apkiot2"
2.-Create a simulation, at bottom of the page, you have the ability to create simulations, click on it, create a simulation a give it your name.
be care selecting your device and
We will use data like this

{
"d": {
	"acceleration_x": 0.2681506,
	"acceleration_y": 0.038307227,
	"acceleration_z": 9.730036,
	"roll": -0.027552081,
	"pitch": -0.003935493,
	"yaw": 0.0030526258,
	"longitude": 0,
	"latitude": 0,
	"heading": 0,
	"speed": 0,
	"trip_id": "1648763355",
	"timestamp": "2022-03-31T23:51:36.404+02:00"
	}
}
We will see later how to use and see the simulation
IF YOU USE THE APP ----- You would need some data --- IF YOU USE THE APP
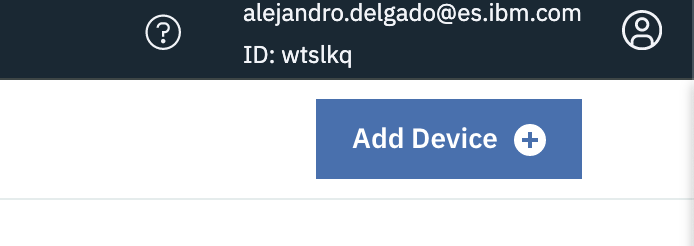
At top right you have the organization that need in the aplication (You can see also in the url of the IoT platform at the beginning) https://wtzlkq.internetofthings.ibmcloud.com/dashboard/apps/browse =>> wtzlkq would be my organization The device name "Android" The code "12345678"
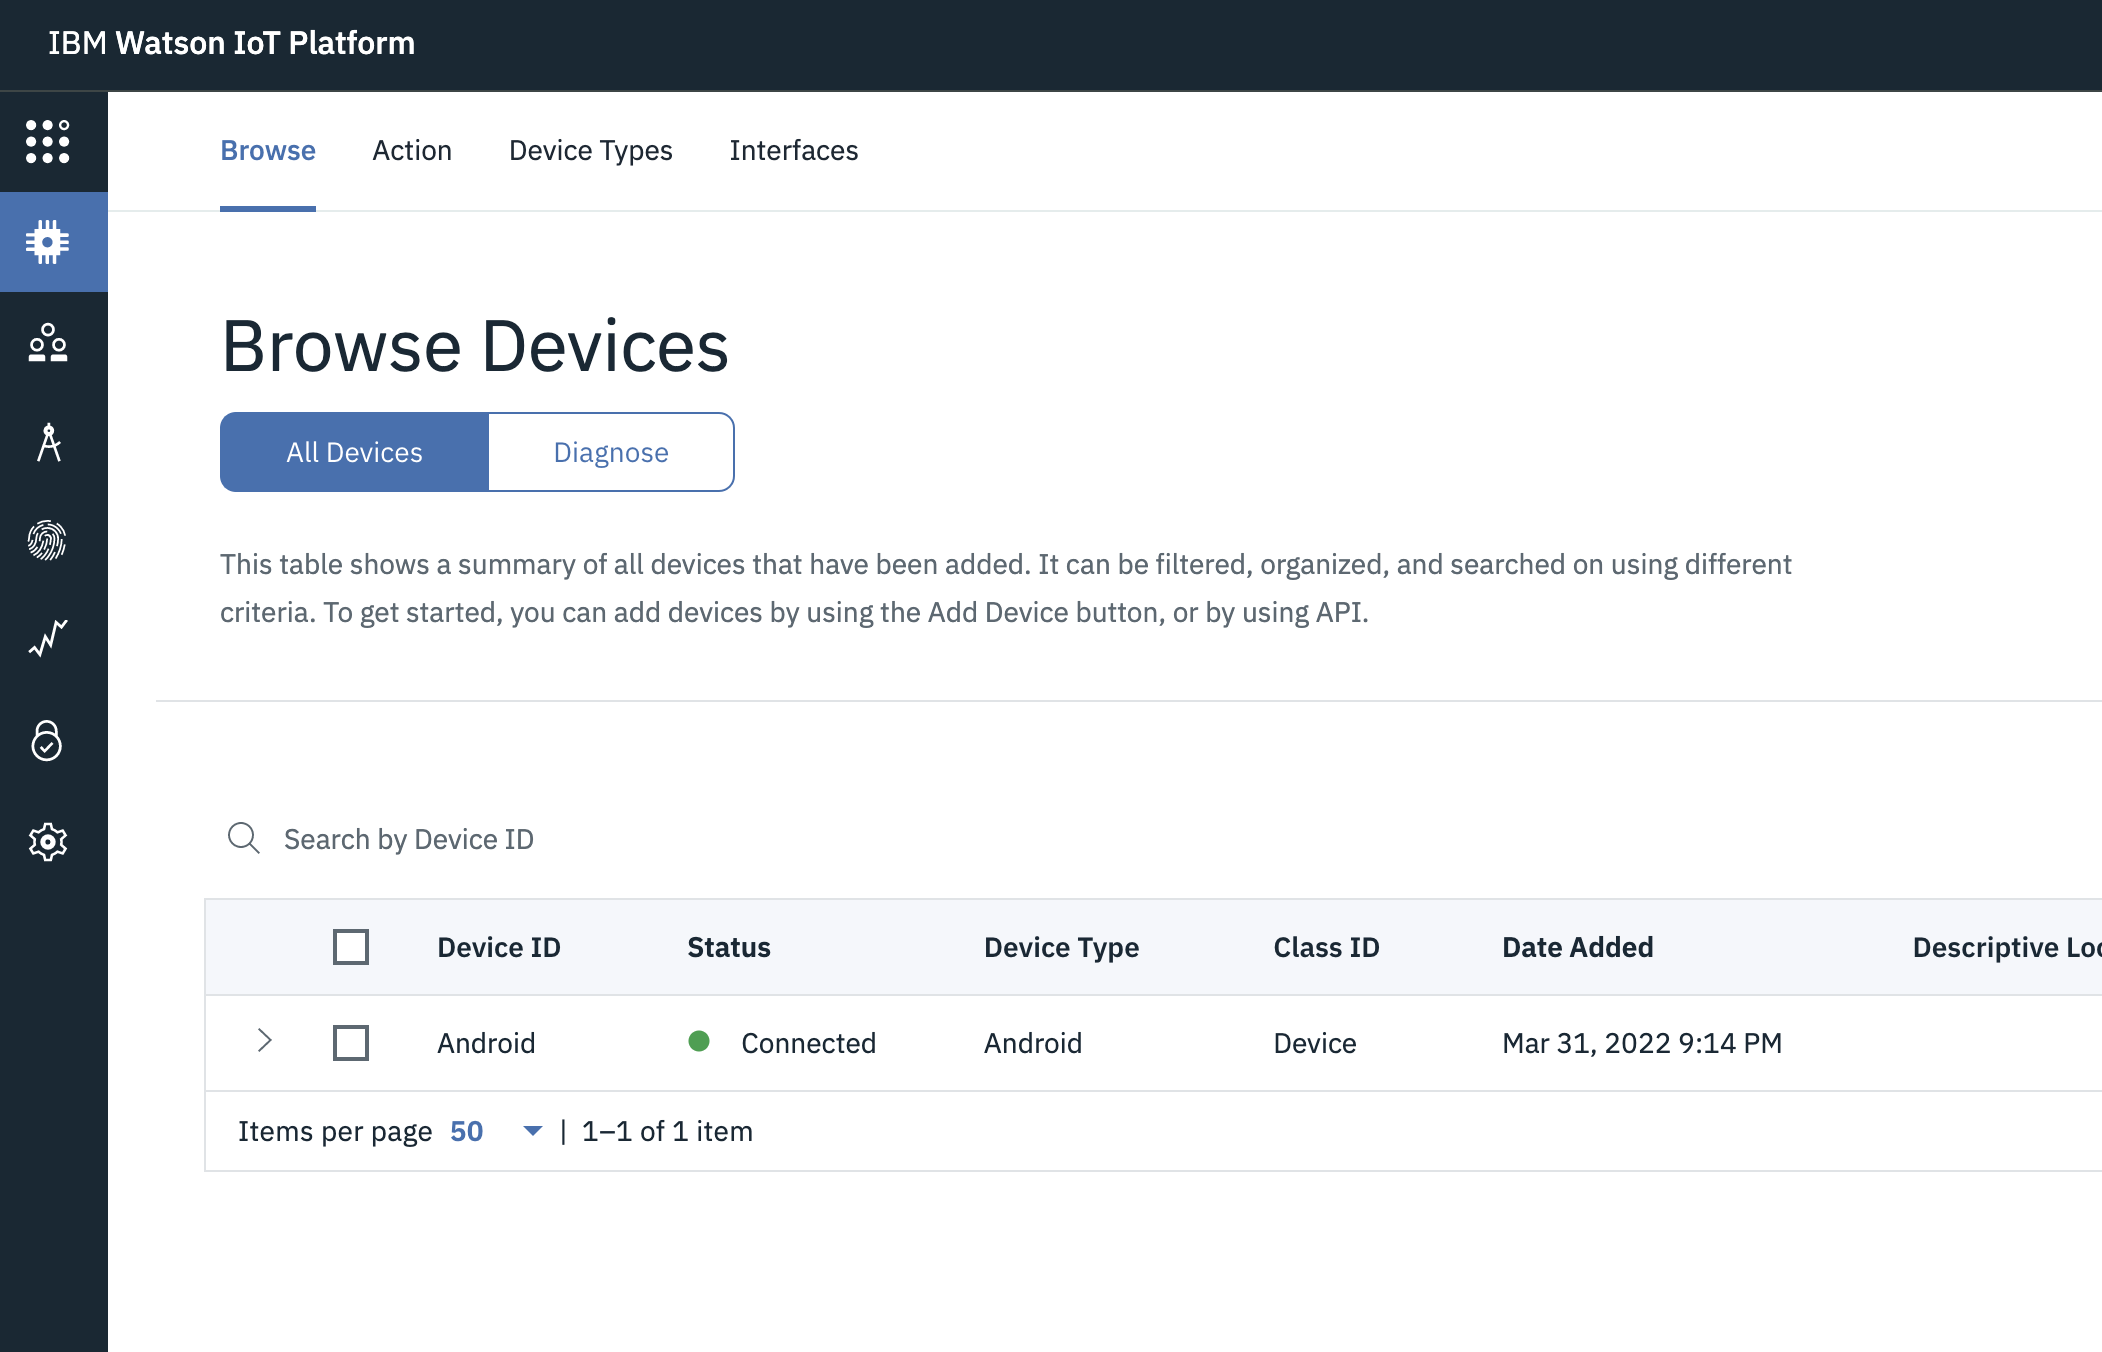
Now the device appears as connected
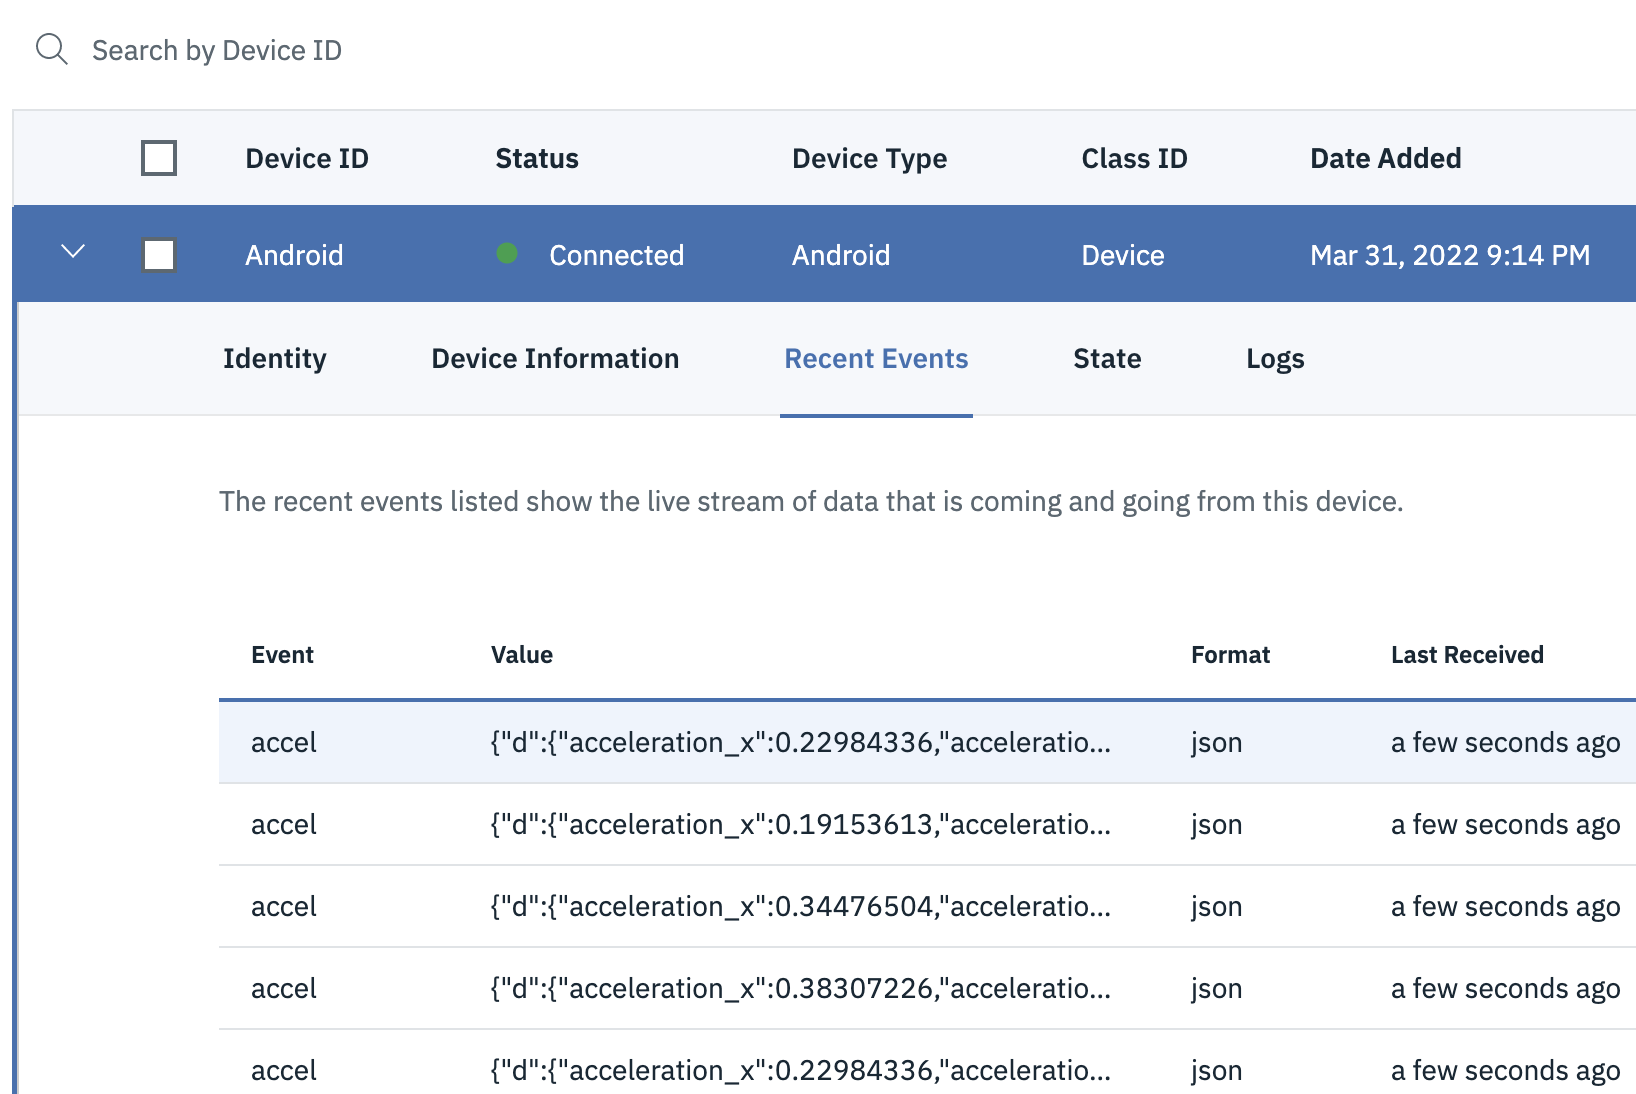
And you will start receiving events
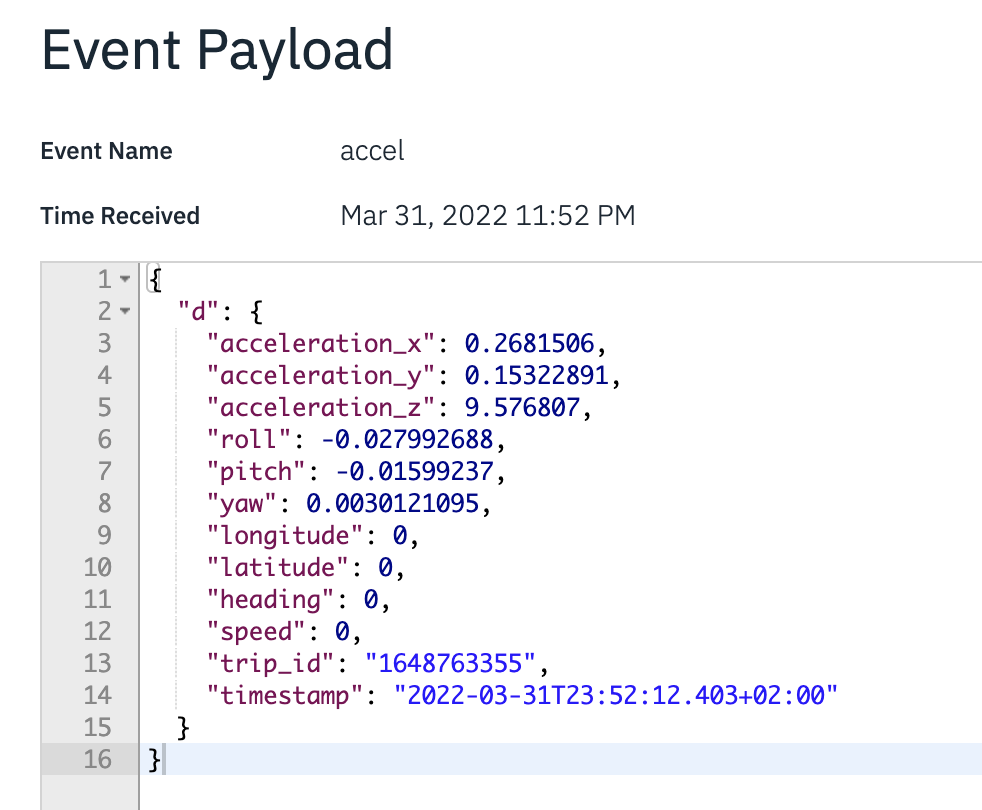
and events are like this
{
"d": {
	"acceleration_x": 0.2681506,
	"acceleration_y": 0.038307227,
	"acceleration_z": 9.730036,
	"roll": -0.027552081,
	"pitch": -0.003935493,
	"yaw": 0.0030526258,
	"longitude": 0,
	"latitude": 0,
	"heading": 0,
	"speed": 0,
	"trip_id": "1648763355",
	"timestamp": "2022-03-31T23:51:36.404+02:00"
	}
}
It is time now to create a nodered application that will allow us to move data from an environment to other, in this lab to visualize.
In the console

we will verify the list of clusters
ibmcloud ks clusters
and assure the configuration
ibmcloud ks cluster config --cluster mycluster
and set again the namespace
kubectl config set-context --current --namespace=userxxxx
lets create a deployment
kubectl create deployment nodered --image=nodered/node-red
and verify the pods
kubectl get pods
also expose it
kubectl expose deployment nodered --type="NodePort" --port=1880
gather Ip and port
ibmcloud ks workers -c mycluster
==>> Public IP
kubectl describe service nodered
==>> NodePort
to access node-red use this **public-IP:Nodeport **
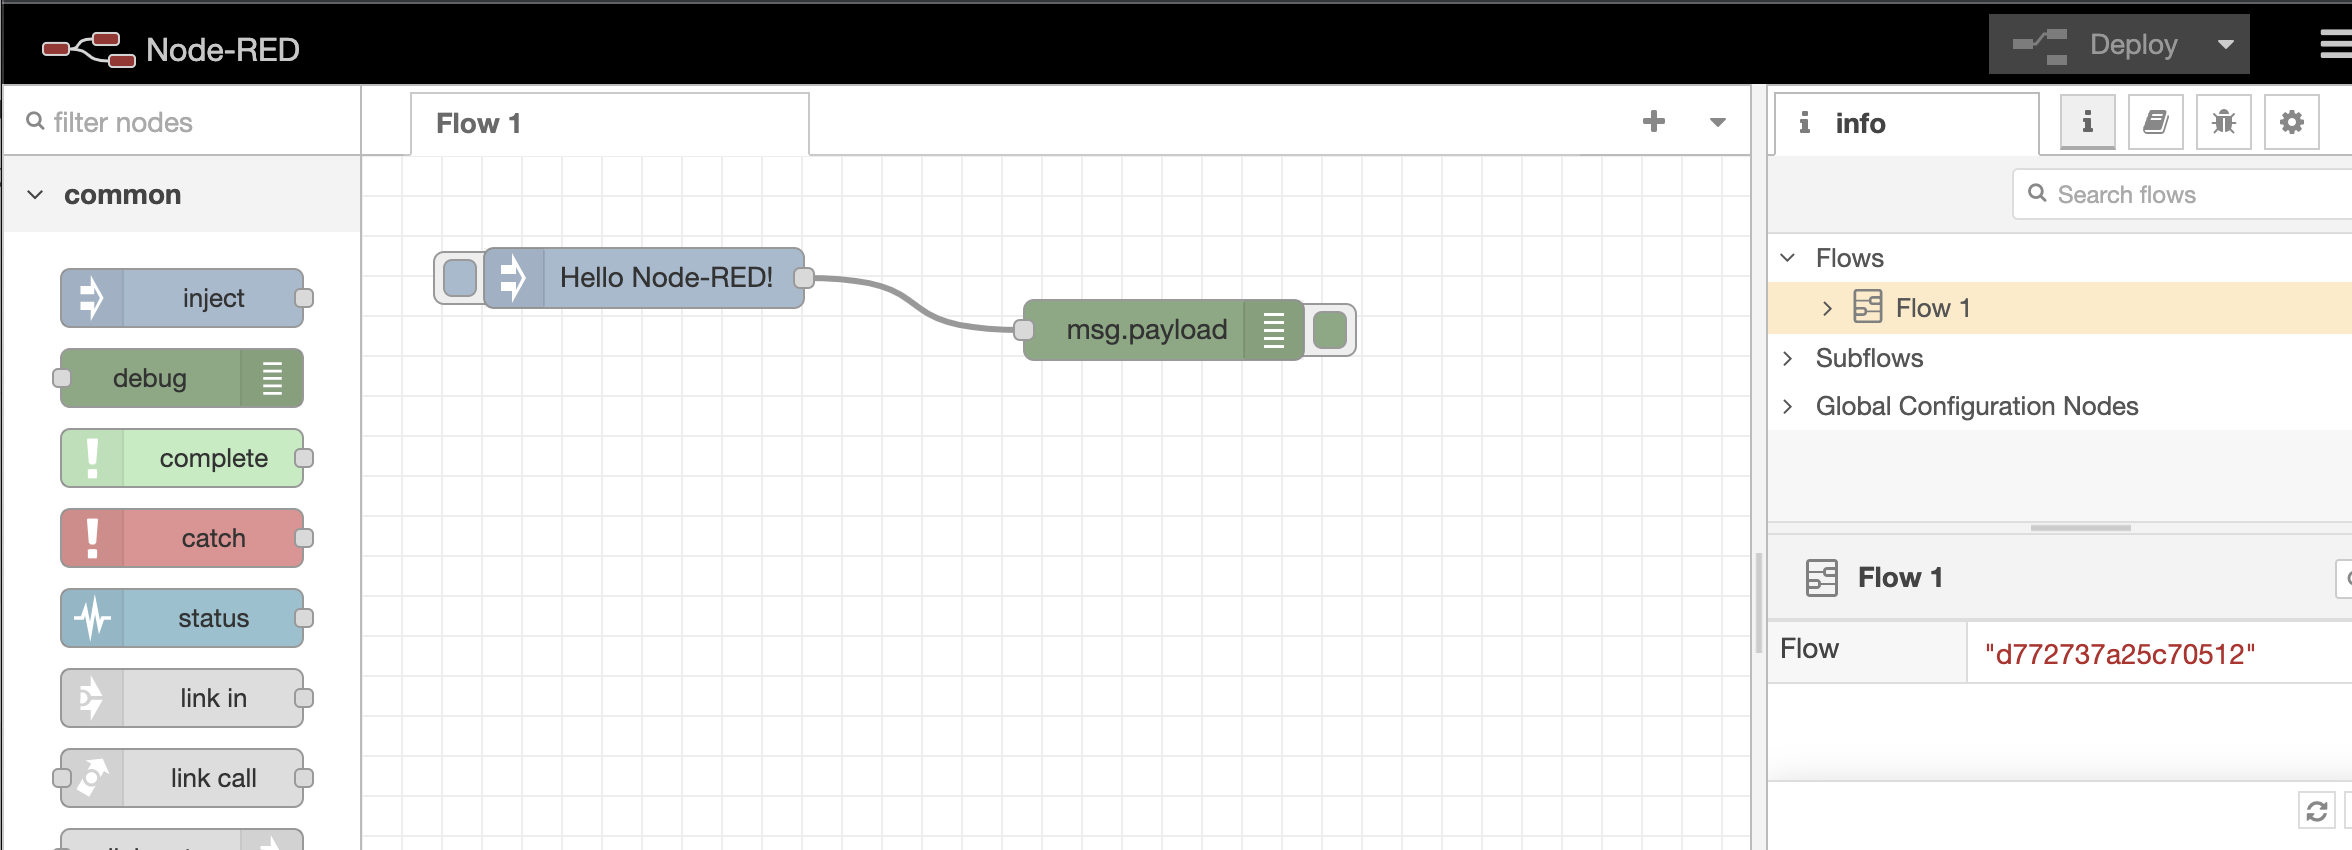
Here we are
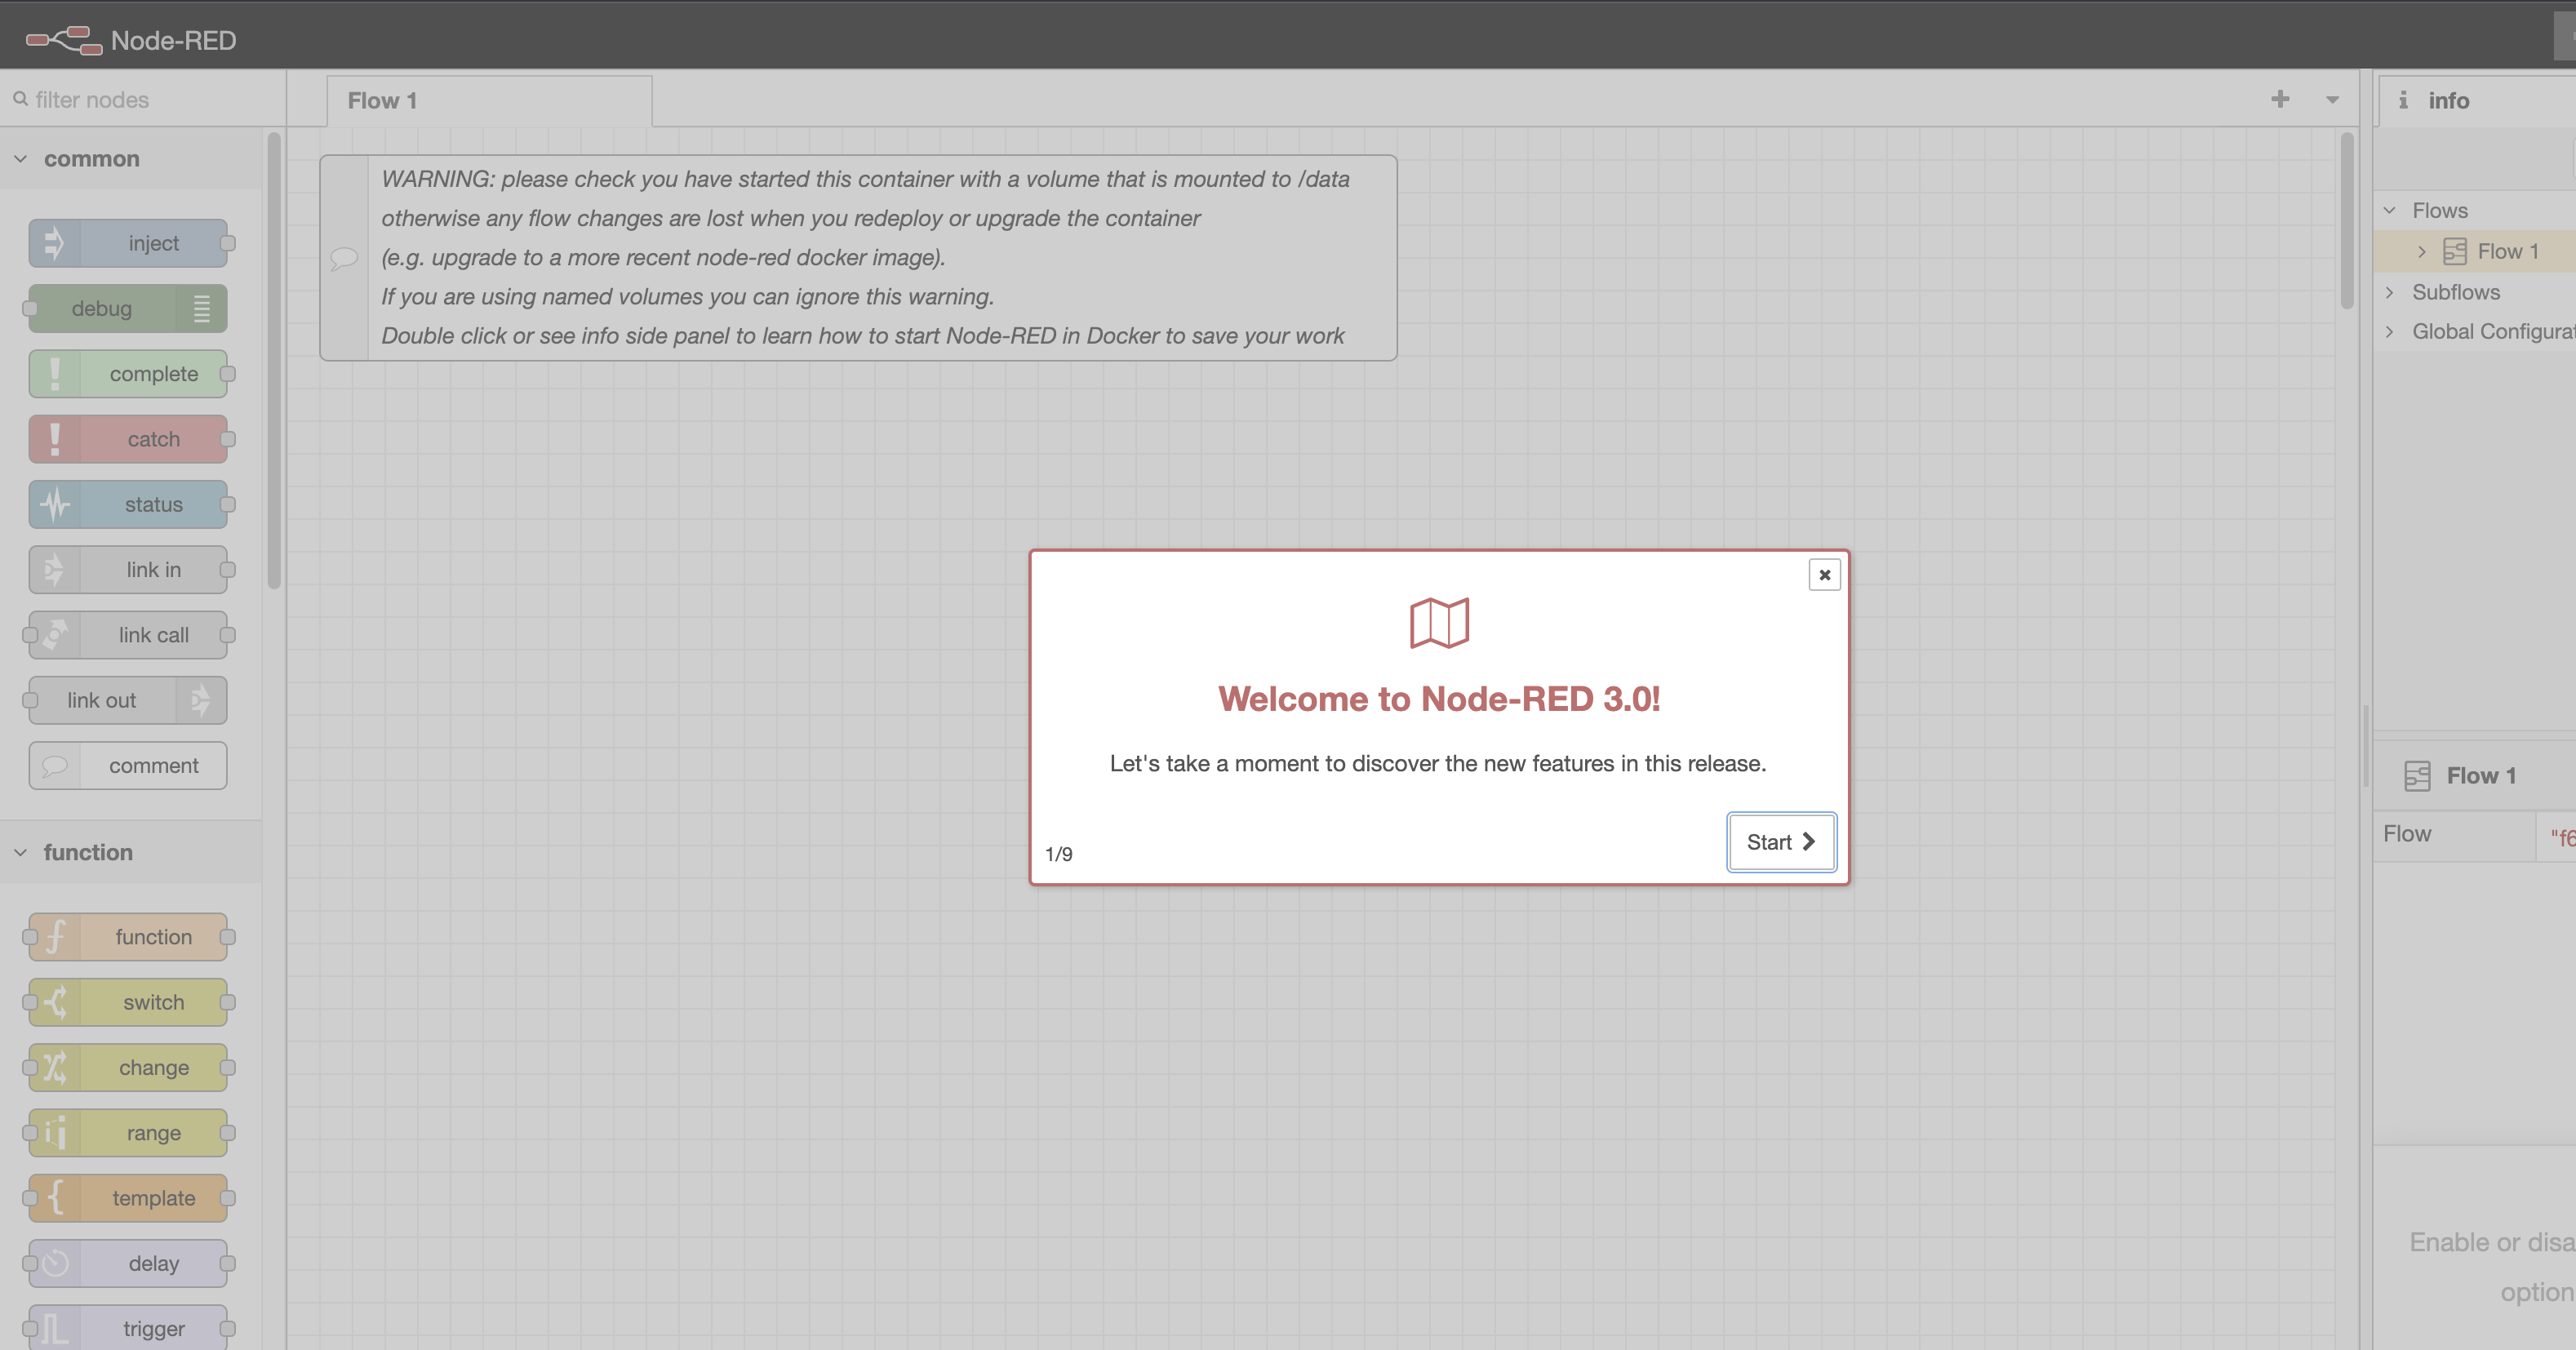
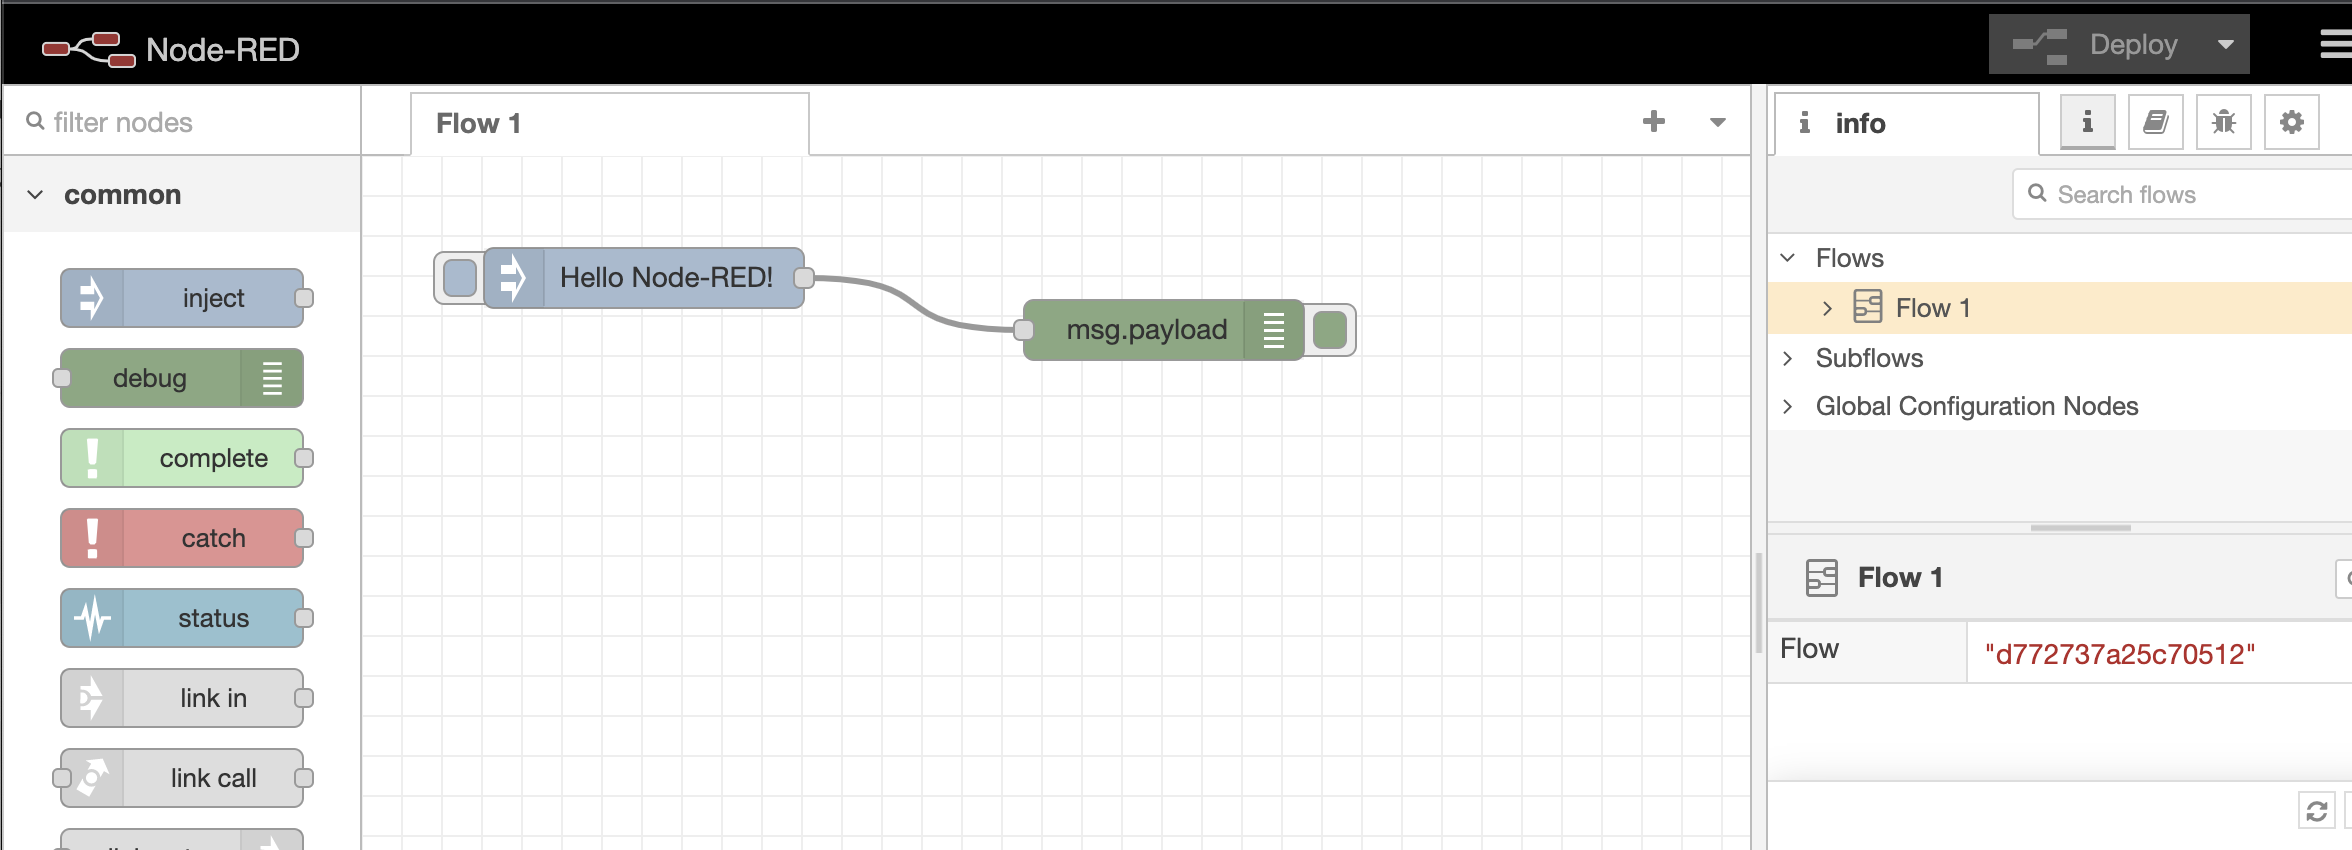
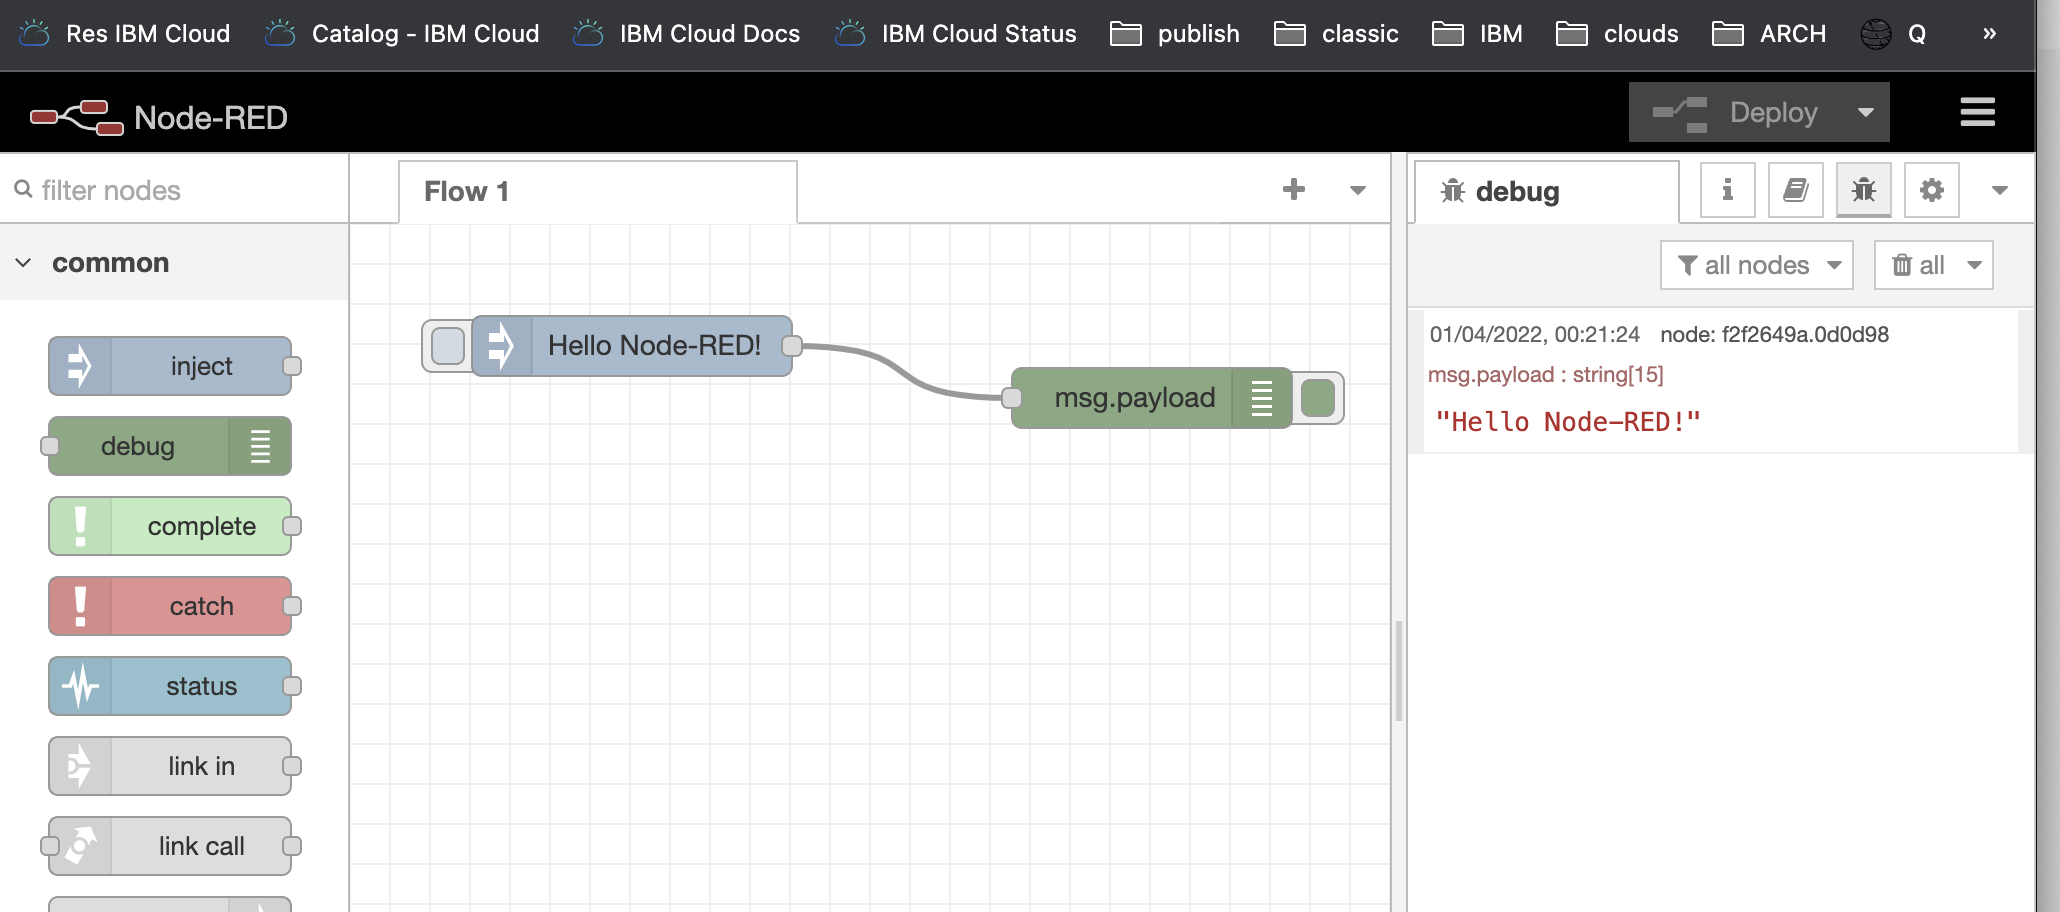
Click on the small bug on the right-top and in the button close to the "hello" tab
Now it is time to include a couple of "palettes". (We are going to use this temporal procedure before I add a final release with including it in the pipeline.)
node-red-contrib-scx-ibmiotapp

node-red-dashboard
at top right - manage palette
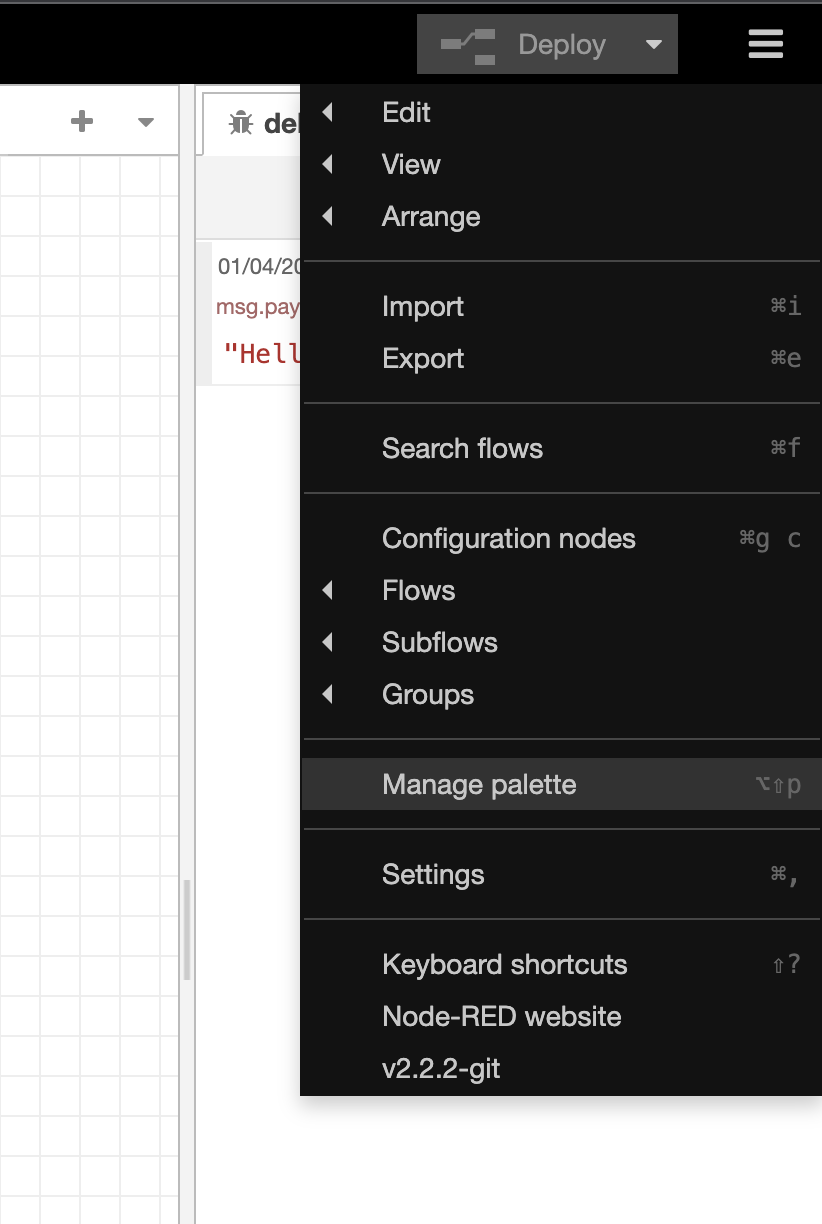
and now install it
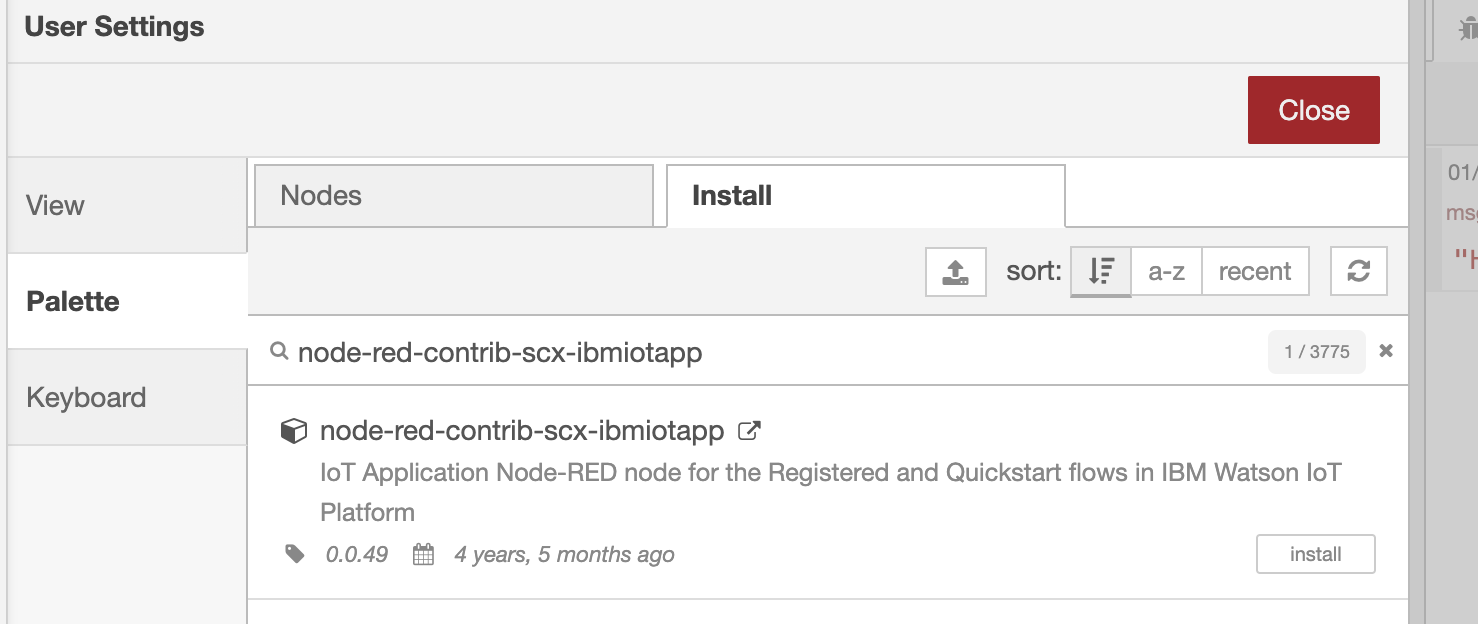
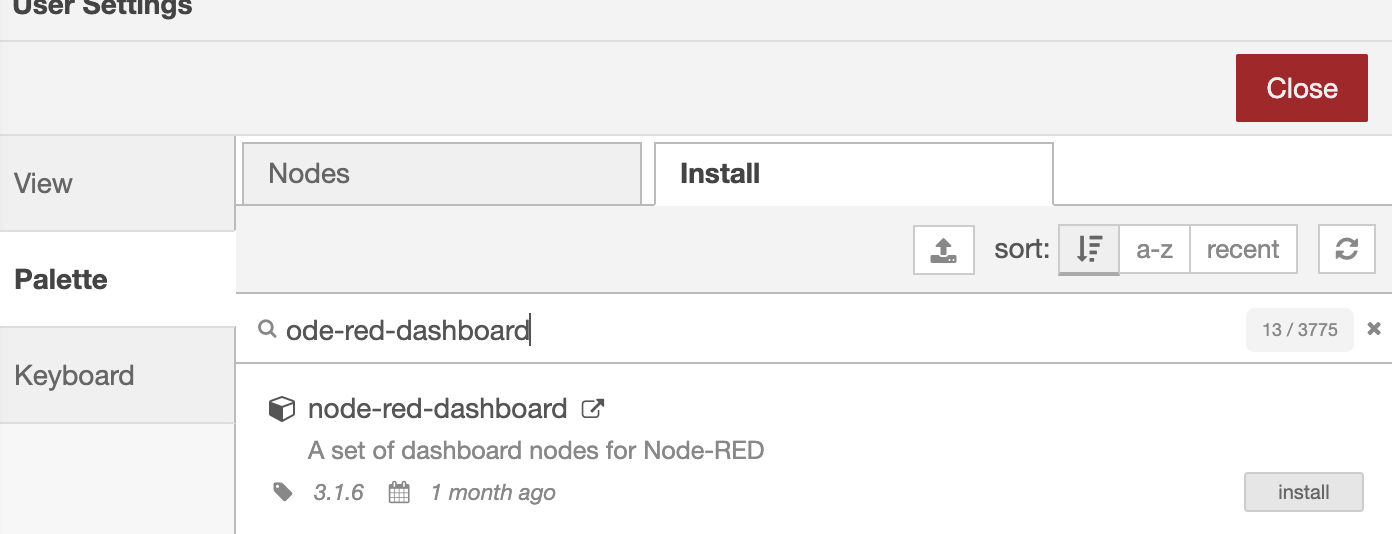
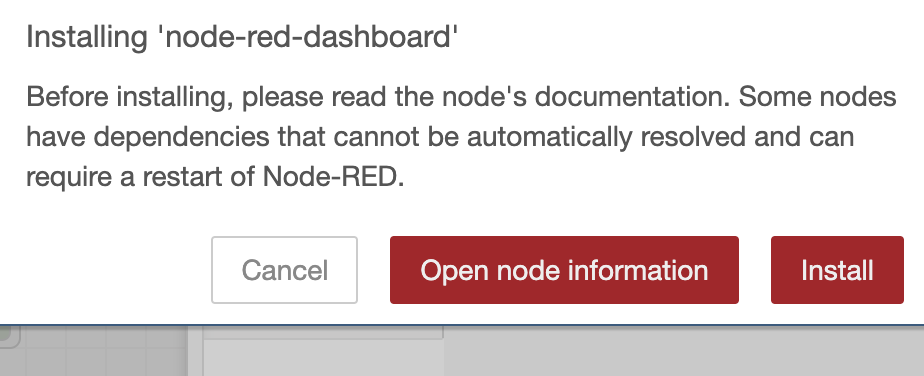
This is what we are going to build

Now in the top left, type iot in the search
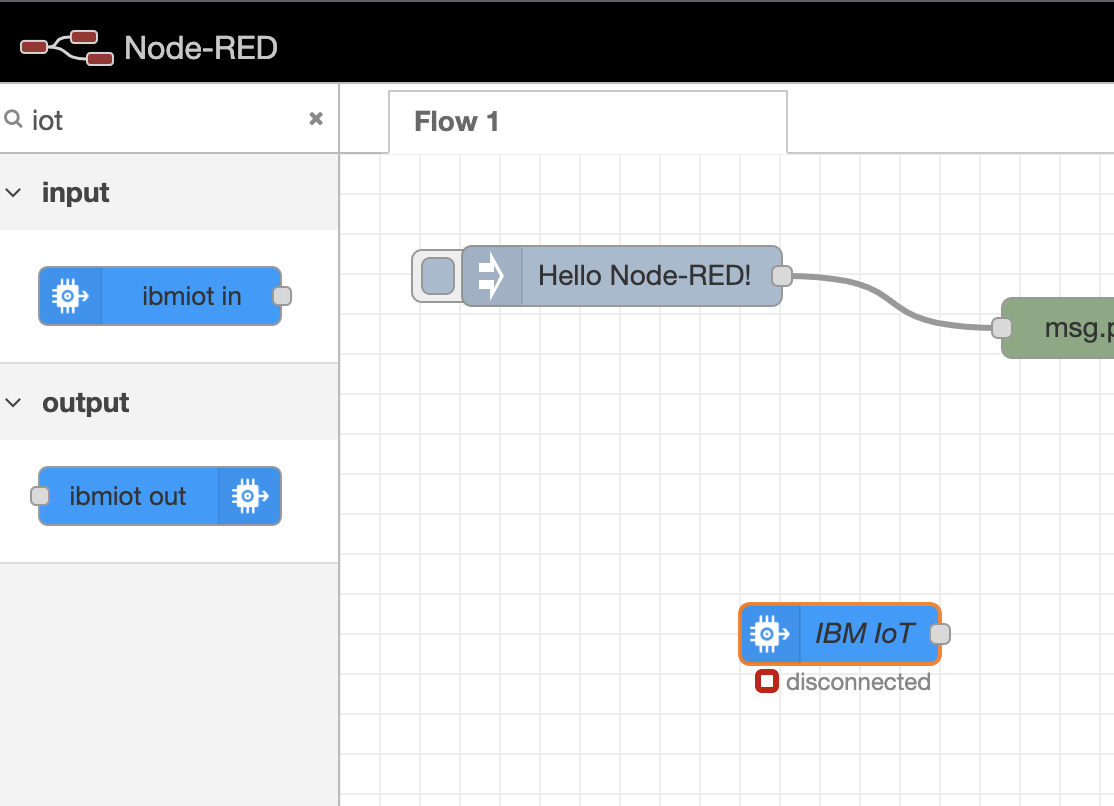
drag and drop in the flow, and click in it
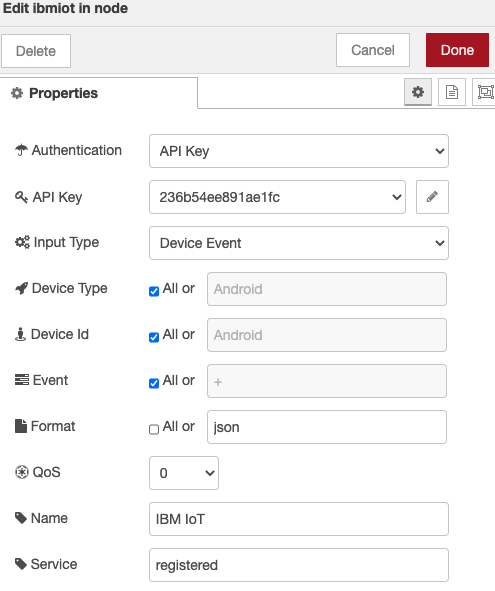
Select api key in authentication and clik in the pencil at the right of api key
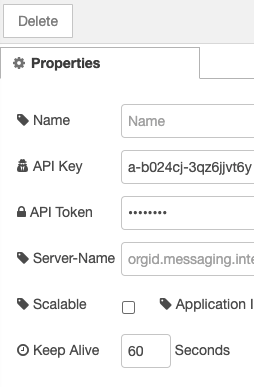
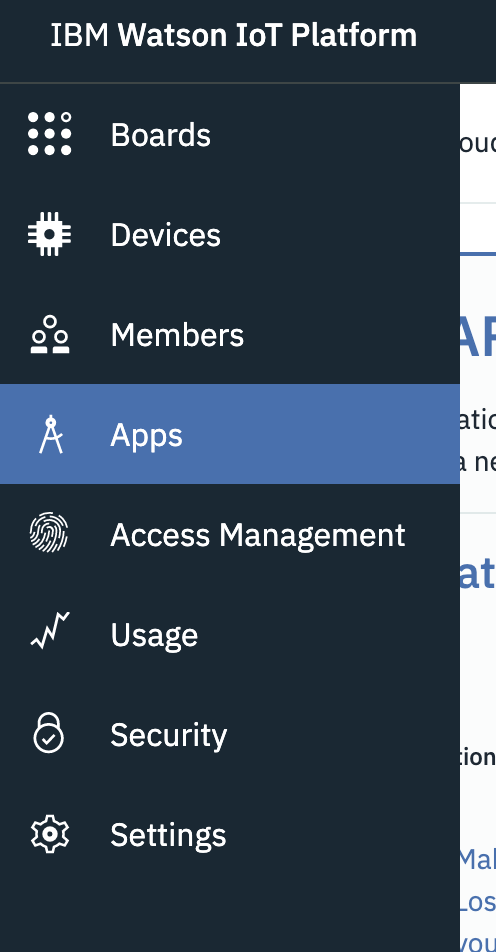
We will need gather all this values from the IoT Plaform, in the Apps label
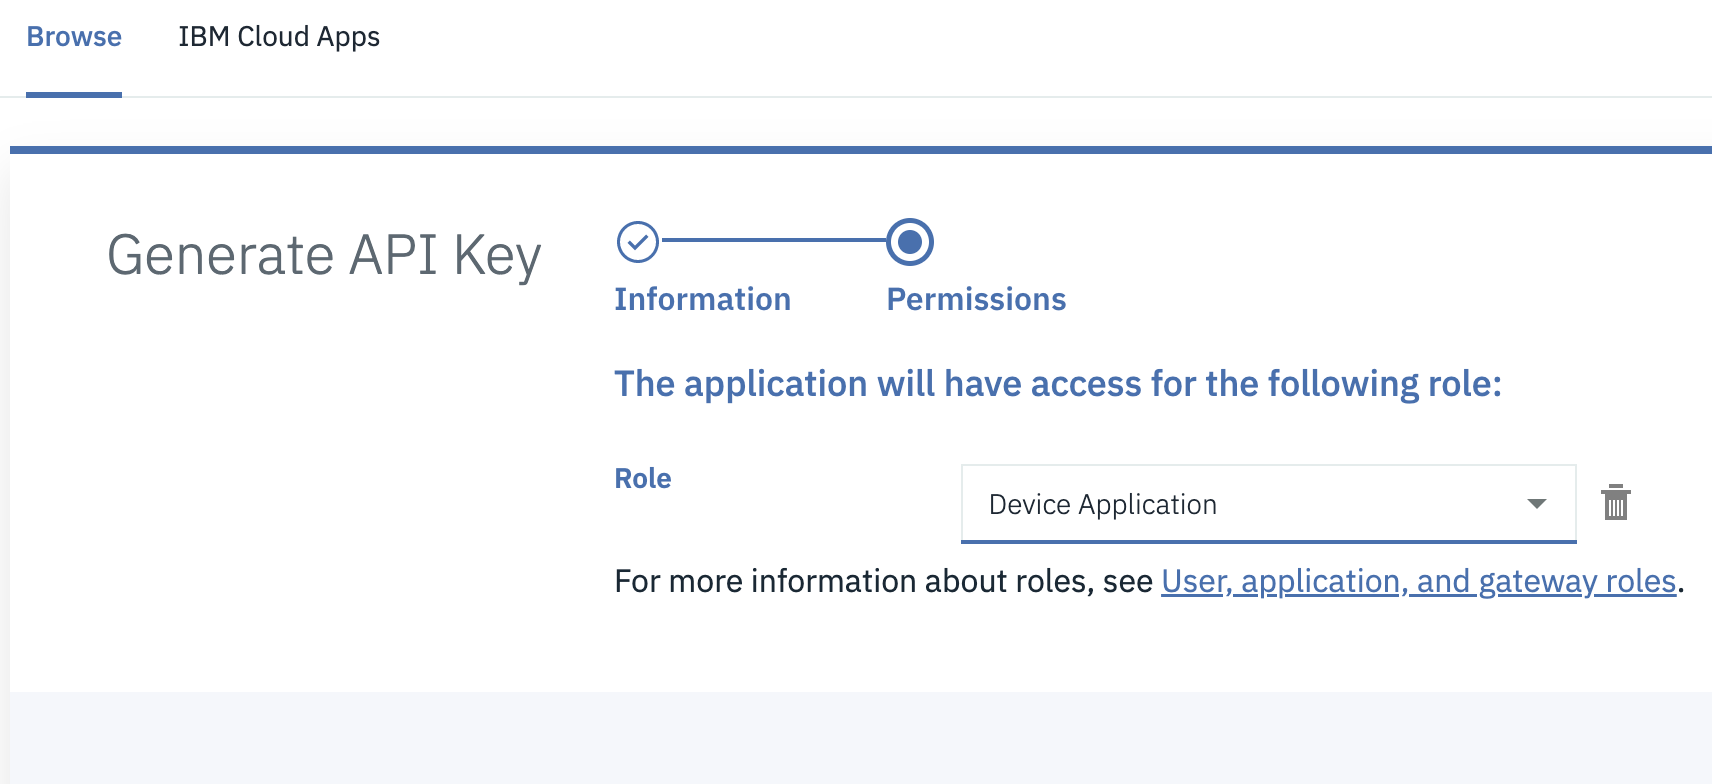
Click on generate API Key
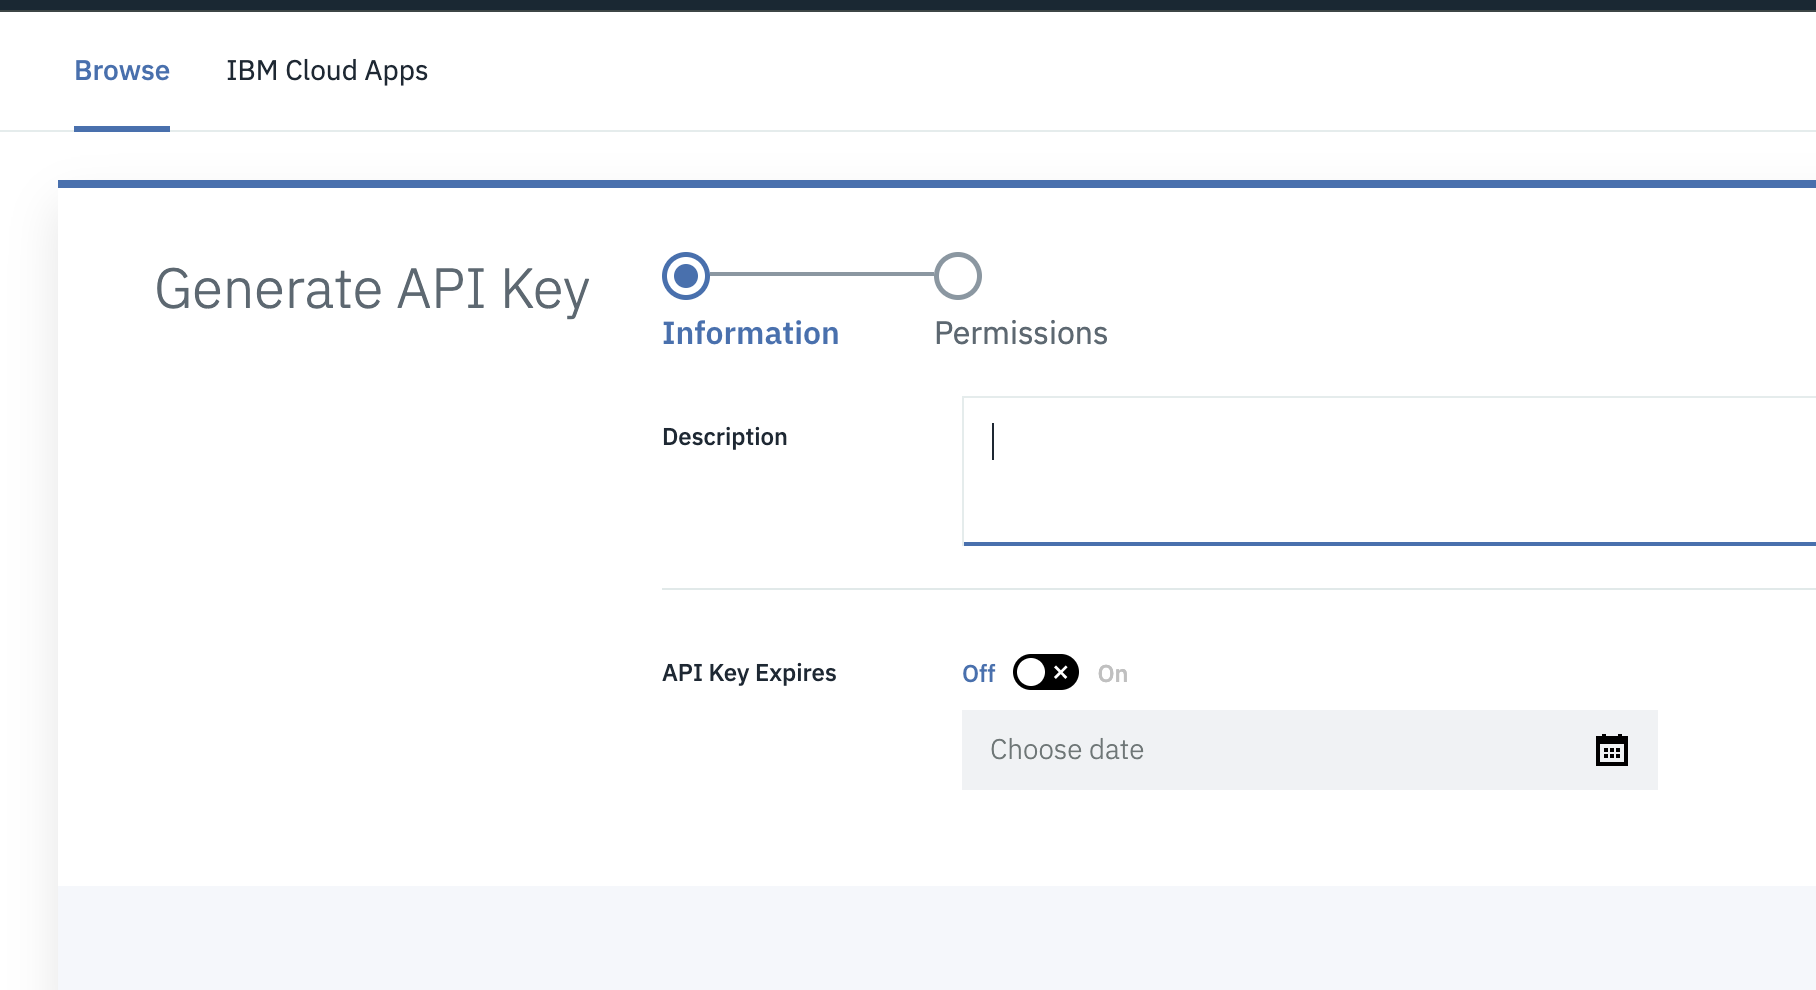
Choose Device Application and click on generate key
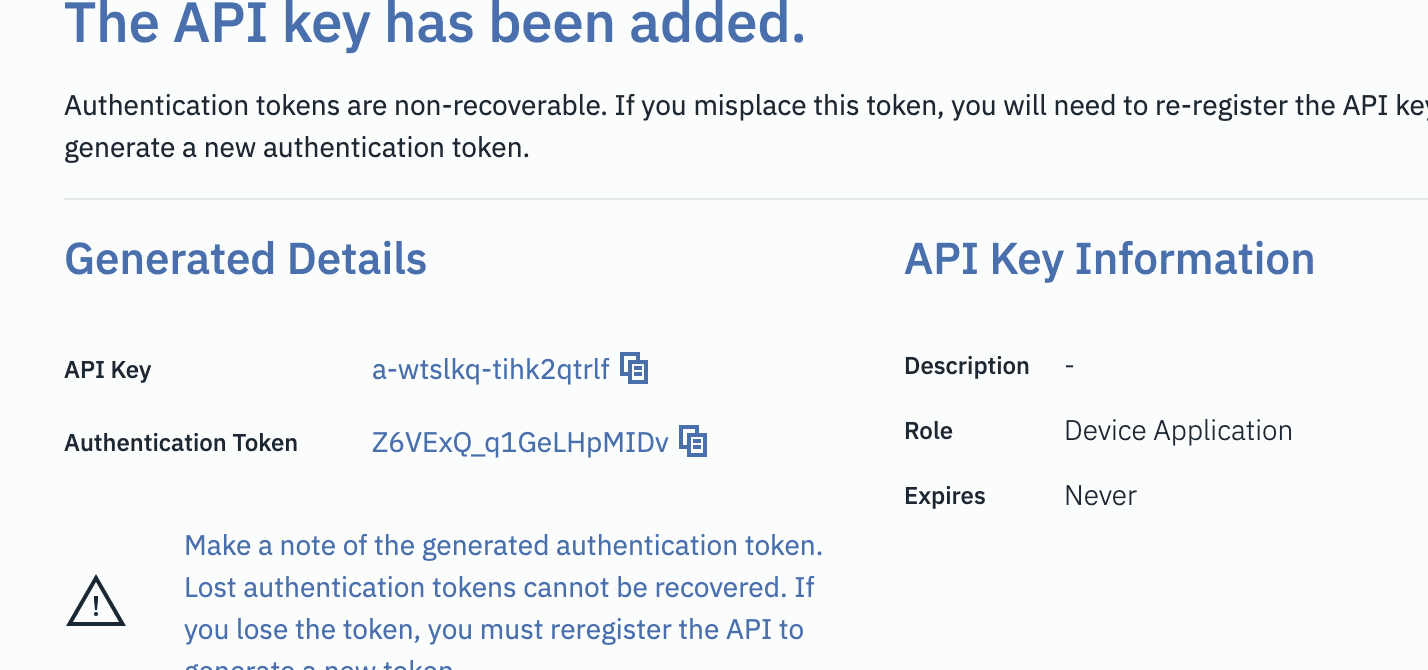
And here you have both Api Key and token. Be care as you would not be able to recover it later, copy it.
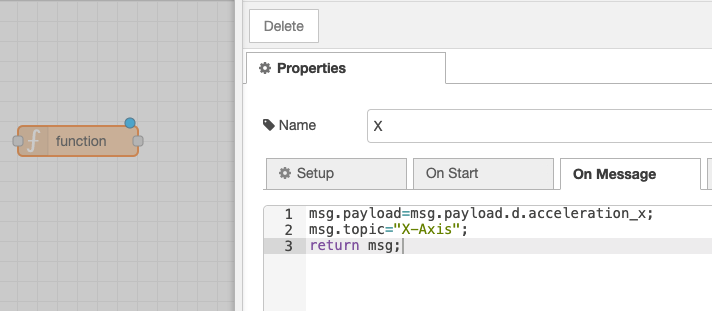
Now add a function node and include this code (for the X value)
msg.payload=msg.payload.d.acceleration_x; msg.topic="X-Axis"; return msg;
and do the same for Y and Z
msg.payload=msg.payload.d.acceleration_y; msg.topic="y-Axis"; return msg;
msg.payload=msg.payload.d.acceleration_z; msg.topic="z-Axis"; return msg;
and just to finish we will add the chart node
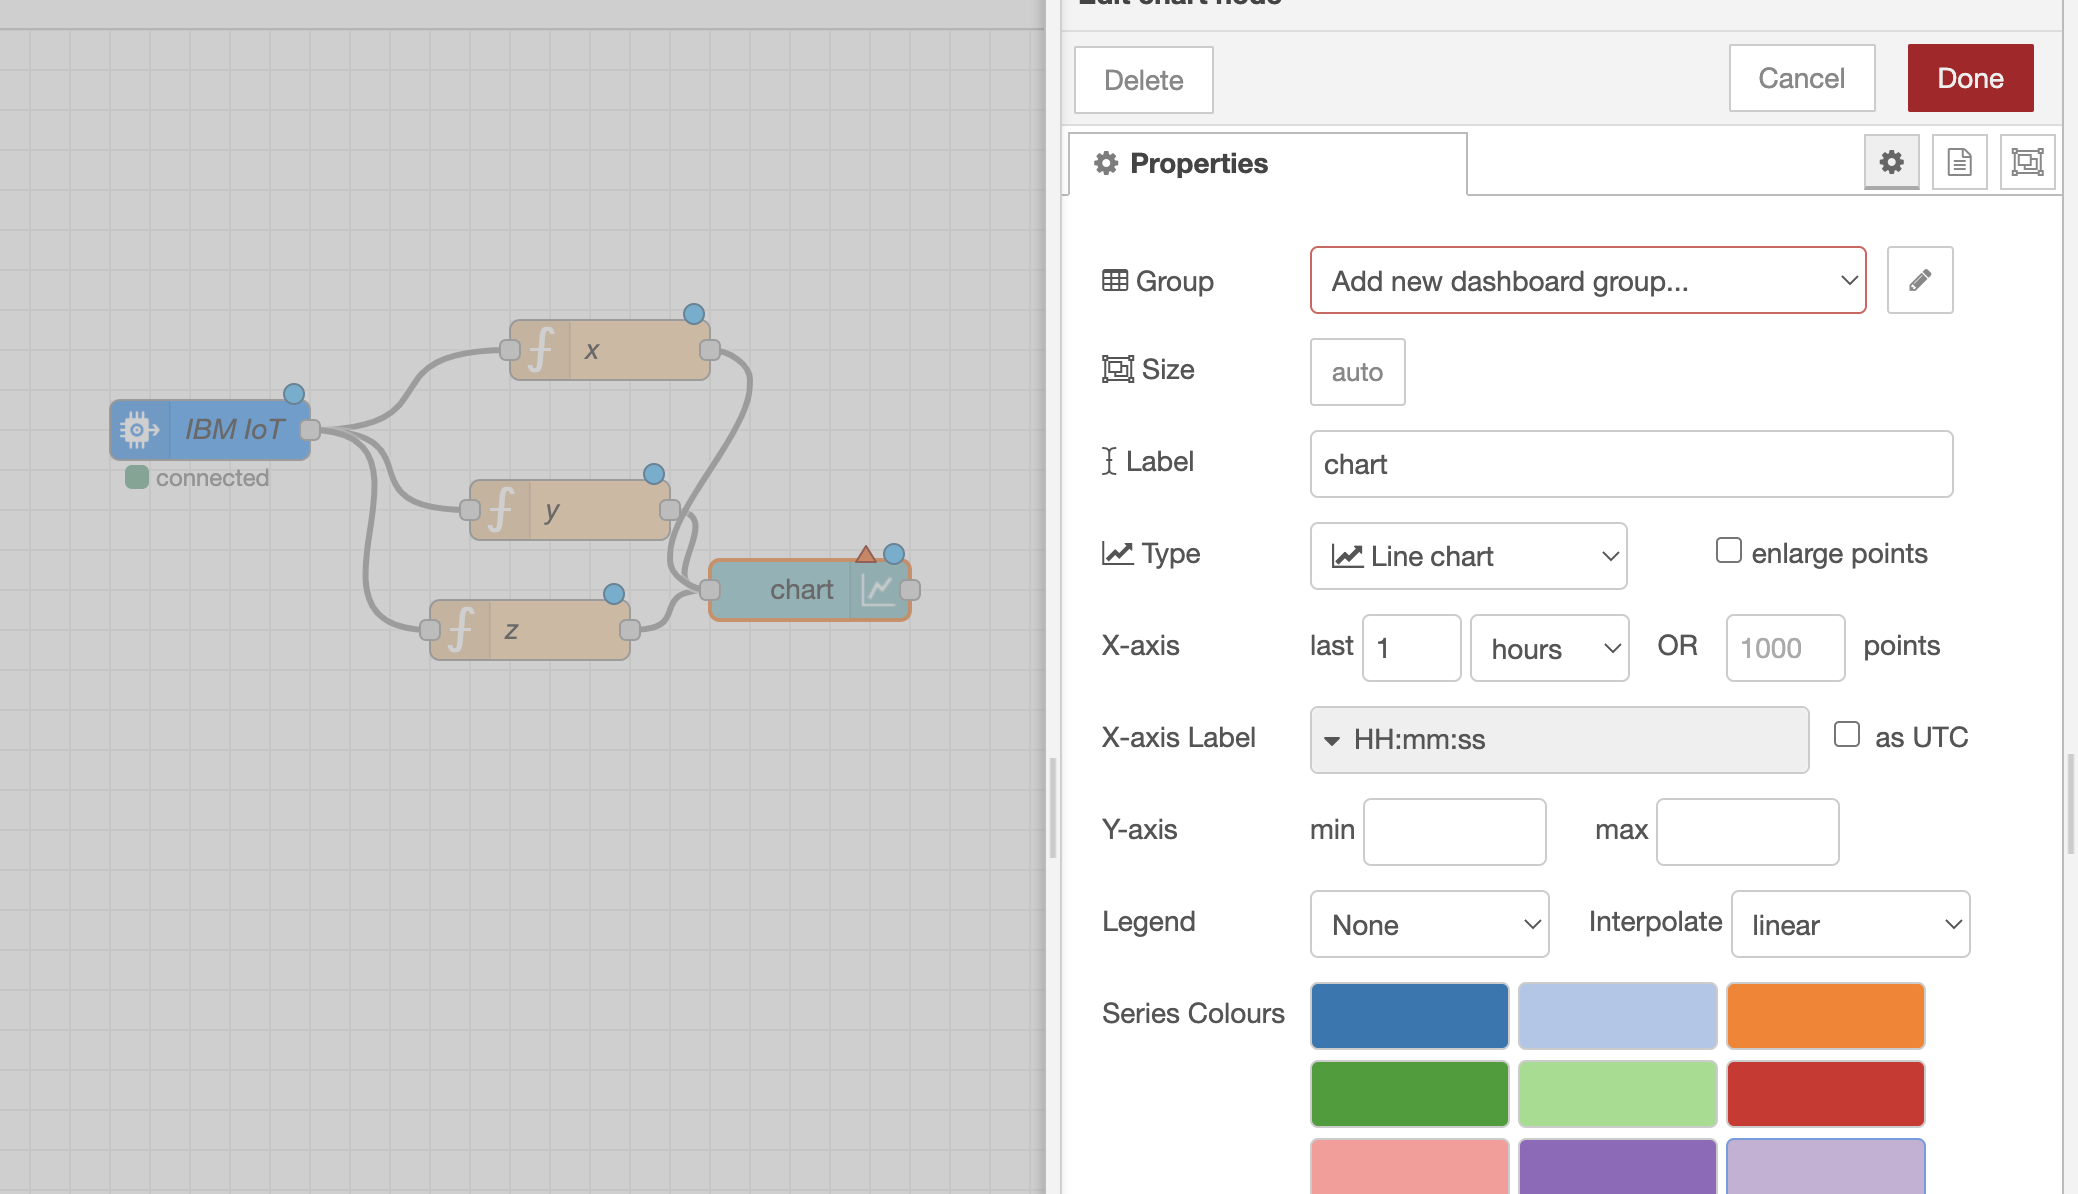
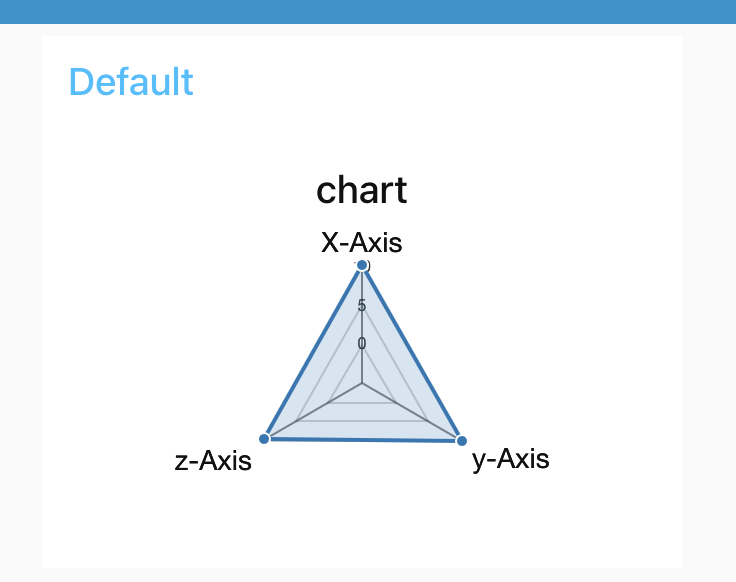
We need add a dashboard group (just click add and done) select the kind of graph that could help, for instance radar
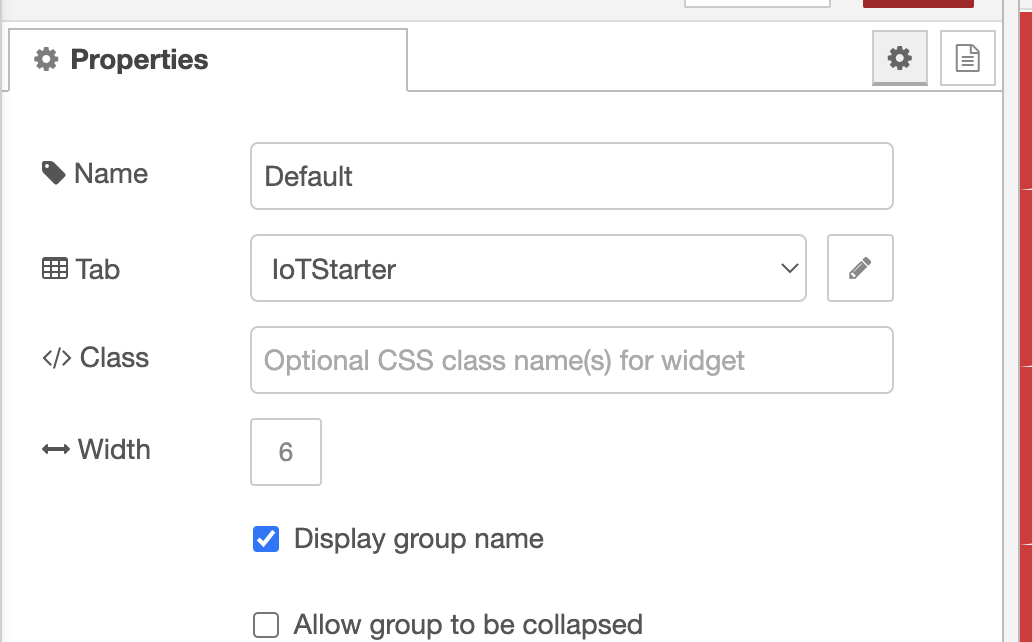
and use a url like this (the ip and the port of node red slash "ui"
9.51.206.182:31696/ui