A Home Assistant Lovelace custom card for displaying solar energy forecast data supplied by any forecasting integration, with simple setup for use with the Volcast, Solcast, Forecast.Solar, and Open-Meteo Solar Forecast integrations by selecting the relevant device in the card configuration to allow the auto-mapping of daily forecast entities.
This card is provided completely free of charge, but if you want to support me or just say thanks by buying me a coffee, that would mean so much!

- Open HACS in your Home Assistant instance.
- Click on the ⋮ button on the top right and select Custom repositories*
- Enter the below in the Repository field
https://github.com/AshGSmith/solar-forecast-card- Select Dashboard as the Type and Add.
- Search for Solar Forecast Card and install it.
- Reload your browser.
- Download
solar-forecast-card.jsfrom the latest release. - Copy it to your
config/www/folder (e.g.config/www/solar-forecast-card.js). - In Home Assistant, go to Settings → Dashboards → Resources and add:
- URL:
/local/solar-forecast-card.js - Resource type: JavaScript module
- URL:
- Reload your browser.
Add the card to a dashboard using the card picker, or add it manually in YAML:
type: custom:solar-forecast-card
title: Solar Forecast          # optional — defaults to "Solar Forecast"
icon: mdi:solar-power          # optional — defaults to mdi:solar-power
show_header: true              # optional — defaults to true
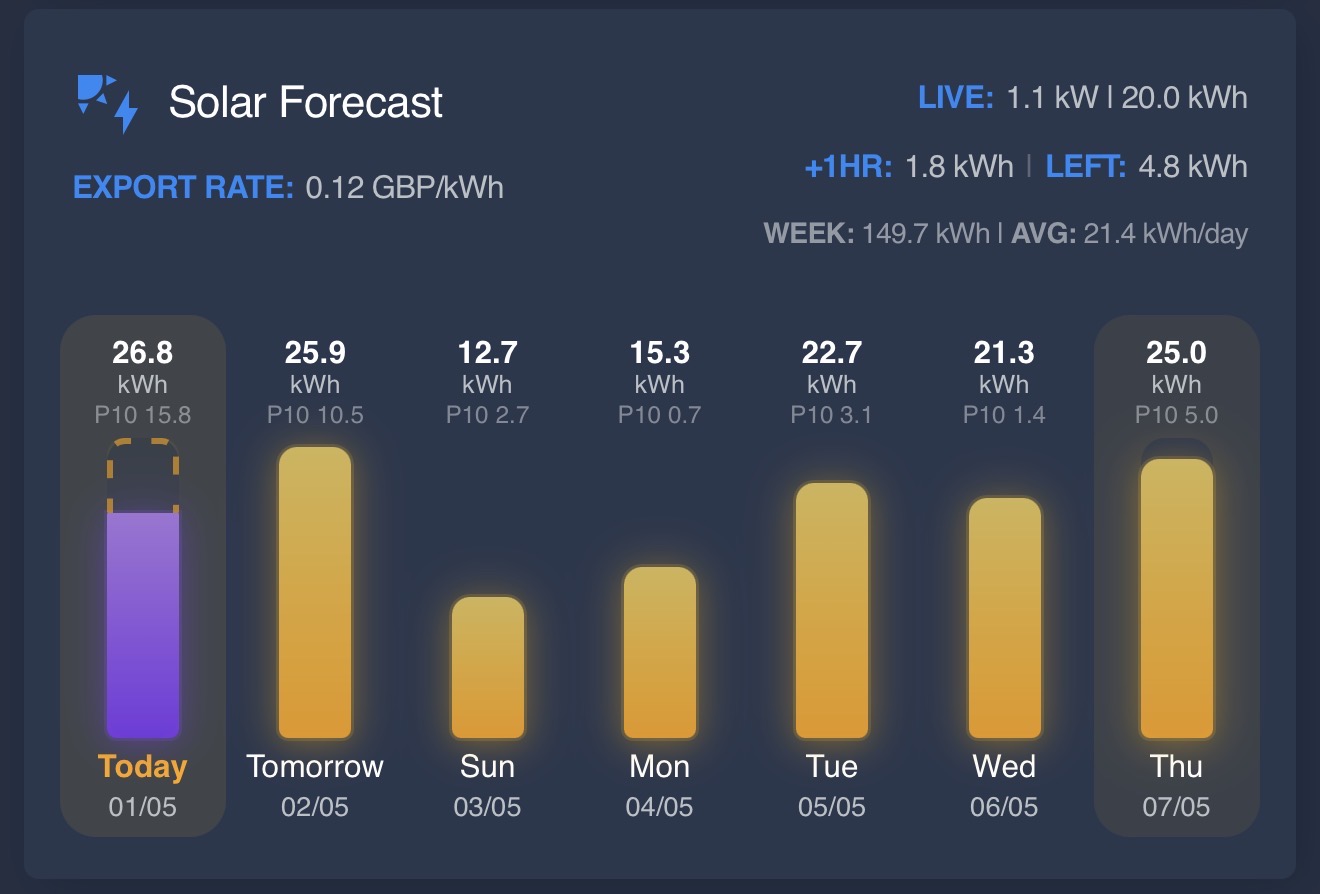
display_estimate10: false      # optional — Solcast only, shows P10 forecast values
show_hourly_as_main: false     # optional — show today's hourly forecast as the main card view
device_id: <your_device_id>    # optional — auto-detects forecast entities
forecast_entities:
  - sensor.forecast_today
  - sensor.forecast_tomorrow
  - sensor.forecast_day_3
  - sensor.forecast_day_4
  - sensor.forecast_day_5
  - sensor.forecast_day_6
  - sensor.forecast_day_7
live_power_entity: sensor.solar_power_now
today_actual_entity: sensor.solar_energy_today
export_rate_entity: sensor.current_export_rate
next_hour_entity: sensor.solar_forecast_next_hour
remaining_today_entity: sensor.solar_forecast_remaining_today
actual_arrays:
  - entity: sensor.solar_east_array_energy_today
    label: E
  - entity: sensor.solar_west_array_energy_today
    label: W
inverter_max_kw: 5.0
solar_max_kwp: 4.2
desktop_text_scale: 100
low_threshold: 10
high_threshold: 30| Option | Type | Required | Default | Description |
|---|---|---|---|---|
type |
string | yes | — | Must be custom:solar-forecast-card |
title |
string | no | Solar Forecast |
Text displayed in the card header |
icon |
string | no | mdi:solar-power |
MDI icon shown to the left of the title (e.g. mdi:solar-power-variant) |
show_header |
boolean | no | true |
Show or hide the card header, including the title and live data badge |
display_estimate10 |
boolean | no | false |
When enabled with the Solcast integration, shows a secondary P10 (10th-percentile) forecast value below each day's main forecast total |
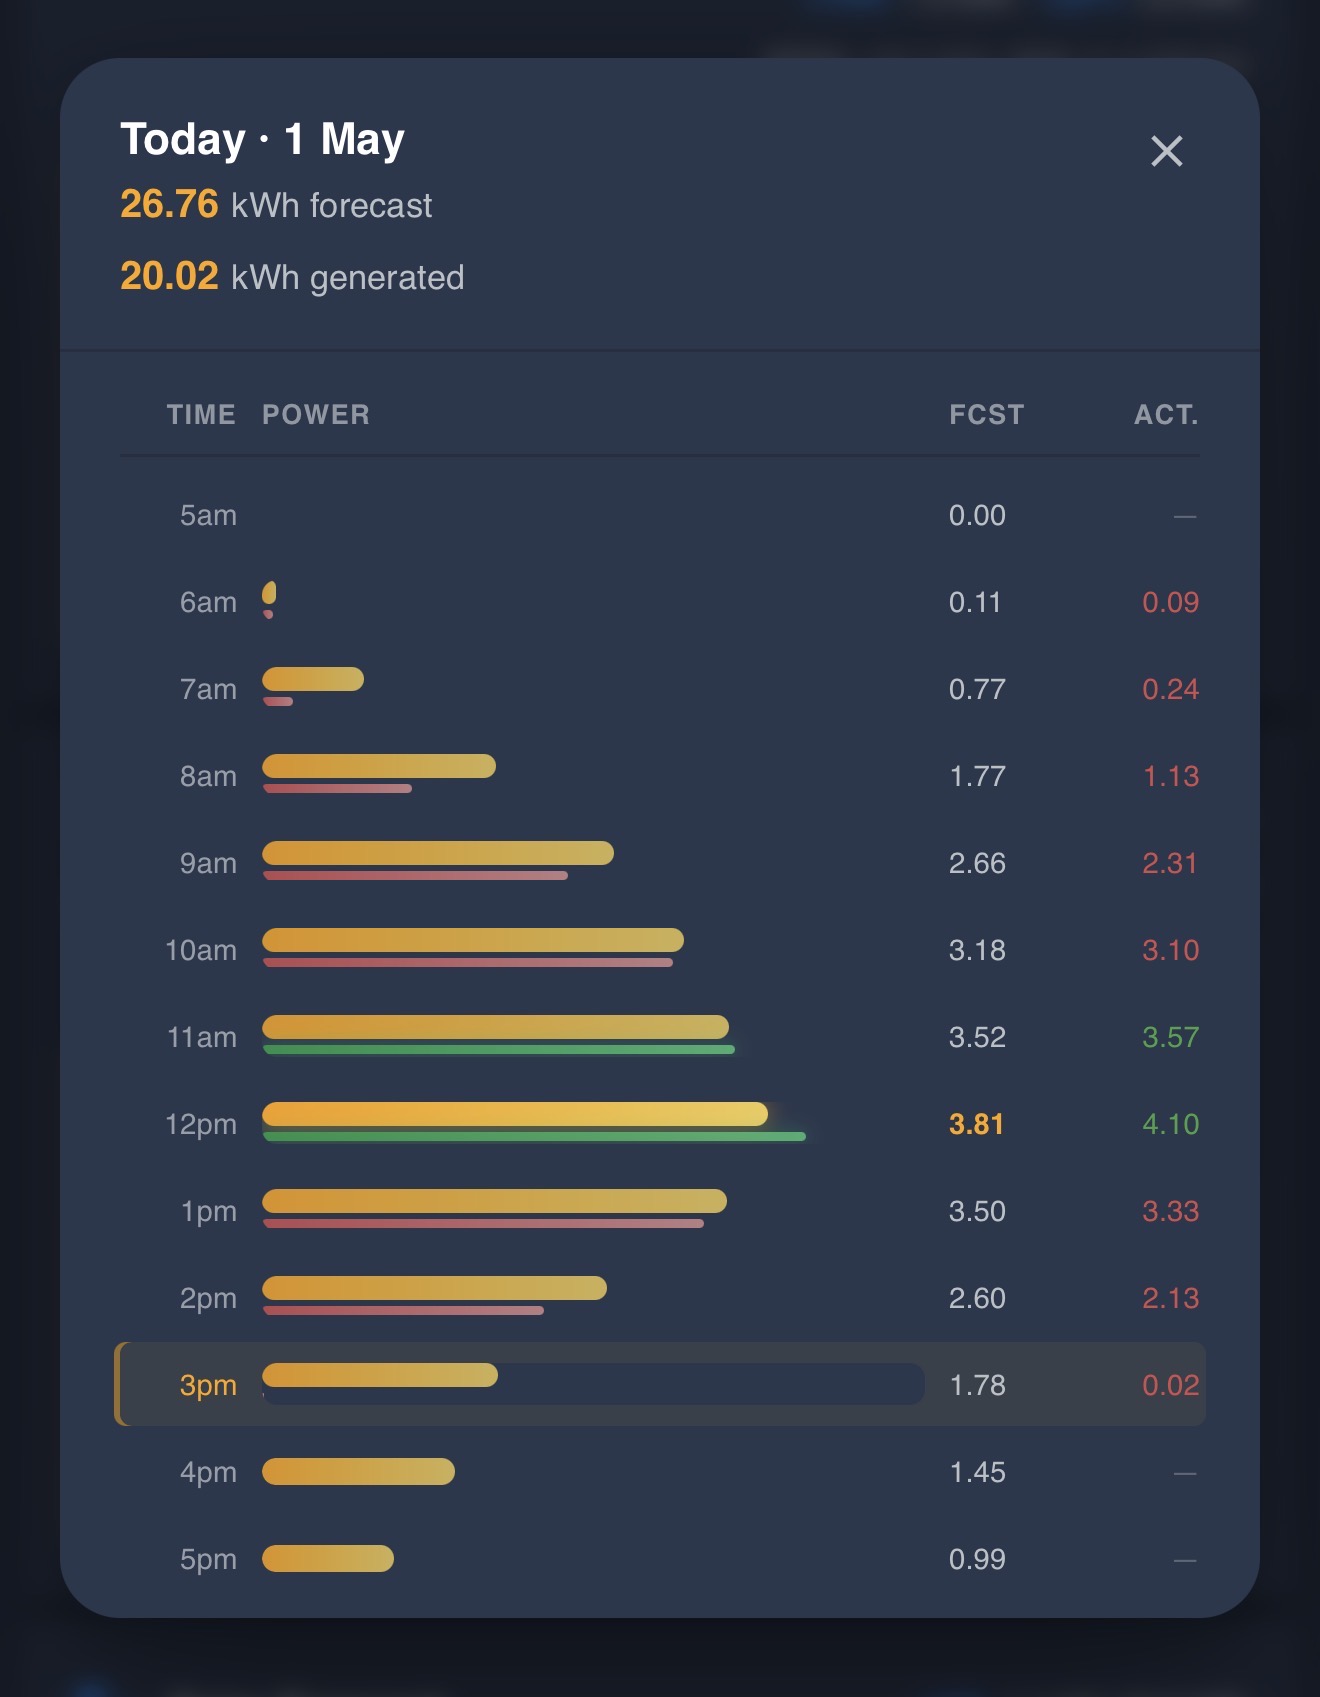
Clicking a daily forecast column opens an hourly popup when hourly data is available from the configured integration. The popup reuses the same hourly data normalisation across Volcast, Solcast, Forecast.Solar, and Open-Meteo Solar Forecast.
For today's forecast, the hourly popup can also compare actual generation against the forecast:
- Forecast generation remains the main hourly bar.
- Actual generation is shown as a slim comparison bar where actual history is available.
- The Actual value is softly coloured red, amber, or green depending on whether it is below, matching, or above the forecast value.
- The current hour is highlighted without changing row layout or value alignment.
Set show_hourly_as_main: true to display today's hourly forecast directly on the main card instead of the 7-day daily forecast bars.
| Option | Type | Required | Default | Description |
|---|---|---|---|---|
device_id |
string | no | — | Home Assistant device ID. When set, forecast entities are auto-detected from the device. Supports Volcast, Solcast, Forecast.Solar, and Open-Meteo Solar Forecast integrations |
forecast_entities |
list | yes | — | Exactly 7 sensor entity IDs representing Day 1 (today) through Day 7. Each sensor must expose a numeric state (kWh) and, for hourly popup support, an hours or wh_period attribute |
| Option | Type | Required | Default | Description |
|---|---|---|---|---|
live_power_entity |
string | no | — | Sensor reporting current solar output. Accepts W or kW (detected via unit_of_measurement). Displayed in the header as LIVE: X W or X.X kW |
today_actual_entity |
string | no | — | Sensor reporting total energy generated today (kWh or Wh). Used as the actual generation source when no actual_arrays are configured. Shown in the header and used to render the actual generation bar on today's column |
next_hour_entity |
string | no | — | Sensor reporting forecast generation for the next full hour (kWh or Wh). When set, overrides the auto-derived +1HR header value. Auto-populated from the Solcast and Open-Meteo integrations where available |
remaining_today_entity |
string | no | — | Sensor reporting remaining forecast generation for today (kWh or Wh). When set, overrides the auto-derived LEFT header value. Auto-populated from the forecast.solar and Open-Meteo integrations |
export_rate_entity |
string | no | — | Sensor reporting the current energy export rate. When set, displays EXPORT RATE: X unit in the card header below the title |
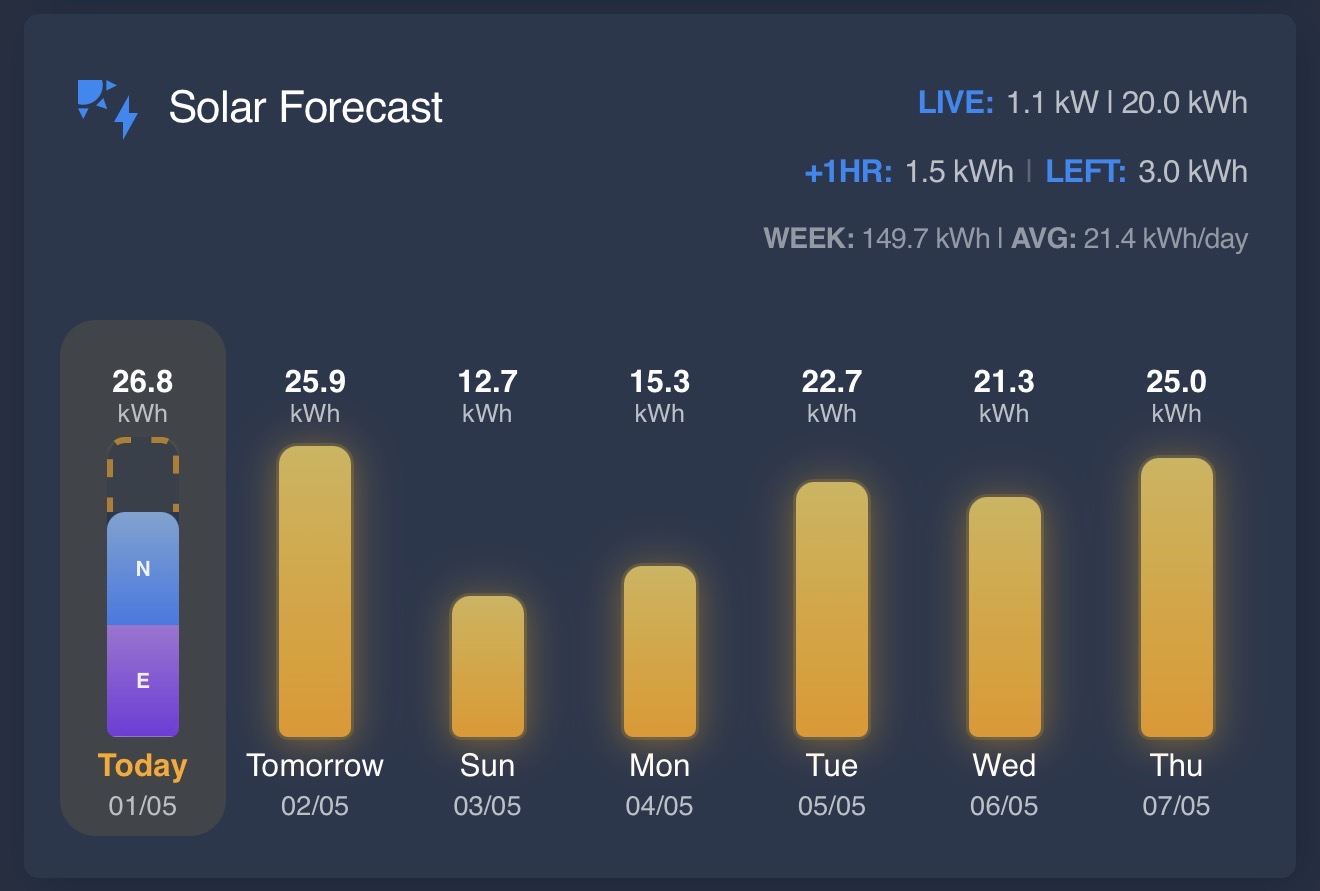
The actual_arrays option lets you configure individual per-array energy sensors to display a proportional stacked breakdown on today's actual-generation bar. When two or more arrays are producing, the bar is divided into coloured segments sized in proportion to each array's output. The card header and the hourly popup both show a per-array breakdown alongside the overall total.
This field is entirely optional. When omitted, the card behaves exactly as in previous versions.
| Option | Type | Required | Default | Description |
|---|---|---|---|---|
actual_arrays |
list | no | — | List of per-array sensor entries. When configured, array totals are always used in preference to today_actual_entity for the actual generation display |
Each entry in actual_arrays:
| Field | Type | Required | Description |
|---|---|---|---|
entity |
string | yes | Sensor entity reporting energy generated by this array today. Accepts kWh or Wh (detected via unit_of_measurement) |
label |
string | yes | Single character shown inside the segment on the bar and in the popup header (e.g. N, S, E, W) |
Example:
actual_arrays:
  - entity: sensor.solar_east_array_energy_today
    label: E
  - entity: sensor.solar_west_array_energy_today
    label: W
Behaviour notes:
- When arrays are configured, their sum is used as the actual generation total in the card header and bar.
today_actual_entityis not used for display when arrays are present. - The stacked bar activates when 2 or more arrays are producing. A single active array uses the standard single-colour bar.
- If all array sensors read zero (e.g. pre-sunrise) or are unavailable, the bar falls back to
today_actual_entityfor its height. The header will show0.0 kWhfrom the arrays. - Each segment is drawn from an 8-slot colour palette (purple, blue, indigo, slate-blue, violet, emerald, periwinkle, steel) and shows its label when the segment is tall enough to fit it.
- Arrays are configured manually in the visual editor via the Actual Generation Arrays expansion panel.
| Option | Type | Required | Default | Description |
|---|---|---|---|---|
inverter_max_kw |
number | no | — | Inverter maximum continuous output in kW. Used as the ceiling for hourly popup bar scaling when the solar array is at or above this value |
solar_max_kwp |
number | no | — | Solar array peak capacity in kWp. Used as the hourly graph ceiling when smaller than inverter_max_kw. If neither system value is set, bars scale relative to the day's peak hour |
| Option | Type | Required | Default | Description |
|---|---|---|---|---|
show_hourly_as_main |
boolean | no | false |
Display today's hourly forecast view directly on the main card instead of the daily forecast bars |
desktop_text_scale |
number | no | 100 |
Scales card text on wider screens only. Accepts values from 100 to 150 in the visual editor; mobile sizing is unchanged |
font_size |
number | no | — | Optional daily forecast value and day/date label size in pixels. Leave unset to use CSS/default styling |
bar_width |
number | no | — | Optional daily forecast bar width in pixels. Leave unset to use CSS/default styling |
The card follows the active Home Assistant frontend language where a locale is available, with English used as the fallback for any missing translation. Date labels, time labels, and number formatting follow the Home Assistant frontend locale and time settings for the current user.
To change how dates and times are shown in the card, update your Home Assistant user/browser preferences:
- Open Home Assistant.
- Select your user profile.
- Update the language, number format, time format, or related locale settings.
- Refresh the dashboard if the card does not update immediately.
Bar colours change based on each day's forecast total. When neither threshold is set all bars use the default amber colour.
| Option | Type | Required | Default | Description |
|---|---|---|---|---|
low_threshold |
number | no | — | Days forecast below this value (kWh) are shown in a soft red/coral colour |
high_threshold |
number | no | — | Days forecast above this value (kWh) are shown in green |
The card exposes CSS custom properties for card-mod and theme-level styling while keeping the default appearance unchanged.
card_mod:
  style: |
    solar-forecast-card {
      --sfc-card-background: rgba(20, 20, 30, 0.8);
      --sfc-font-size: 14px;
      --sfc-bar-width: 18px;
      --sfc-actual-color: #a78bfa;
    }
Available variables:
| Variable | Area |
|---|---|
--sfc-card-background |
Main card background |
--sfc-card-border-radius |
Main card corner radius |
--sfc-card-padding |
Main card padding |
--sfc-card-box-shadow |
Main card shadow |
--sfc-title-color |
Header title colour |
--sfc-title-font-size |
Header title size |
--sfc-header-label-color |
Header label colour |
--sfc-header-value-color |
Header value colour |
--sfc-font-size |
Daily forecast values and day/date labels |
--sfc-bar-width |
Daily forecast bar width |
--sfc-bar-radius |
Daily forecast bar corner radius |
--sfc-low-color |
Low forecast bar background |
--sfc-average-color |
Average forecast bar background |
--sfc-high-color |
High forecast bar background |
--sfc-actual-color |
Actual generation bar background |
--sfc-popup-background |
Popup background |
--sfc-popup-border-radius |
Popup corner radius |
--sfc-popup-text-color |
Popup primary text colour |
--sfc-popup-accent-color |
Popup accent colour |
MIT