Repository navigation
Model Building
Since there were no clear correlations in the data, and that the number of predictors was vastly lesser than the sample size, the preliminary model chosen to find the best combination of predictors was the linear regression model. Firstly a simple linear model was trained which had all the predictors in the train dataset. The summary statistics for this revealed an RMSE of 44.61 and an adjusted R squared of 50%
This was disappointing so some interaction terms were added to the model. The summary statistics for that revealed an RMSE of 44.39 and an adjusted R squared of 51%. Not enough of an increment to warrant complicating the data.
Then a few non linear factors were added to the model to hopefully explain more of the deviation in the variance. This revealed an RMSE of 44.1 and an adjust R squared of 51.9%. Again barely any change so it was decided to keep the original multiple linear regression model without any of the interaction or the non linear terms because they were making no change to the performance of the model. Indicative of possible defects in the data collection or cleaning process or the data being faulty overall.
Once the variables were set, different models were chosen that could provide better performance to the simple linear model for the given dataset. They were trained with the caret package using a 5 fold cross validation.
-
Linear model The cross validated model performance: RMSE = 44.4 R squared = 50.92%
-
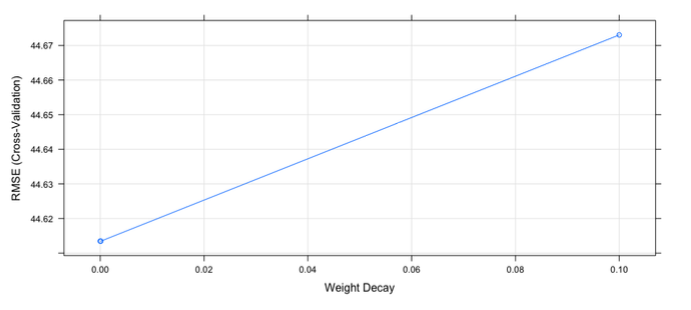
Ridge model RMSE = 44.5667 R squared = 50.84%
-
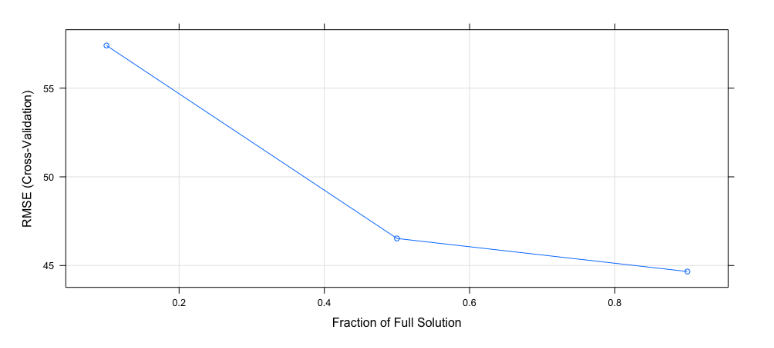
Lasso model The cross validated model performance: RMSE = 44.615 R squared = 50.92%
-
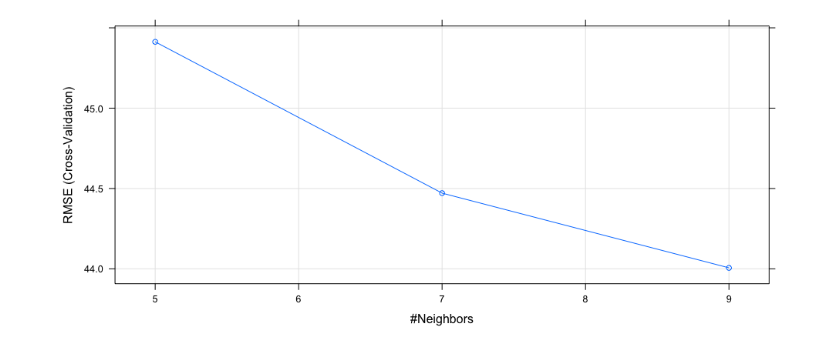
Knn model The cross validated model performance: RMSE = 39.33704 R squared = 52.54%
-
Random forest model The cross validated model performance: RMSE = 18.72349 R squared = 56.88%
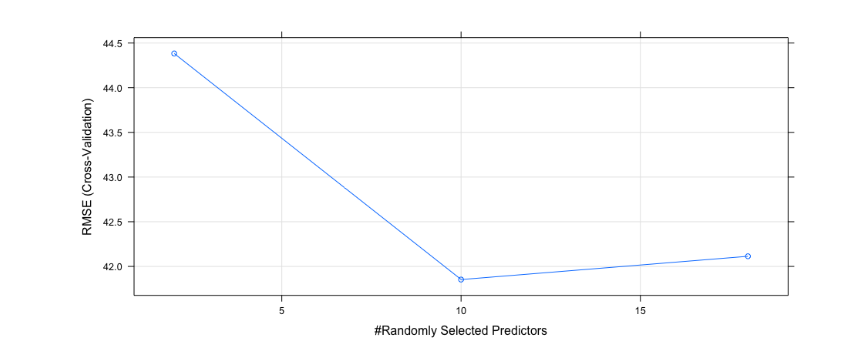
-
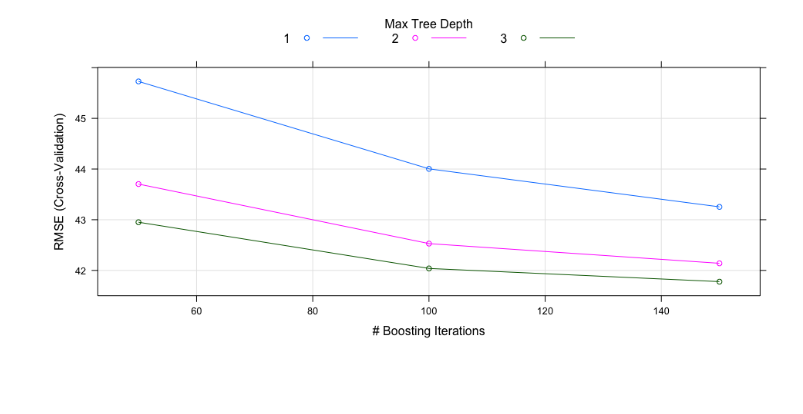
Boosting tree model The cross validated model performance: RMSE = 40.94233 R squared = 57.01%
-
Bagging tree model The cross validated model performance: RMSE = 45.142 R squared = 49.36%