Repository navigation
SARIMA Model
Seasonal Auto-Regressive Moving Average model has been used as the classical method of time series forecasting. Our approach is to find the best parameters of SARIMA based on maximum likelihood estimation criteria. Monthly CO2 concentration dataset have been used as an example. As can be seen this dataset has trend and seasonality which needs to be decomposed before using classical methods.
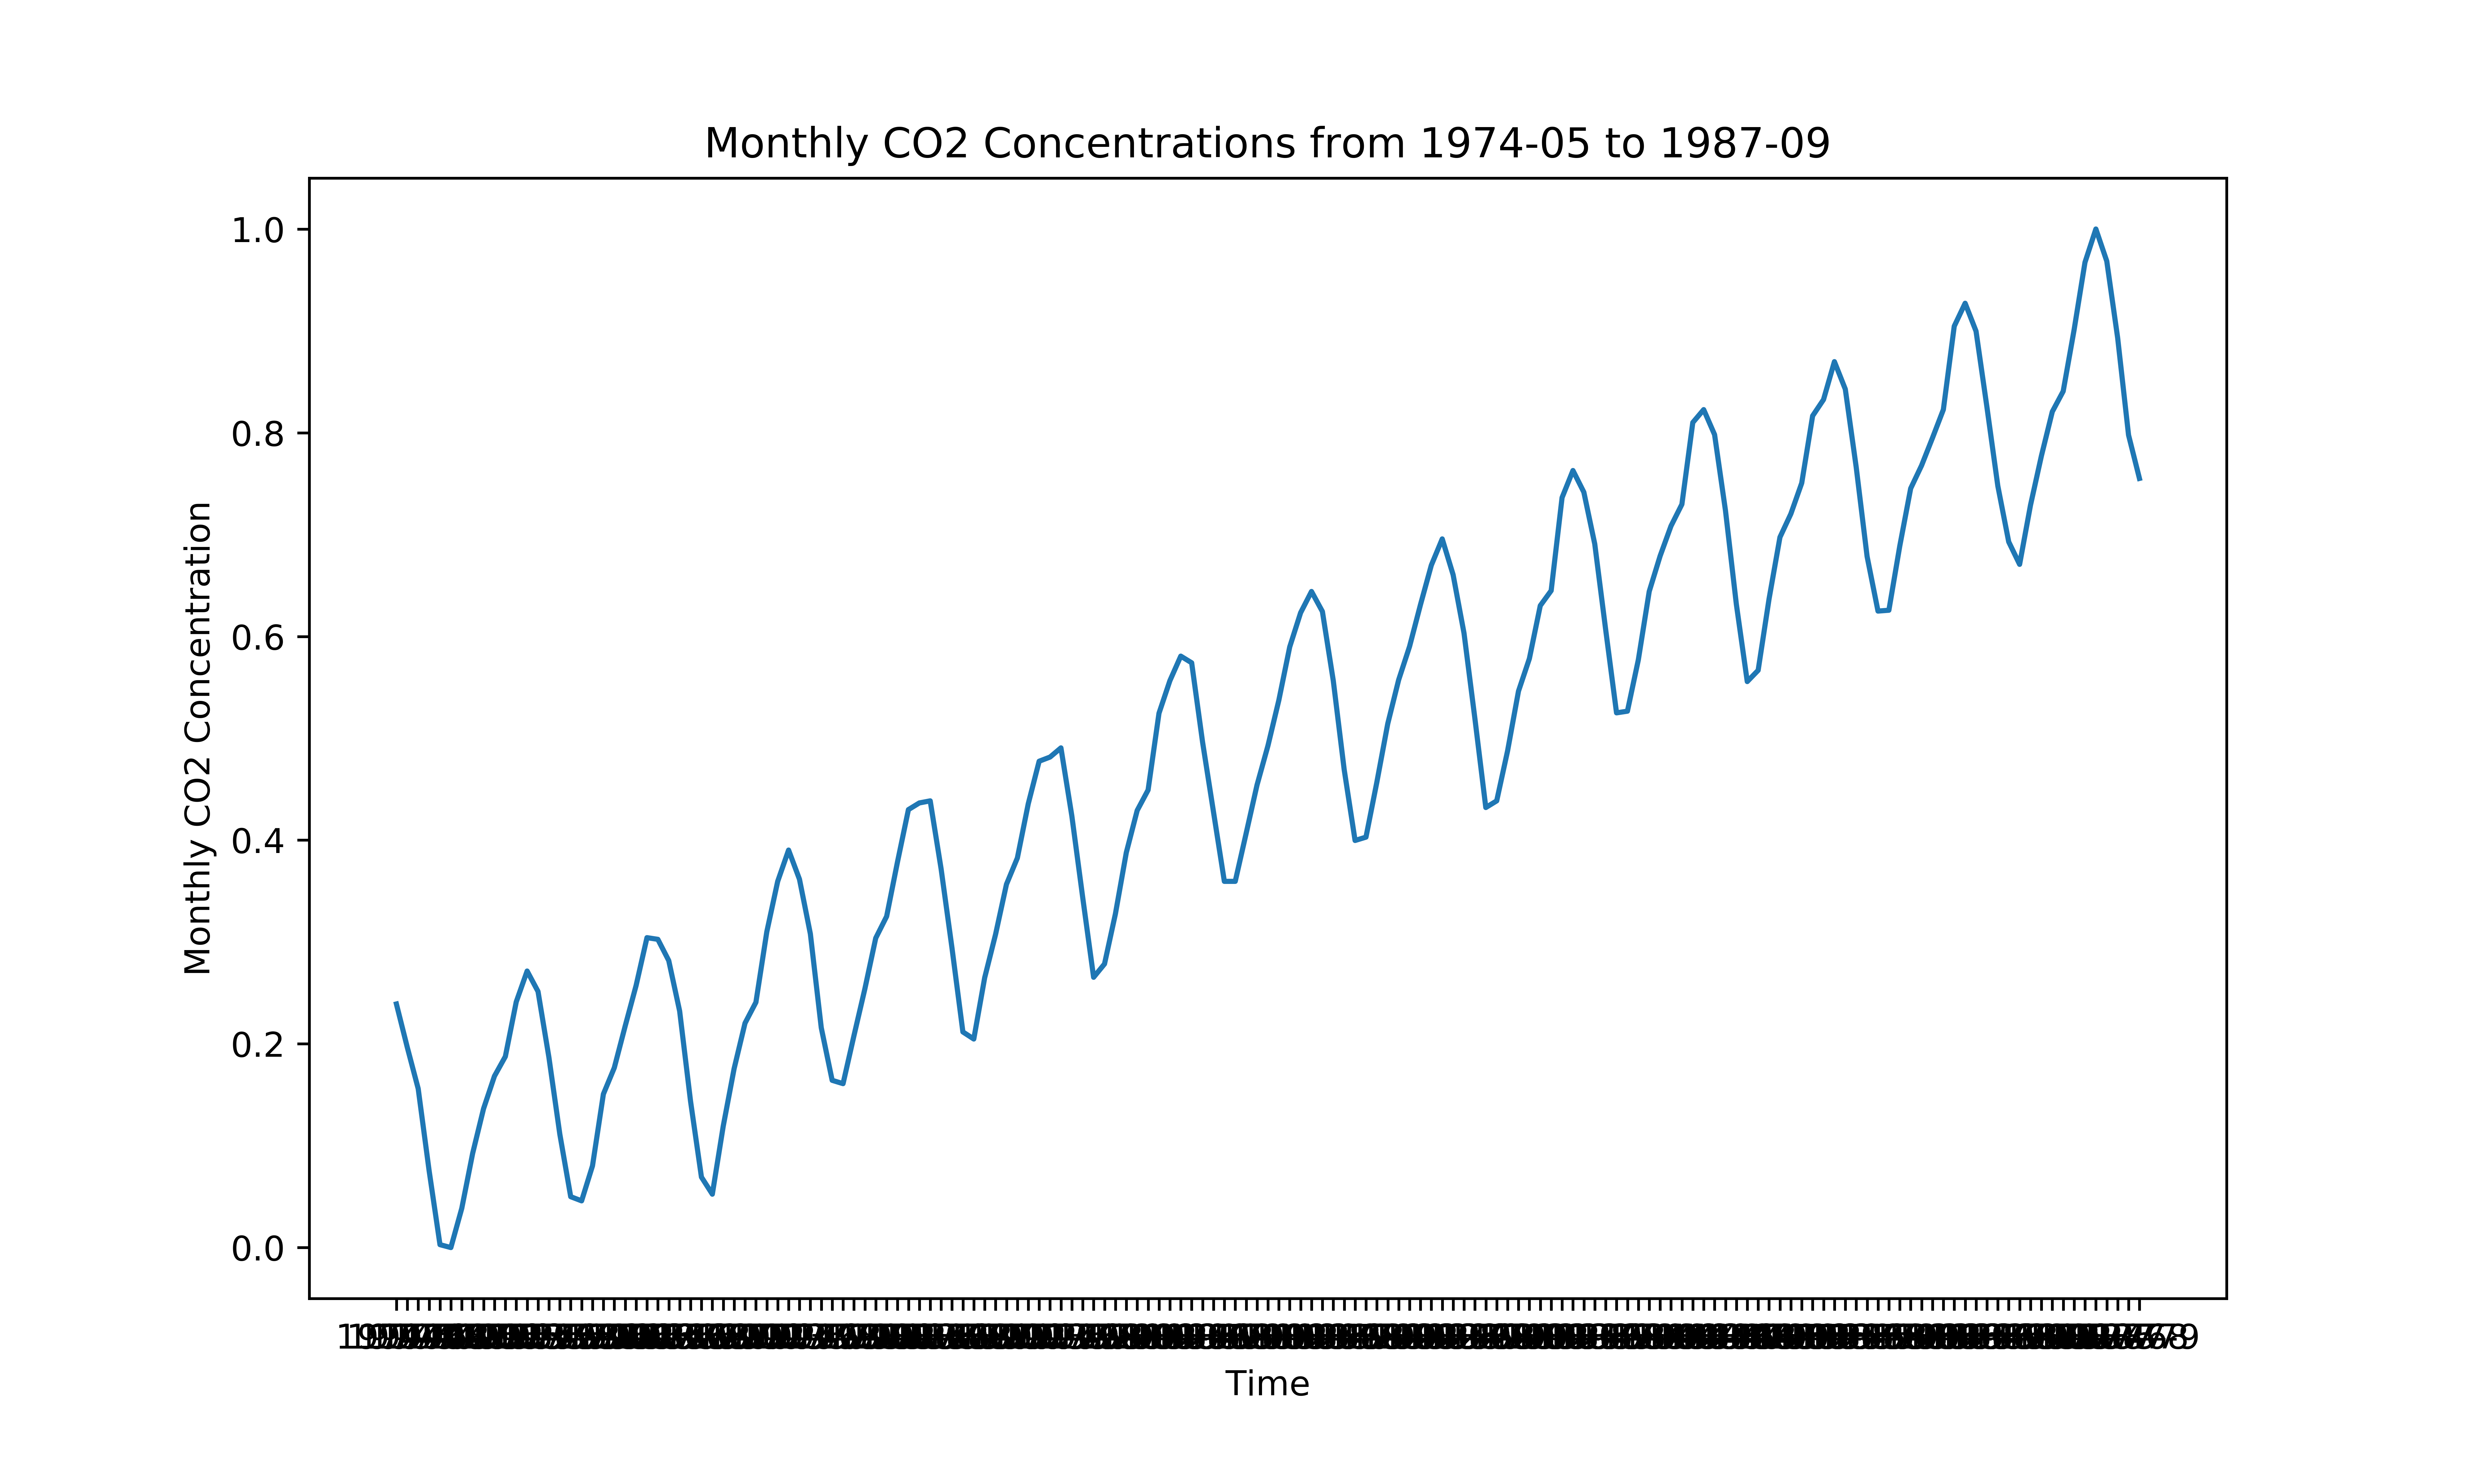
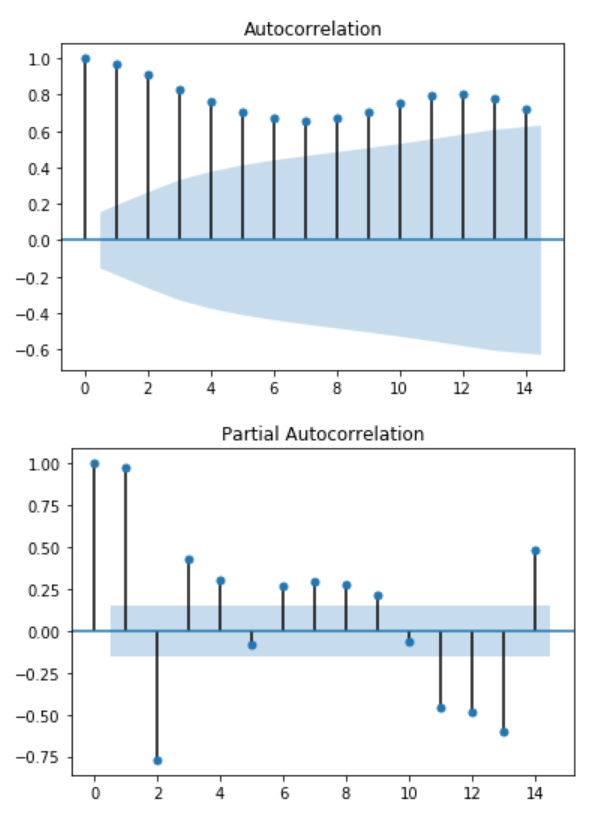
Auto-correlation and partial auto-correlation plots confirm that dataset is not stationary and has trend and seasonality.
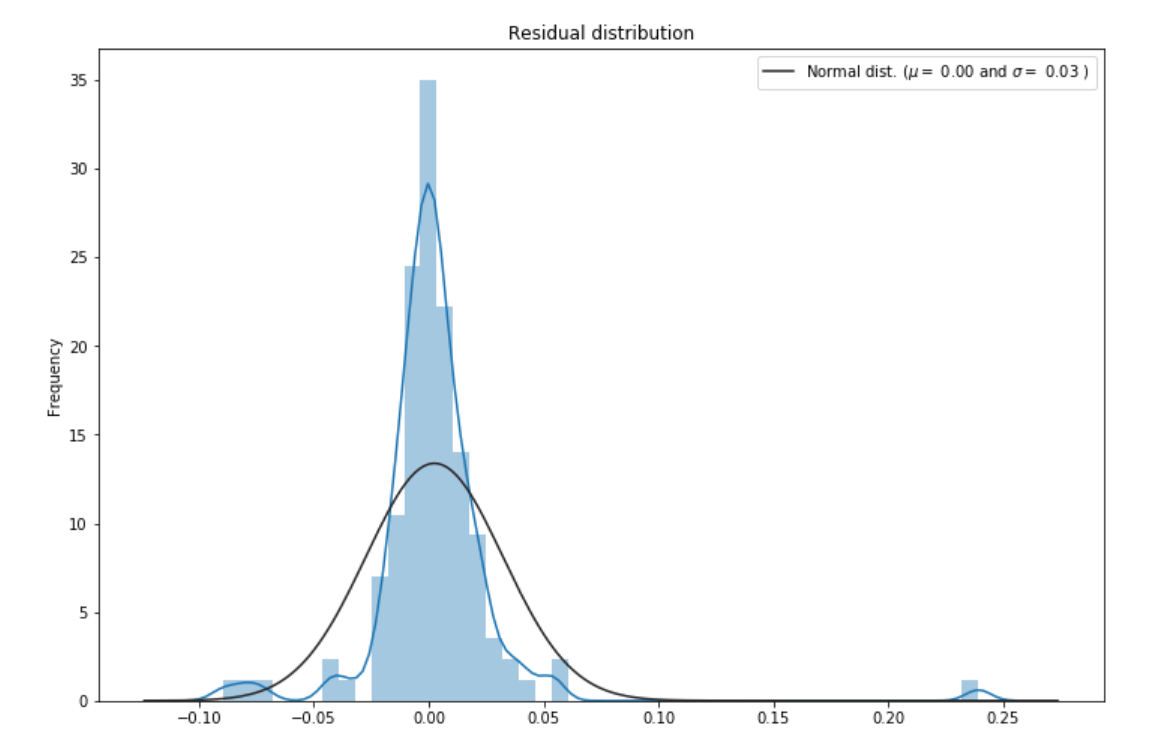
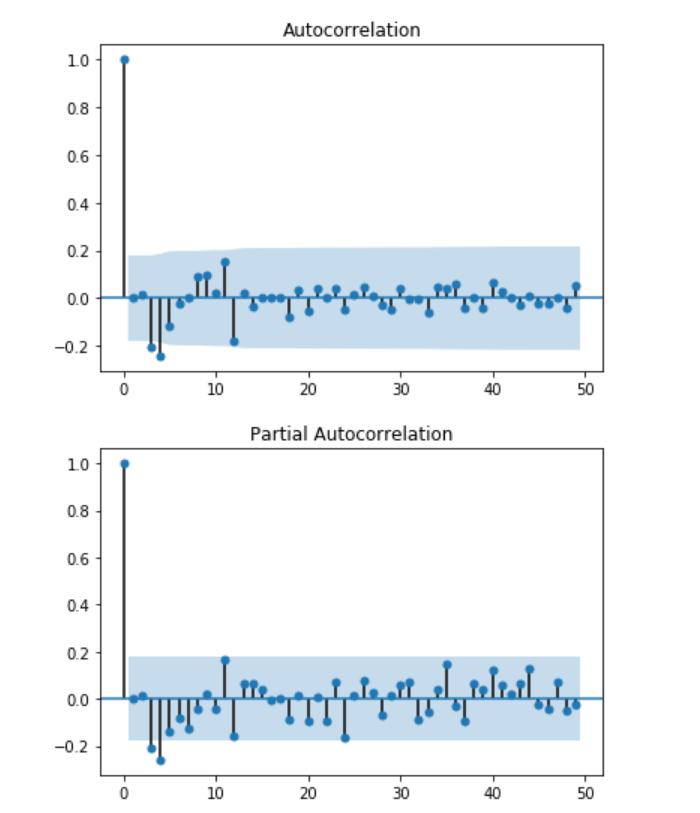
SARIMA(0,1,1)(1,1,1,12) has been chosen as the best fit among all other models based on maximum likelihood estimation. In the SARIMA model, (0,1,1) implies to the parameters of the trend component and (1,1,1,12) implies to the parameters of the seasonality component. Also seasonality can be found at lag 12. After fitting the model, the residuals will be stationary as the model has took the trend and seasonality part of the data. Hence, the residuals are normal and ACF and PACF plots will show no significant correlation.
We will apply this model for one step ahead recursive forecasting.