RRG-Lite is a Python CLI tool for displaying Relative Rotation graph (RRG) charts.
Supports Python >= 3.8
RRG-Lite is currently a work in progress, and its RRG calculations are not yet at the level of the original Relative Rotation Graph (RRG) implementation.
The current implementation is more sensitive to short-term price movements and noise, which can result in erratic or unstable rotations. A more robust implementation needs better smoothing and signal-cleanup to produce the smoother, more sustained curves expected from an RRG.
Further development of the project is currently paused, while a more robust RRG calculation is worked out. Once the underlying calculation is improved, additional features can be built on top of it.
If you are looking for a production-ready RRG implementation for Indian markets today, there are already some good alternatives worth considering:
Disclaimer: I use the platforms mentioned below, but have no affiliation or commercial relationship with any of them.
Dhan – Dext T3 Trading Terminal
Dext T3 includes a Relative Cycle Graph, which appears to be an in-house implementation of RRG.
Registration on Dhan is free, making it a convenient option to try RRG functionality without an additional subscription.
Strike.money provides RRG functionality for Indian markets with a 7-day free trial and monthly payment options.
The project is primarily worth pursuing because of its ability to work with additional and custom indices, that may not be supported by existing platforms.
The goal is to eventually combine that flexibility with a robust implementation of the underlying RRG methodology that is useful to its users.
RS Momentum (Rate of Change) now uses a static base date for more consistent and comparable results. Users can set a custom base date via the new BASE_DATE option (ISO format date). If not provided, it defaults to the existing PERIOD-based base date.
See changes in v1.0.12-beta.1.
See updated WIKI docs on BASE_DATE config
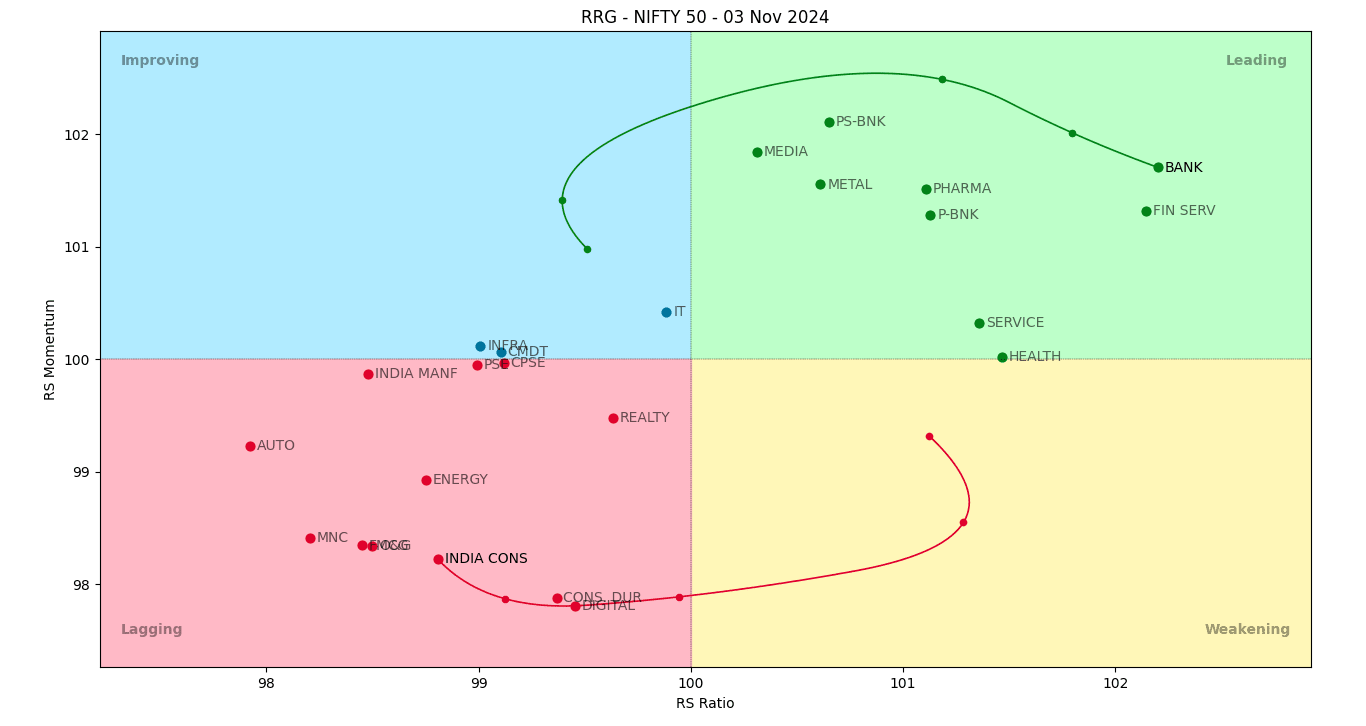
An RRG (Relative Rotation Graph) chart is used to analyze the relative strength and momentum of multiple stocks or sectors compared to a benchmark (usually a market index like the S&P 500 or Nifty 50).
It provides a bird's-eye view of how various stocks or sectors are performing relative to the benchmark over time.
RRG charts can help identify which stocks or sectors are outperforming or underperforming the index.
They are useful for asset allocation decisions and for identifying both momentum stocks and potential bottom-fishing opportunities.
Read more about RRG - Investopedia.com
Unlike traditional RRG charts,
- Tickers are shown without tail lines or labels for a cleaner look. (See Chart controls)
- Mouse and keyboard controls enhance the user experience and aid in detailed analysis.
By default,
- The timeframe is weekly and 14 week average is used for calculations.
- The RS momentum is calculated by comparing the current value to its value from 52 weeks ago.
- See wiki for explanation of RS ratio and Momentum calculations
This project was inspired and made possible due to the work of An0n1mity/RRGPy.
If you liked this project, please 🌟 the repos to encourage more inspirational works. ❤️
git clone https://github.com/BennyThadikaran/RRG-Lite.git
pip install -r requirements.txt
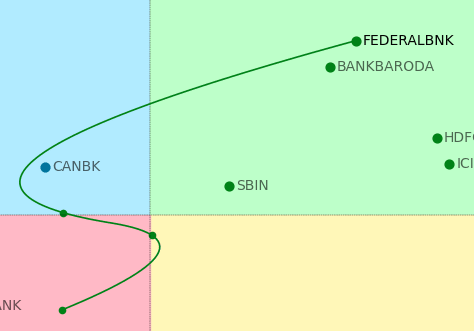
Optional: To enable curved tail lines, install scipy.
pip install scipy
- If tail count is less than 3, it defaults to straight lines.
To get started, you need a folder containing OHLC data (Daily timeframe or higher) in CSV format.
Folder must contain:
- Atleast one Benchmark index file.
- One or more stock / etf / sector files.
Create a user.json file in src/ as below
{
  "DATA_PATH": "full/path/to/data/folder/"
}
DATA_PATH must be a folder path, where OHLC data is stored. Above is the minumum configuration required to get started.
See additional configuration options
If you need data on Indian Stocks (NSE), you can try EOD2 and follow install instructions here to setup EOD2.
Once EOD2 is setup, follow the setup instructions, and set DATA_PATH to the full path to EOD2 daily folder located in src/eod2_data/daily/.
You can download my sectors watchlist file that works with EOD2 - sectors.csv
Pass a benchmark index using -b and a list of symbol names using --sym.
py init.py -b "nifty bank" --sym csbbank rblbank
Note: In the above example, it will look for files named nifty bank.csv, csbbank.csv, and rblbank.csv in the DATA_PATH folder
Pass a watchlist file using -f option
py init.py -b 'nifty 50' -f sectors.csv
Note: See details on setting up a watchlist
To display help, use the -h option.
py init.py -h
Left Mouse click on any point (marker) to display/highlight the tail line and label.
When a line is highlighted:
- Press
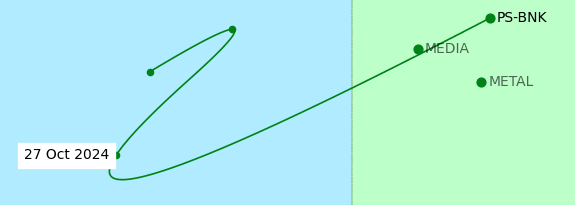
Left arroworRight arrowkeys to cycle through each marker on the line, diplaying a date label. (see image below) - Press
deleteto remove all highlighted lines.
Press h to toggle help text (Keybindings) in the chart.
Press a to toggle displaying ticker labels (Annotations)
Press t to toggle tail lines for all tickers.
Press q to quit the chart.
To reset the chart, press r
To use the zoom to rectangle tool - Press o (useful when lots of symbols on the chart.)
Matplotlib provides useful window controls like zooming and panning. Read the links below on how to use the various tools.