Repository navigation
3D Network View
The 3D Network view displays your network's nodes and links in an interactive three-dimensional scene. Use it to:
- Rotate a network to inspect connections from different angles.
- Distinguish node categories with 3D shapes, colors, labels, and sizes.
- Review link origins and direction, then export the current camera view with its legends.
Load a network in MicrobeTrace. You can use node and link files, sequence-based network data, or a saved MicrobeTrace session. To follow the examples below, choose Continue with Sample Dataset on the welcome screen.
- Load your data and select Launch, or continue with the sample dataset.
- Open View, then select 3D Network.
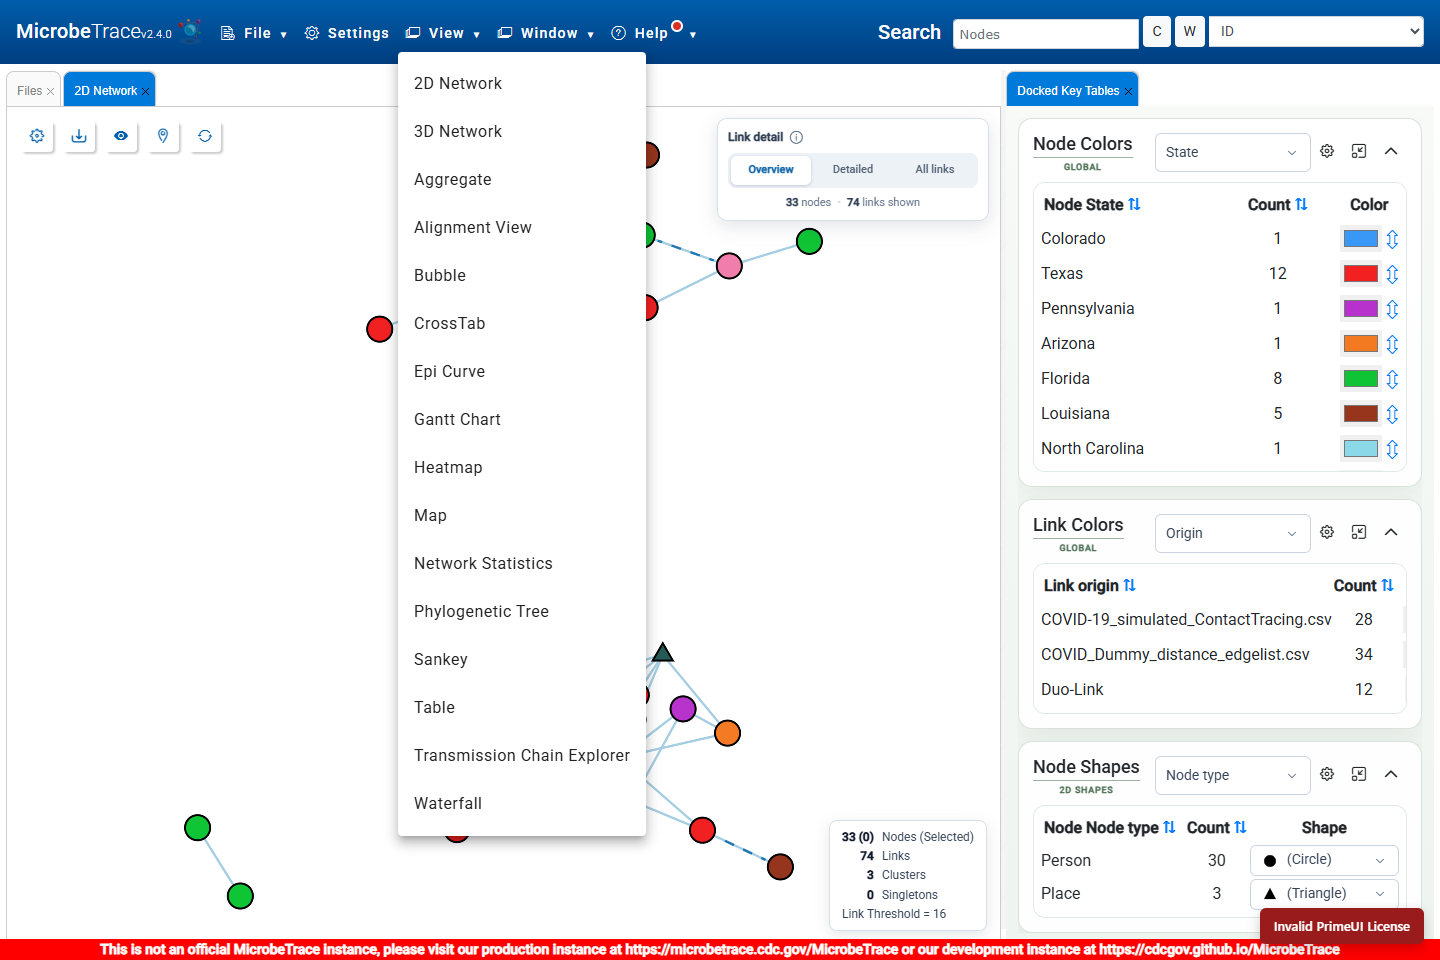
- Select Fit Network, the eye button in the view's toolbar, to bring the visible nodes into view.
- Drag an empty part of the network to rotate the camera. Right-drag to pan, and use the scroll wheel to zoom.
- Select Freeze Layout, the pin button, when you want the nodes to hold their positions while you explore. Select the same button, now labeled Resume Layout, to let the layout move again.
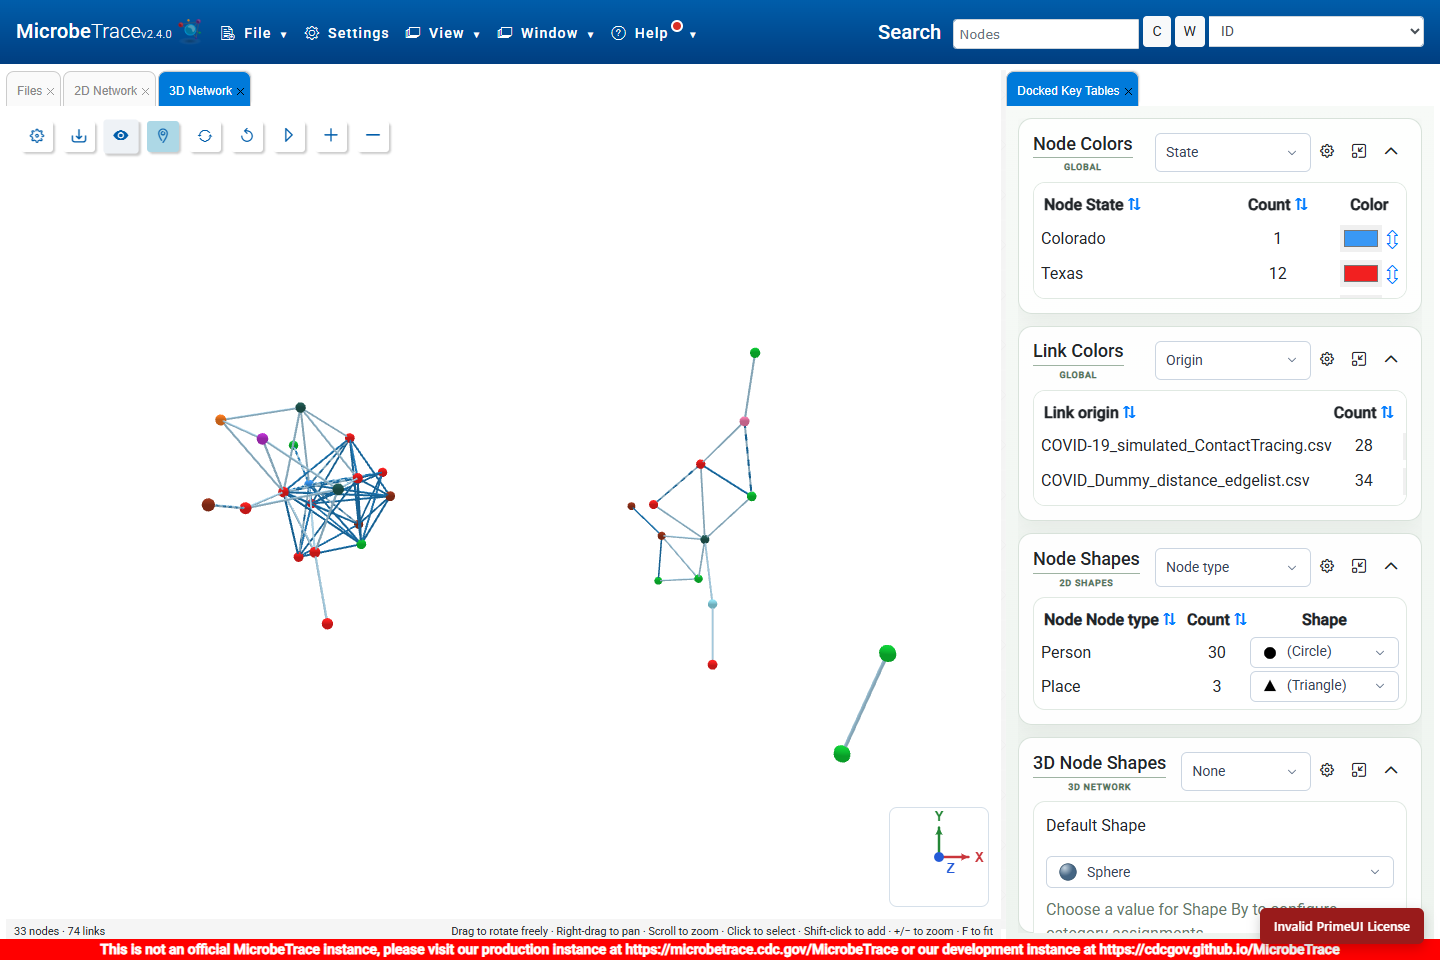
The lower-left count shows the nodes and links currently displayed. The 3D view follows the same shared network filters as the other network views.
- Select Play camera rotation, the triangle button in the 3D toolbar.
- Watch the network rotate around the current camera target. A full turn takes about 30 seconds.
- Select the button again, now showing Pause camera rotation, to hold the current angle.
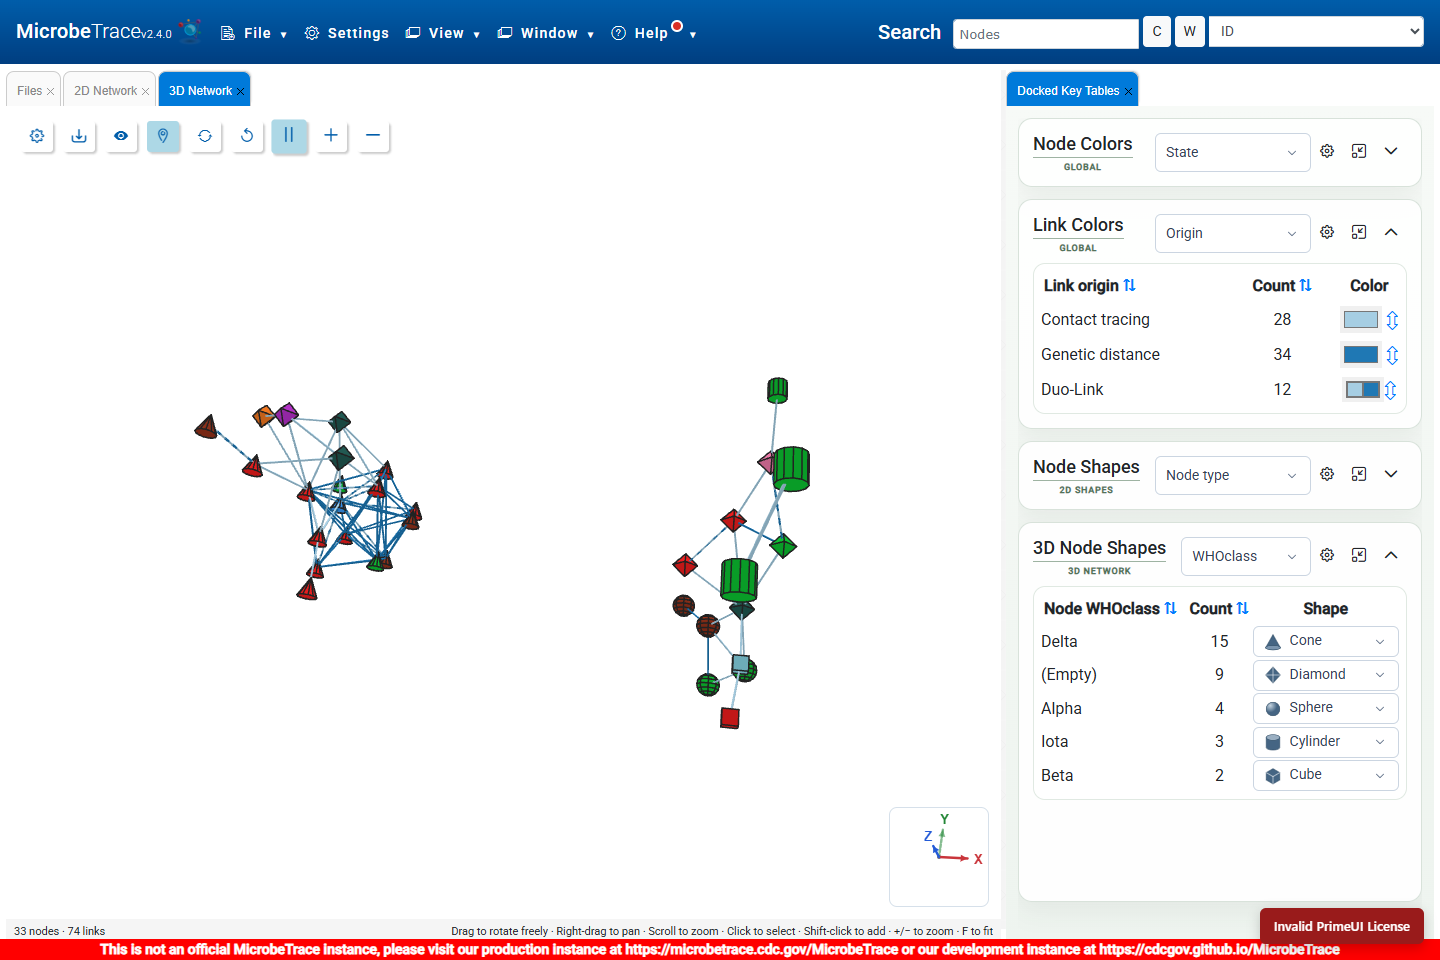
Camera rotation also works while the layout is frozen. Dragging the scene, fitting or resetting the camera, recalculating the layout, or hiding the view stops automatic rotation.
The compass in the lower-right corner follows the camera. X is red, Y is green, and Z is blue. Dashed arrows point away from you. An axis viewed end-on appears as a dot when it points toward you, or a ring when it points away.
Choose a categorical node field to represent with shapes. The sample dataset includes WHOclass, Node type, Profession, and State. These examples use WHOclass for shapes and State for colors, allowing you to see both attributes at once.
- Select the settings button in the upper-left corner of the 3D view.
- On the Nodes tab, expand Labels and Tooltips. Choose ID under Label to identify individual nodes, and adjust the label size or orientation as needed.
- Expand Shapes and Sizes. Leave Size By as None to use a fixed size, increase Size to make the shapes easier to see, and set Border Width to a small value such as 1.5.
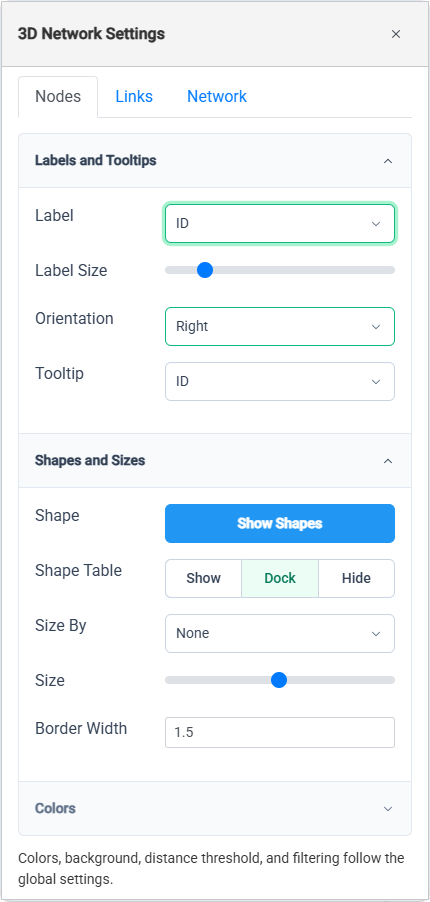
- Select Show Shapes. A new shape legend normally appears in Dock mode beside the other key tables. Use Show, Dock, or Hide to choose its display mode.
- In the 3D Node Shapes legend, choose WHOclass under Shape By.
- Use the shape dropdown beside each category to change its assignment. Available shapes are sphere, cube, cone, cylinder, diamond, and square pyramid.
- To adjust colors, expand Colors and select Show Colors. Choose State as the node color field for this example. Global color changes apply across views.
- Close the settings dialog to inspect the styled graph. If labels overlap, set Label back to None and use tooltips to inspect individual nodes.
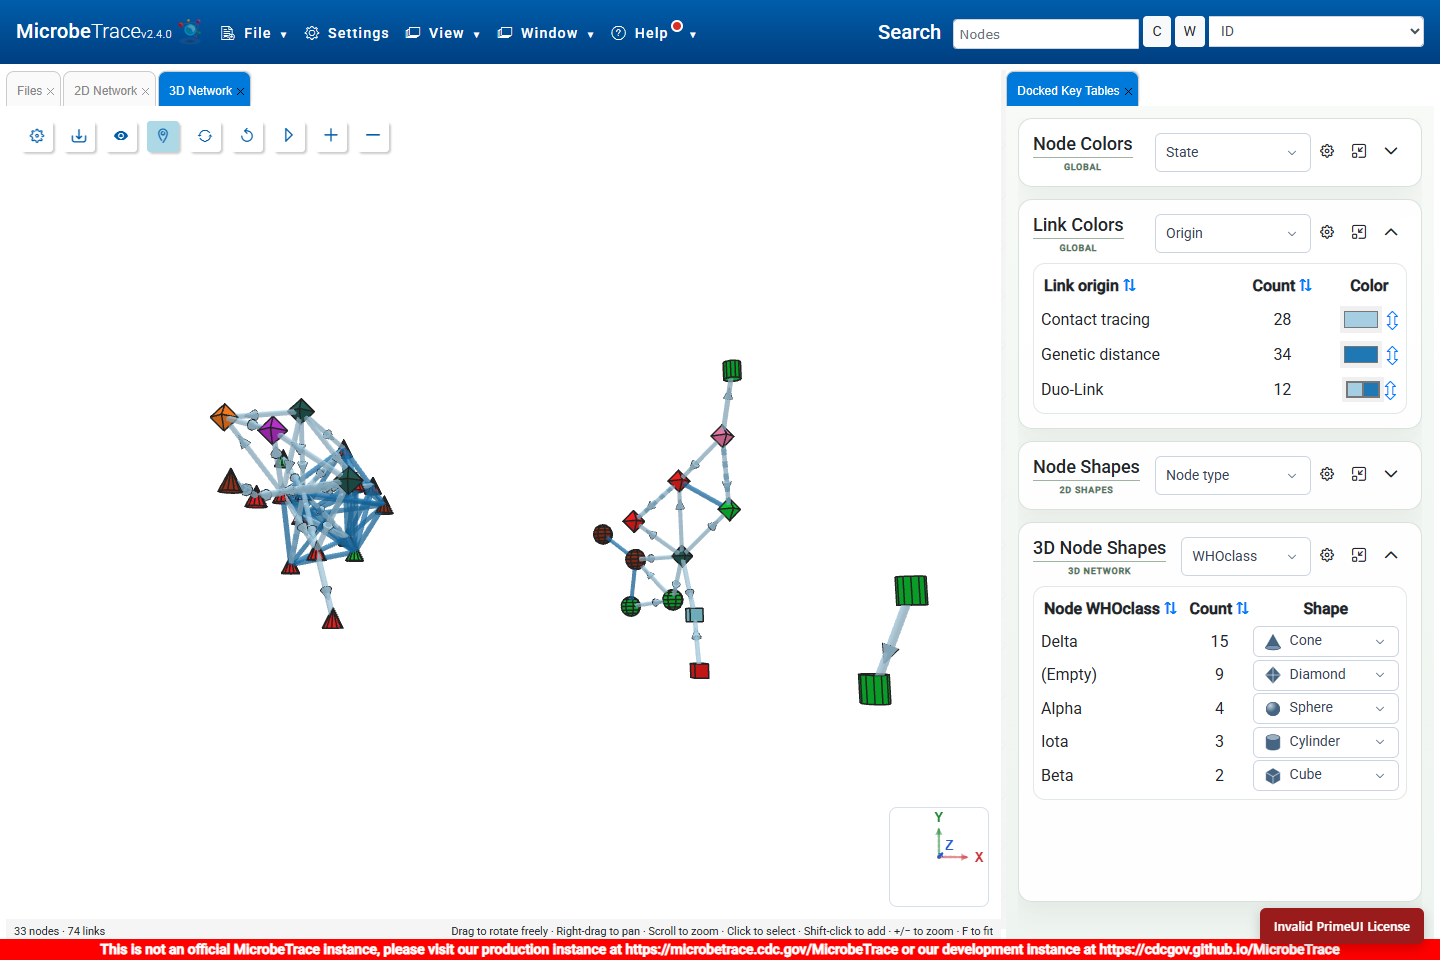
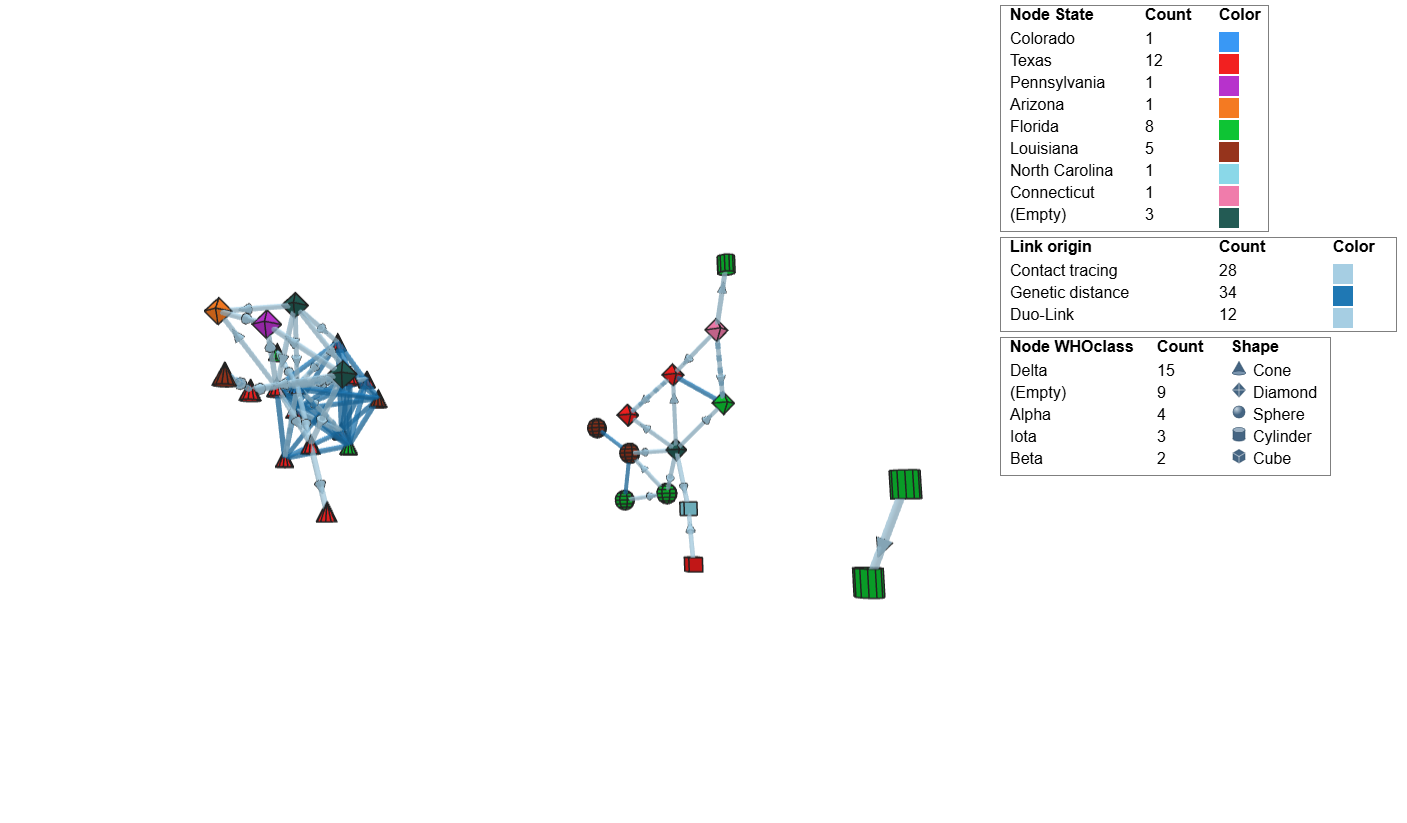
- Count describes the currently visible nodes in each shape category. (Empty) groups nodes without a value for the selected field.
- Select a category name or column heading to edit its display text. Use the column arrows to sort, and the legend's settings button to choose whether to show counts or frequencies.
- Use the collapse button to save space or the float button to move the legend into a separate dialog. Show Shapes keeps an already visible legend in its current mode.
- Shapes repeat when a field has more categories than available shapes. Category assignments remain stable as you filter the network.
- Border Width changes the visible frame edges of the 3D shape, including edges between faces. Set it to 0 to hide the frame.
The 3D Node Shapes legend controls this view. The separate Node Shapes / 2D Shapes table controls the 2D view. The 3D view keeps its own shape assignments, sizing, labels, and tooltips.
To vary node sizes, select a numeric field under Size By, then adjust Min Size and Max Size. Under Labels and Tooltips, choose one or more tooltip fields to inspect when you hover over a node.
Use a network with multiple link sources to compare origins. The sample dataset combines contact-tracing and genetic-distance links. To display arrowheads, links must also contain direction information.
- In the Link Colors key table, choose Origin. Links supported by two origins appear in the Duo-Link row.
- For shorter legend labels, edit the source names directly in the table. The screenshots use Contact tracing and Genetic distance.
- Open the 3D view's settings, select Links, and expand Shapes and Sizes.
- Adjust Width to make the links easier to inspect. Alternatively, choose a numeric field under Width By, then set its minimum and maximum widths. Reciprocal reverses the width mapping.
- Move Transparency to the right to make links more transparent. Select Use legend transparency to return to the transparency settings in the global color keys.
- Set Arrows to Show for directed links. Set Bidirectional to Show to add a reverse arrowhead on directed links that are also marked as bidirectional.
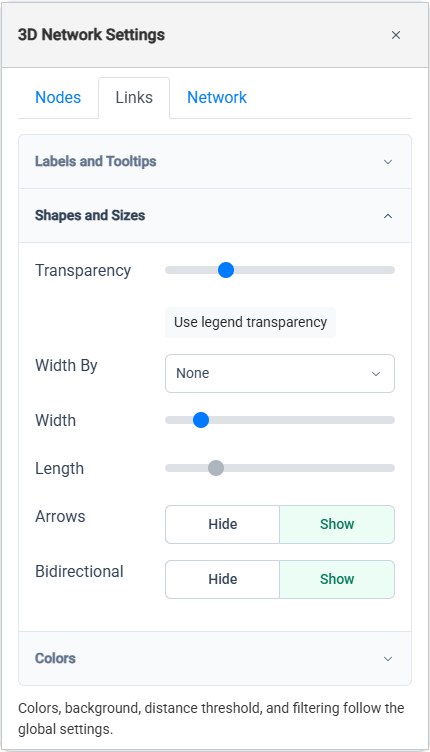
With Origin coloring selected, a dual-origin link uses a solid stroke for its first origin and dashed bands for its second. Each origin retains its color and legend transparency. Arrowheads have a contrasting outline so they remain visible against opaque links.
Expand Labels and Tooltips on the Links tab to choose a link label or tooltip fields. Distance labels follow the active global metric: SNP counts appear as whole numbers, and TN93 labels follow the selected decimal or percentage display format.
- Select a node to select the same record in linked views. Use Shift, Ctrl on Windows, or Command on macOS while clicking to build or adjust a selection.
- Click empty space or press Escape while the network has focus to clear the selection.
- Open Network > Display in 3D settings to control neighbor highlighting while hovering over nodes.
- Shared distance thresholds, nearest-neighbor rules, minimum cluster size, subset filters, and timeline filters change which nodes and links appear. Only links with two visible endpoints are drawn.
- For a dense network, narrow the visible subset and freeze the layout before inspecting it from several angles.
Use File > Save to save a MicrobeTrace session. The session stores the 3D camera angle, node positions, frozen-layout state, and appearance settings. Reopening a saved view retains its camera angle and starts with automatic camera rotation paused.
- Rotate and zoom to the angle you want, then pause camera rotation.
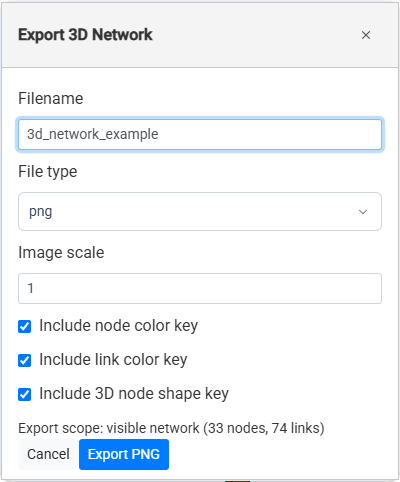
- Select Export Screen, the download button in the 3D toolbar.
- Enter a filename and choose png, jpeg, or webp under File type.
- Increase Image scale if you need a larger image.
- Choose whether to include the node color key, link color key, and 3D node shape key. The shape-key option becomes available when Shape By is set to a field.
- Select Export PNG, Export JPEG, or Export WEBP, depending on the selected format.
The exported image uses the current camera angle and visible network. The selected keys are added alongside the graph. Below is the PNG produced by the example above:
- Settings: Change node and link appearance, tooltips, and neighbor highlighting.
- Fit Network: Bring the visible graph into view. Press F while the network has focus for the same action.
- Reset Camera: Restore the default viewing direction and frame the network.
- Freeze Layout / Resume Layout: Hold or release node positions while keeping camera navigation available.
- Recalculate Layout: Create a new arrangement of the nodes.
- Play / Pause camera rotation: Start or stop automatic camera movement.
- Zoom in / Zoom out: Change the viewing distance. The scroll wheel and + / − keys also zoom.
- 3D Network is missing from the View menu: This feature is currently available only in the development version of MicrobeTrace.
- The graph is off-screen: Select Fit Network or Reset Camera.
- No nodes match the current filters: Review the global filters, selected subset, and timeline range.
- The network keeps moving while you inspect it: Select Freeze Layout. Camera rotation has a separate play/pause button.
- The shape legend is missing: Open Nodes > Shapes and Sizes and choose Show or Dock for Shape Table. Expand the card if it is collapsed.
- Arrows do not appear: Confirm that Arrows is set to Show and the relevant links are marked as directed. Reverse arrowheads also require the bidirectional flag and its display control.
- The Length slider is disabled: Resume the layout before changing link length.
- The 3D shape key cannot be included in an export: Choose a field under Shape By first.
- A WebGL error appears: Select Retry, or use Open 2D Network to continue inspecting the network in 2D.