MAGGIC Plots
Publication quality plots generated by maggic-wand for MAG and bin quality assessment, taxonomic diversity, and AMR/MGE profiling. All plots appear in the MultiQC report under the MAGGIC Plots section.
Completeness vs contamination scatter plot for all MAGs.

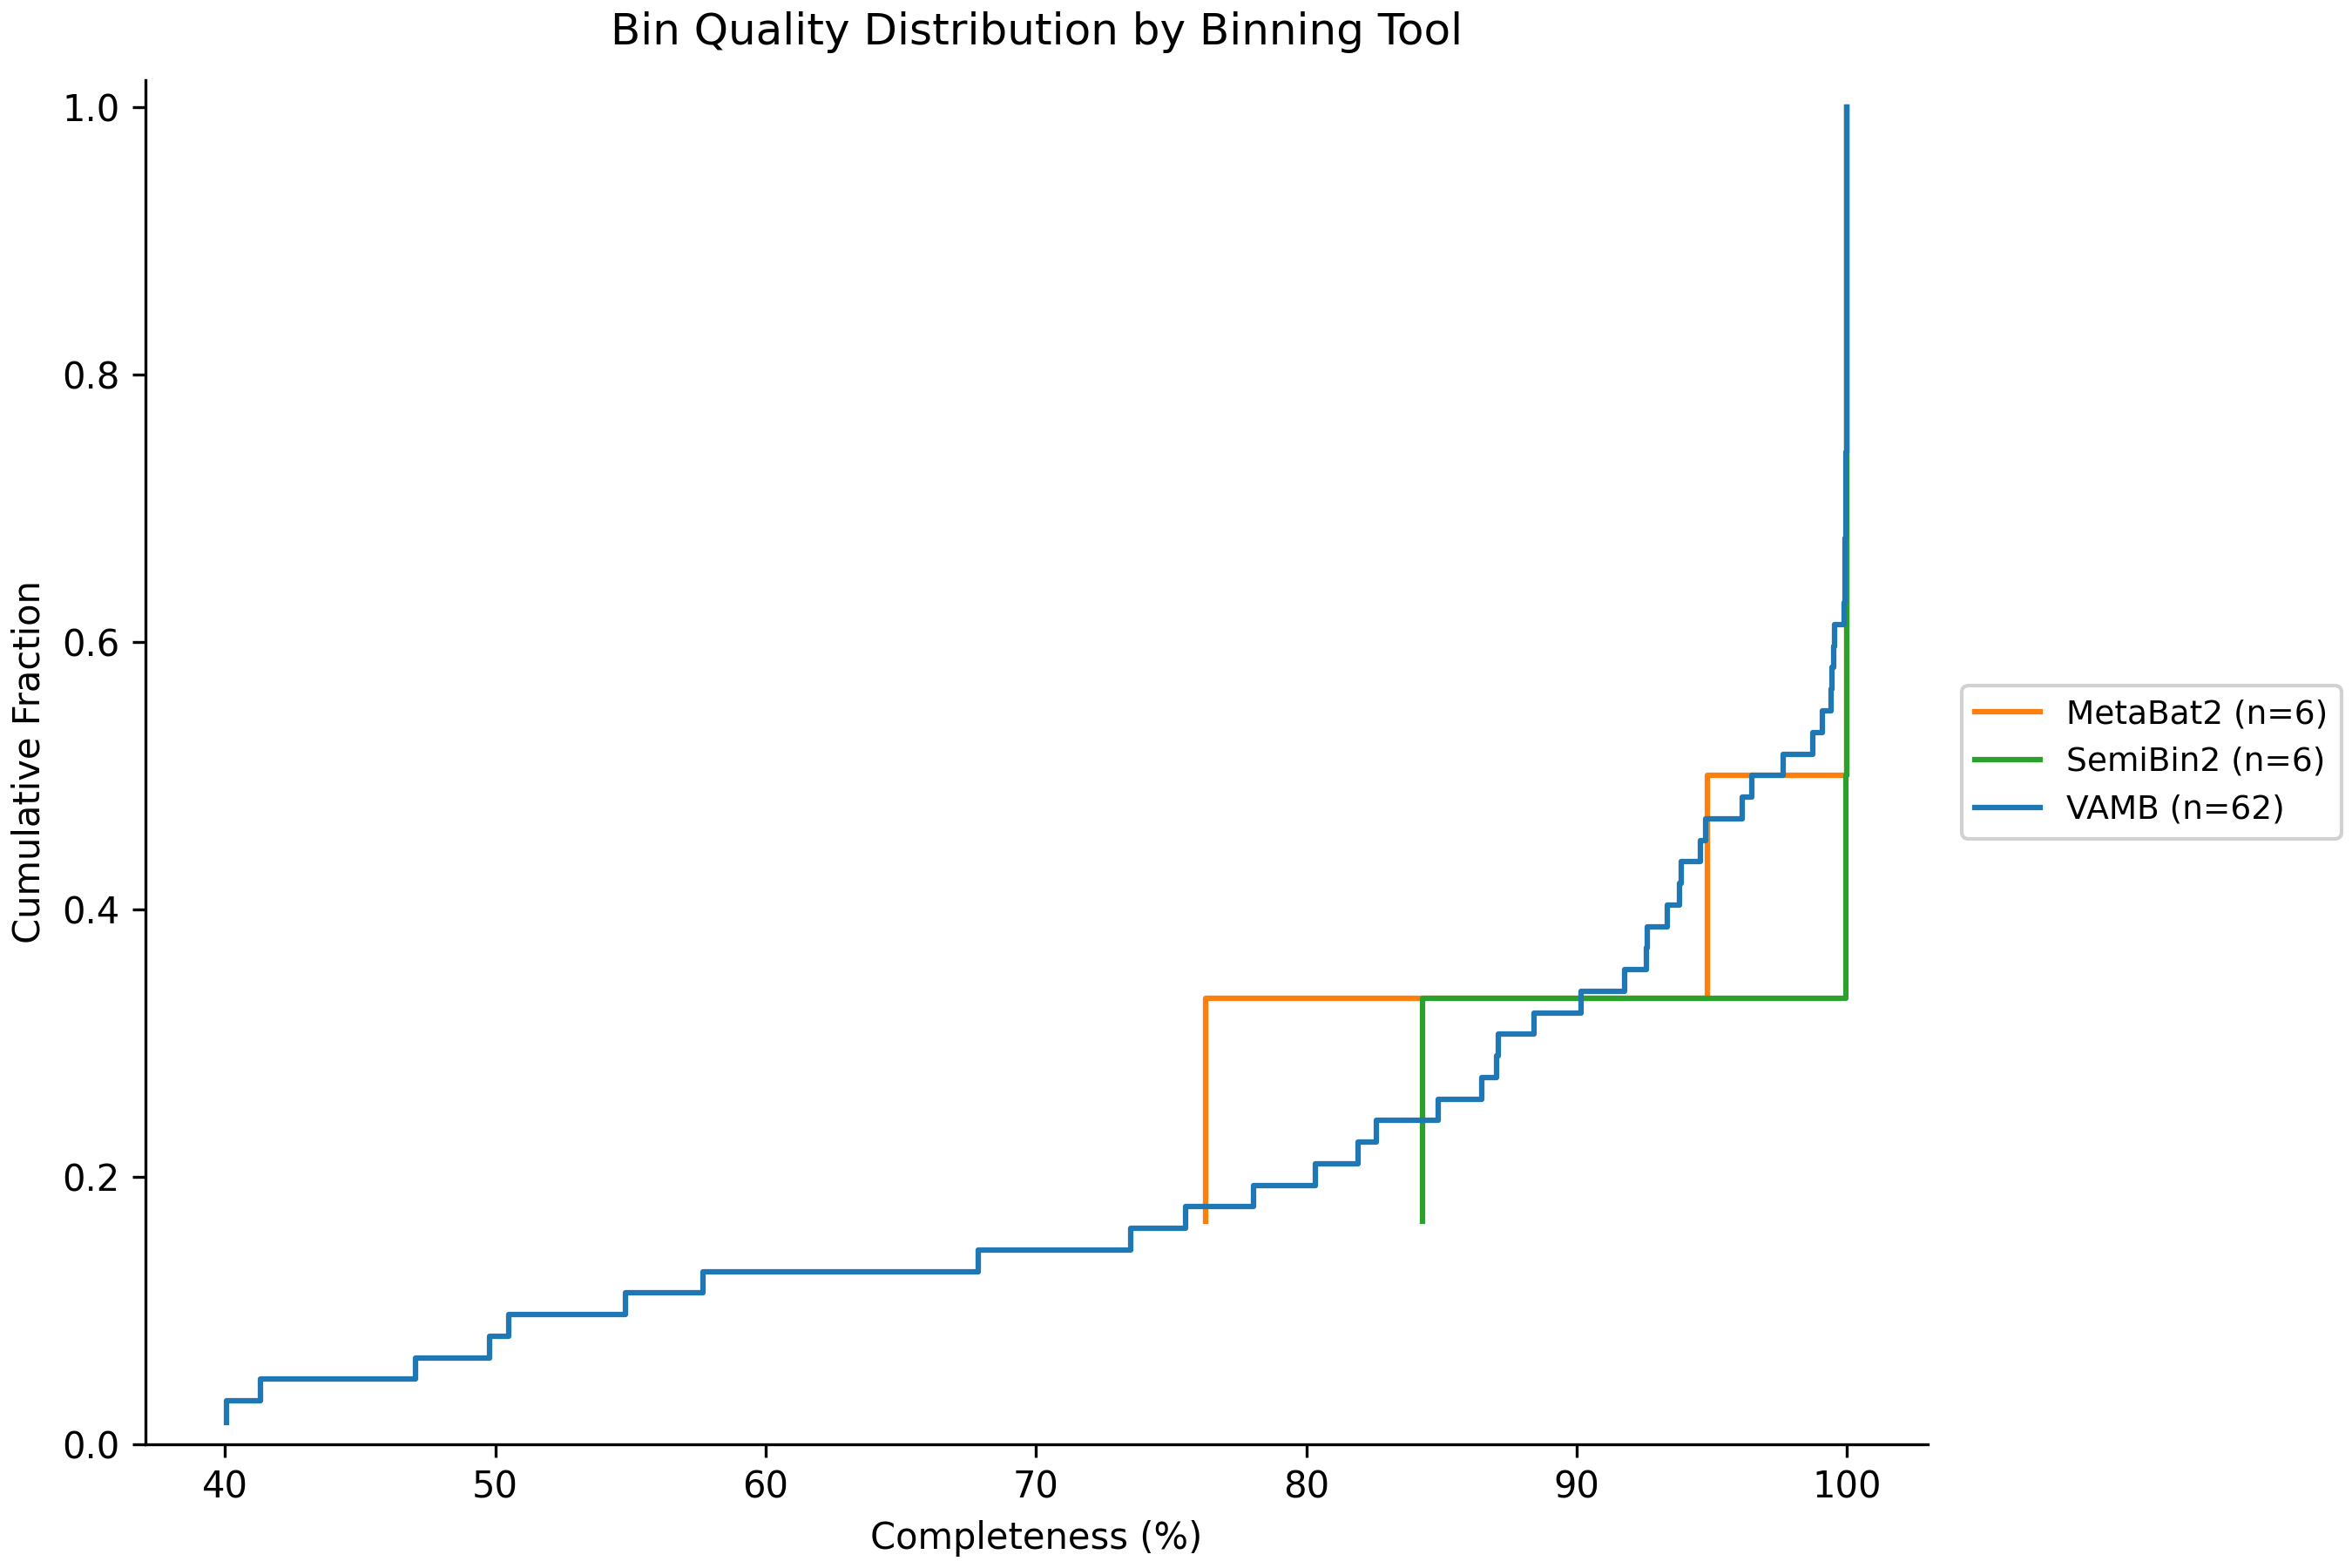
Empirical cumulative distribution of MAG quality metrics.
Scatter of completeness against number of contigs per bin.

Genus-level taxonomic composition across all MAGs.

Species-level taxonomic composition across all MAGs.

Genus-level taxonomic abundance heatmap.

Species-level taxonomic abundance heatmap.

Word cloud of detected AMR gene symbols, sized by frequency.

Donut chart of AMR classes across all bins.

Radar chart of mobile genetic element signals (plasmid, virus, provirus, conjugation) across bins.
