Video Mesh Developer APIs Documentation
Video Mesh Developer APIs are a powerful set of tools that enables you to monitor and troubleshoot your Video Mesh deployments. You can troubleshoot an issue by triggering an on-demand test from the Webex Developer Portal and debug the issue by retrieving analytics and monitoring data using the APIs. The data retrieved from the Monitoring APIs can be integrated with your custom monitoring application.
The APIs are available at https://developer.webex.com/docs/api/v1/video-mesh.
- Login to the Developer Portal with a user account that has Org Admin privileges.
- You should be able to view a list of Video mesh APIs as shown below.
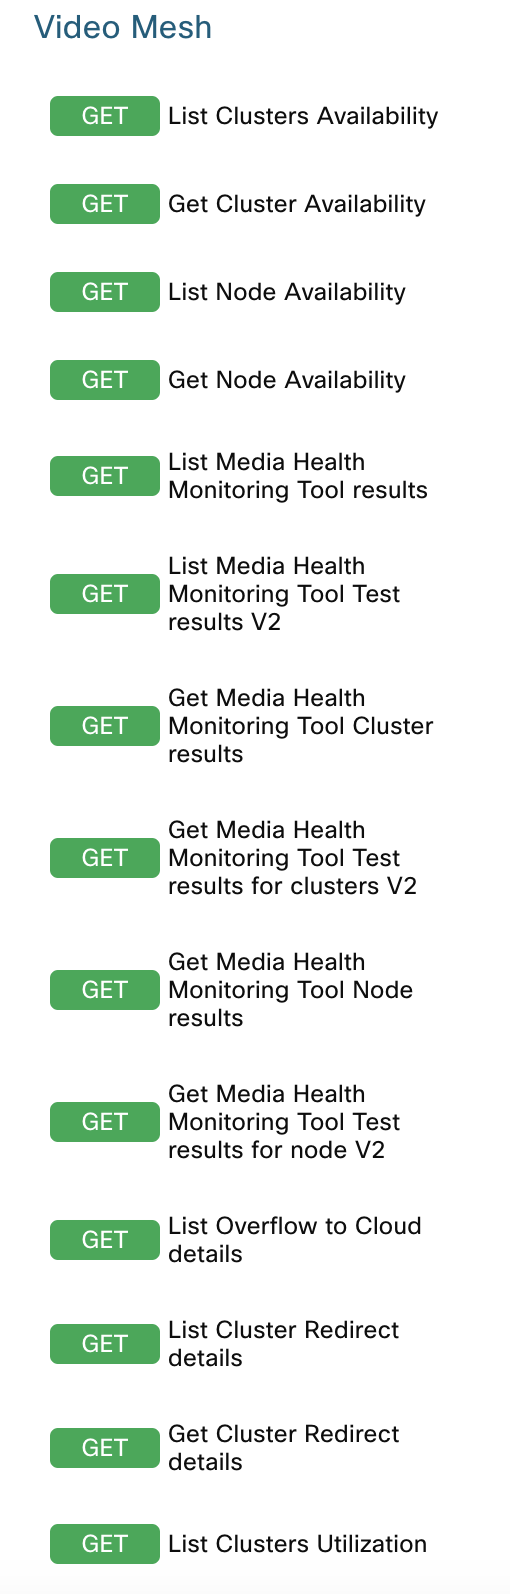
Before you begin, enable "Use personal access token" in the portal for triggering the APIs.

I. To trigger “GET” APIs, follow the steps below.
- Click on the specific “GET” API you want to trigger.
- The APIs take Organization ID / Cluster ID / Node ID as a parameter along with the time range.

NOTE: You can get the Organization ID from this API:
https://developer.webex.com/docs/api/v1/organizations
You can get the list of IDs of all clusters and nodes of the organization using this API:
https://developer.webex.com/docs/api/v1/video-mesh/list-cluster-details

- Click Run and copy the "id" of the desired organization from the API response.


- Enter the IDs (node/cluster) in the fields shown below.


- The Response Properties section in the Developer Portal provides details of the data that the APIs return.
II. To trigger “POST” APIs, follow the steps below.
- Click on the specific “POST” API you want to trigger. Enter the IDs (node/cluster) in the fields shown below.
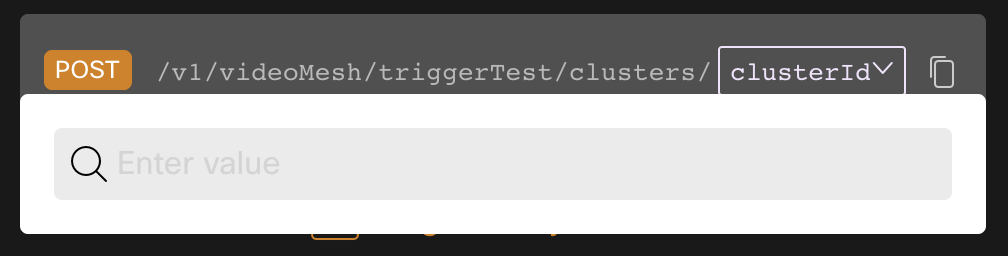
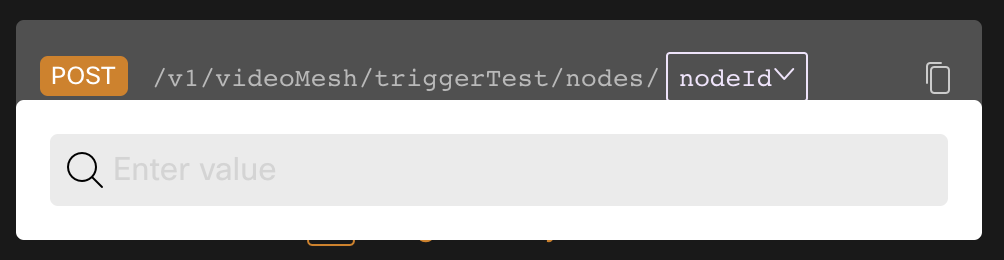
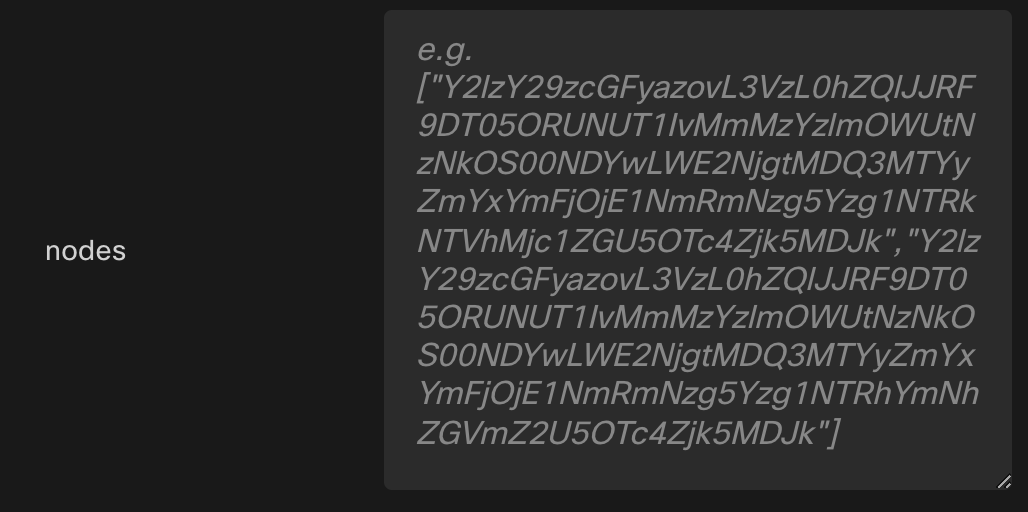
NOTE: While triggering a test for a cluster, you can choose to trigger the test for specific nodes of that cluster (maximum 10 for each test).
- Enter the list of nodeIds here:
- Enter the test type here:

- The “Response” section in the Developer Portal provides details of the data returned by the APIs.
- You will get a “commandId” in the response for each test that is triggered, as shown below.
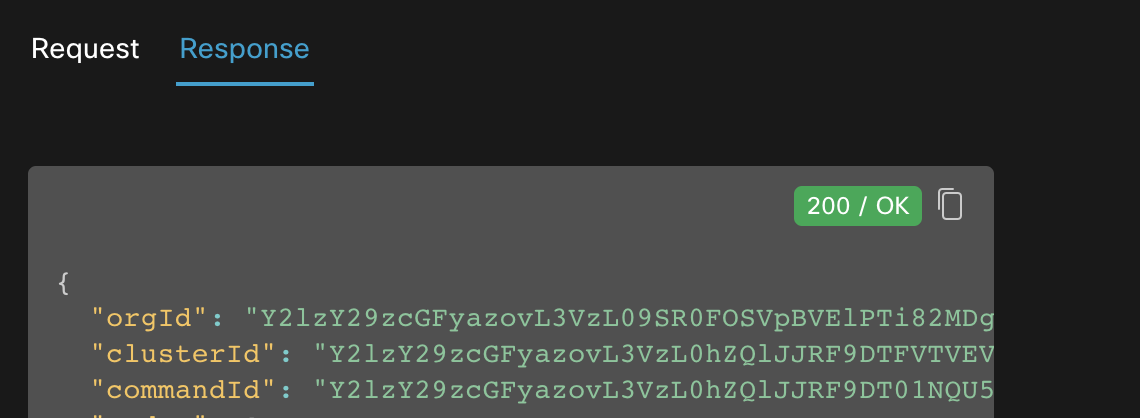
- This commandId can be used to check the status of the triggered test as well as the result of the test once it is completed.
- Enter the commandId for “GET” Test status API and “GET” Test results API here:
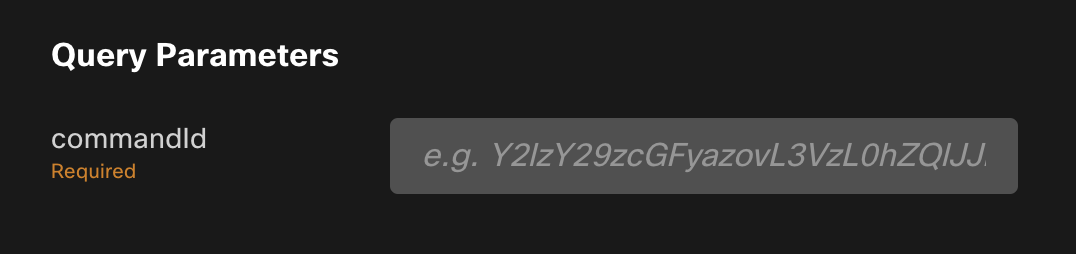
NOTE: Once the status of a triggered test changes to “Completed”, it will take a few minutes for the test results to be displayed.
The Integrations listed below are supported for Video Mesh APIs. You can create new integrations at https://developer.webex.com/my-apps/new/integration
- spark-admin:video_mesh_api_write - Used for triggering the tests on Video Mesh Clusters and Nodes.
- spark-admin:video_mesh_api_read - Used for all other APIs to retrieve data.
You can find details of creating and using integrations here: https://developer.webex.com/blog/real-world-walkthrough-of-building-an-oauth-webex-integration
The following APIs are currently available:
Returns data mentioning the timeline of availability for clusters (Available/Partially Available/Unavailable) and nodes (Available/Unavailable).
Returns the data trend for the number of call legs that overflowed to cloud clusters and reasons for the overflows.
Returns the trend data for the number of call legs that were redirected to other On-Premise clusters and the reasons for the redirects.
Returns the data trend for the resource utilization metrics in the Video Mesh cluster, such as Peak and Average CPU, and Maximum number of Active Call Legs.
Returns the details of all clusters registered in the organization such as nodes registered, upgrade schedule, upgrade timezone etc.
Triggers an On-Demand Media Health Monitor/Network/Reachability test for a cluster or node based on the input provided.
Returns the status of the test triggered using the Trigger Troubleshooting Test APIs. The test status can be “Dispatched”/”Completed”/”Errored”.
Returns the results of the Media Health Monitor/Network/Reachability Tests triggered using Trigger Troubleshooting tests API with a Command ID.
Returns the results from the Media Health Monitor tool that runs on a Video Mesh Node (if enabled). It helps in identifying and diagnosing SIP Signaling, Media Signaling, and Media Cascade Path issues.
Returns the results of the following Network Tests:
A. Bandwidth Test - Tests the bandwidth parameters of the Video Mesh Node's network by running a test from Video Mesh Node to Cloud Services.
B. DNS Resolution Test - Tests the resolution of IP addresses related to Cloud Services, against the DNS Servers configured on the Video Mesh Node's network.
C. HTTPS Connectivity Test - Tests whether the Video Mesh Node is able to connect to the Cloud Services via the HTTPS Protocol.
D. WebSocket Connectivity Test - Tests whether the Video Mesh Node is able to connect to the Webex Cloud Services via WebSocket.
Returns the results of the port reachability checks run on a Video Mesh Node to Webex Cloud data centers. It helps in identifying and diagnosing issues related to port reachability.
Returns the distribution of various client types across Video Mesh Clusters. The supported client types are SIP Devices, Webex App VDI, Webex App Mobile, Webex App Desktop and Webex Devices. At each aggravated interval, the count represents the number of clients that joined a call during that period.
Returns the results for event threshold configurations using the List/Get Event Threshold Configuration APIs. It helps in showing data regarding the current thresholds being used for the generation of Video Mesh Events.
Updates/Resets the event threshold configuration using the Update/Reset Event Threshold Configuration APIs. It helps to change the thresholds being used for the generation of Video Mesh Events.
Based on the time range selected, the data aggregation interval for some of the API response changes. This is indicated in the aggregationInterval attribute of the API response.
- <= 24 hours - The data aggregation interval is 10 mins
- > 24 hours AND <=7 Days - The data aggregation interval is 1 hour
- > 7 days and <= 30 Days - The data aggregation interval is 3 hours
- > 30 days and <= 90 Days - The data aggregation interval is 8 hours
There may be a delay of up to 30 minutes for the latest aggregated data to be available in the API. The minimum time interval that can be queries is 10 mins since that is the minimum aggregation interval.
This data aggregation interval is applicable to the APIs listed below, and their minimum refresh time is 10 minutes.
- Overflow to Cloud
- Cluster Call Redirects
- Cluster Utilization
- Client Type Distribution Details
- Cluster and Node Availability
The APIs listed below support only a limited time range of the past 1 week for requests:
- Media Health Monitor Test Results
- Reachability Test Results
- Network Test Results
The Media Health Monitor Tests and Reachability Tests are invoked periodically on the nodes at intervals of 6 hours, whereas the Network tests are invoked at intervals of 12 hours. The APIs show data of new test runs only after this period has elapsed.
The Administrators can subscribe to proactive events for Video Mesh. The supported ones are clusterCallsRedirected and orgCallsOverflowed.
The thresholds for these events can be configured using the Event Threshold Configuration APIs.
For Detailed Documentation please check here - https://www.cisco.com/c/en/us/td/docs/voice_ip_comm/cloudCollaboration/wbxt/videomesh/cmgt_b_webex-video-mesh-deployment-guide/cmgt_b_hybrid-media-deployment-guide_chapter_0100.html#webhooks-for-video-mesh-alerts
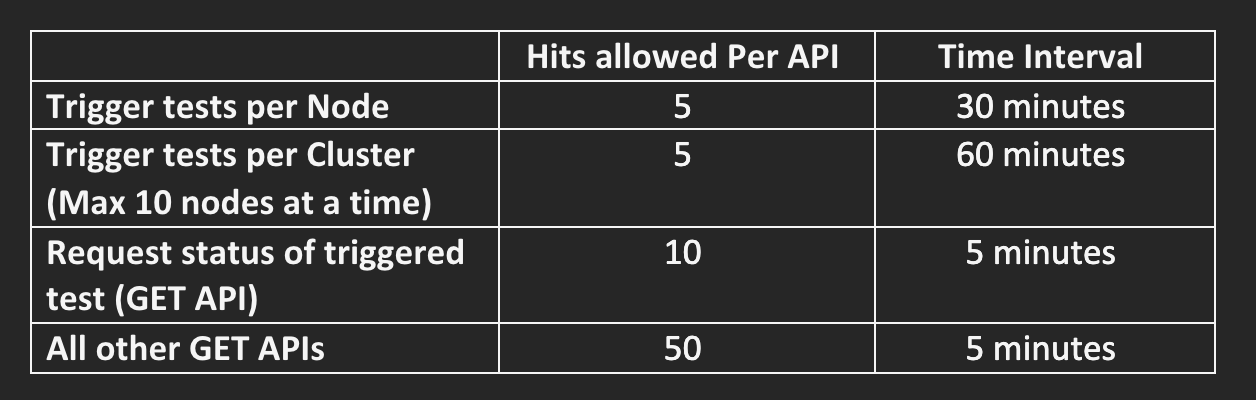
The APIs have Rate Limiting implemented on them at a user level. See Table below for details.
A sample third-party client application built using the Webex Video Mesh APIs can be referenced at https://github.com/CiscoDevNet/video-mesh-api-client