
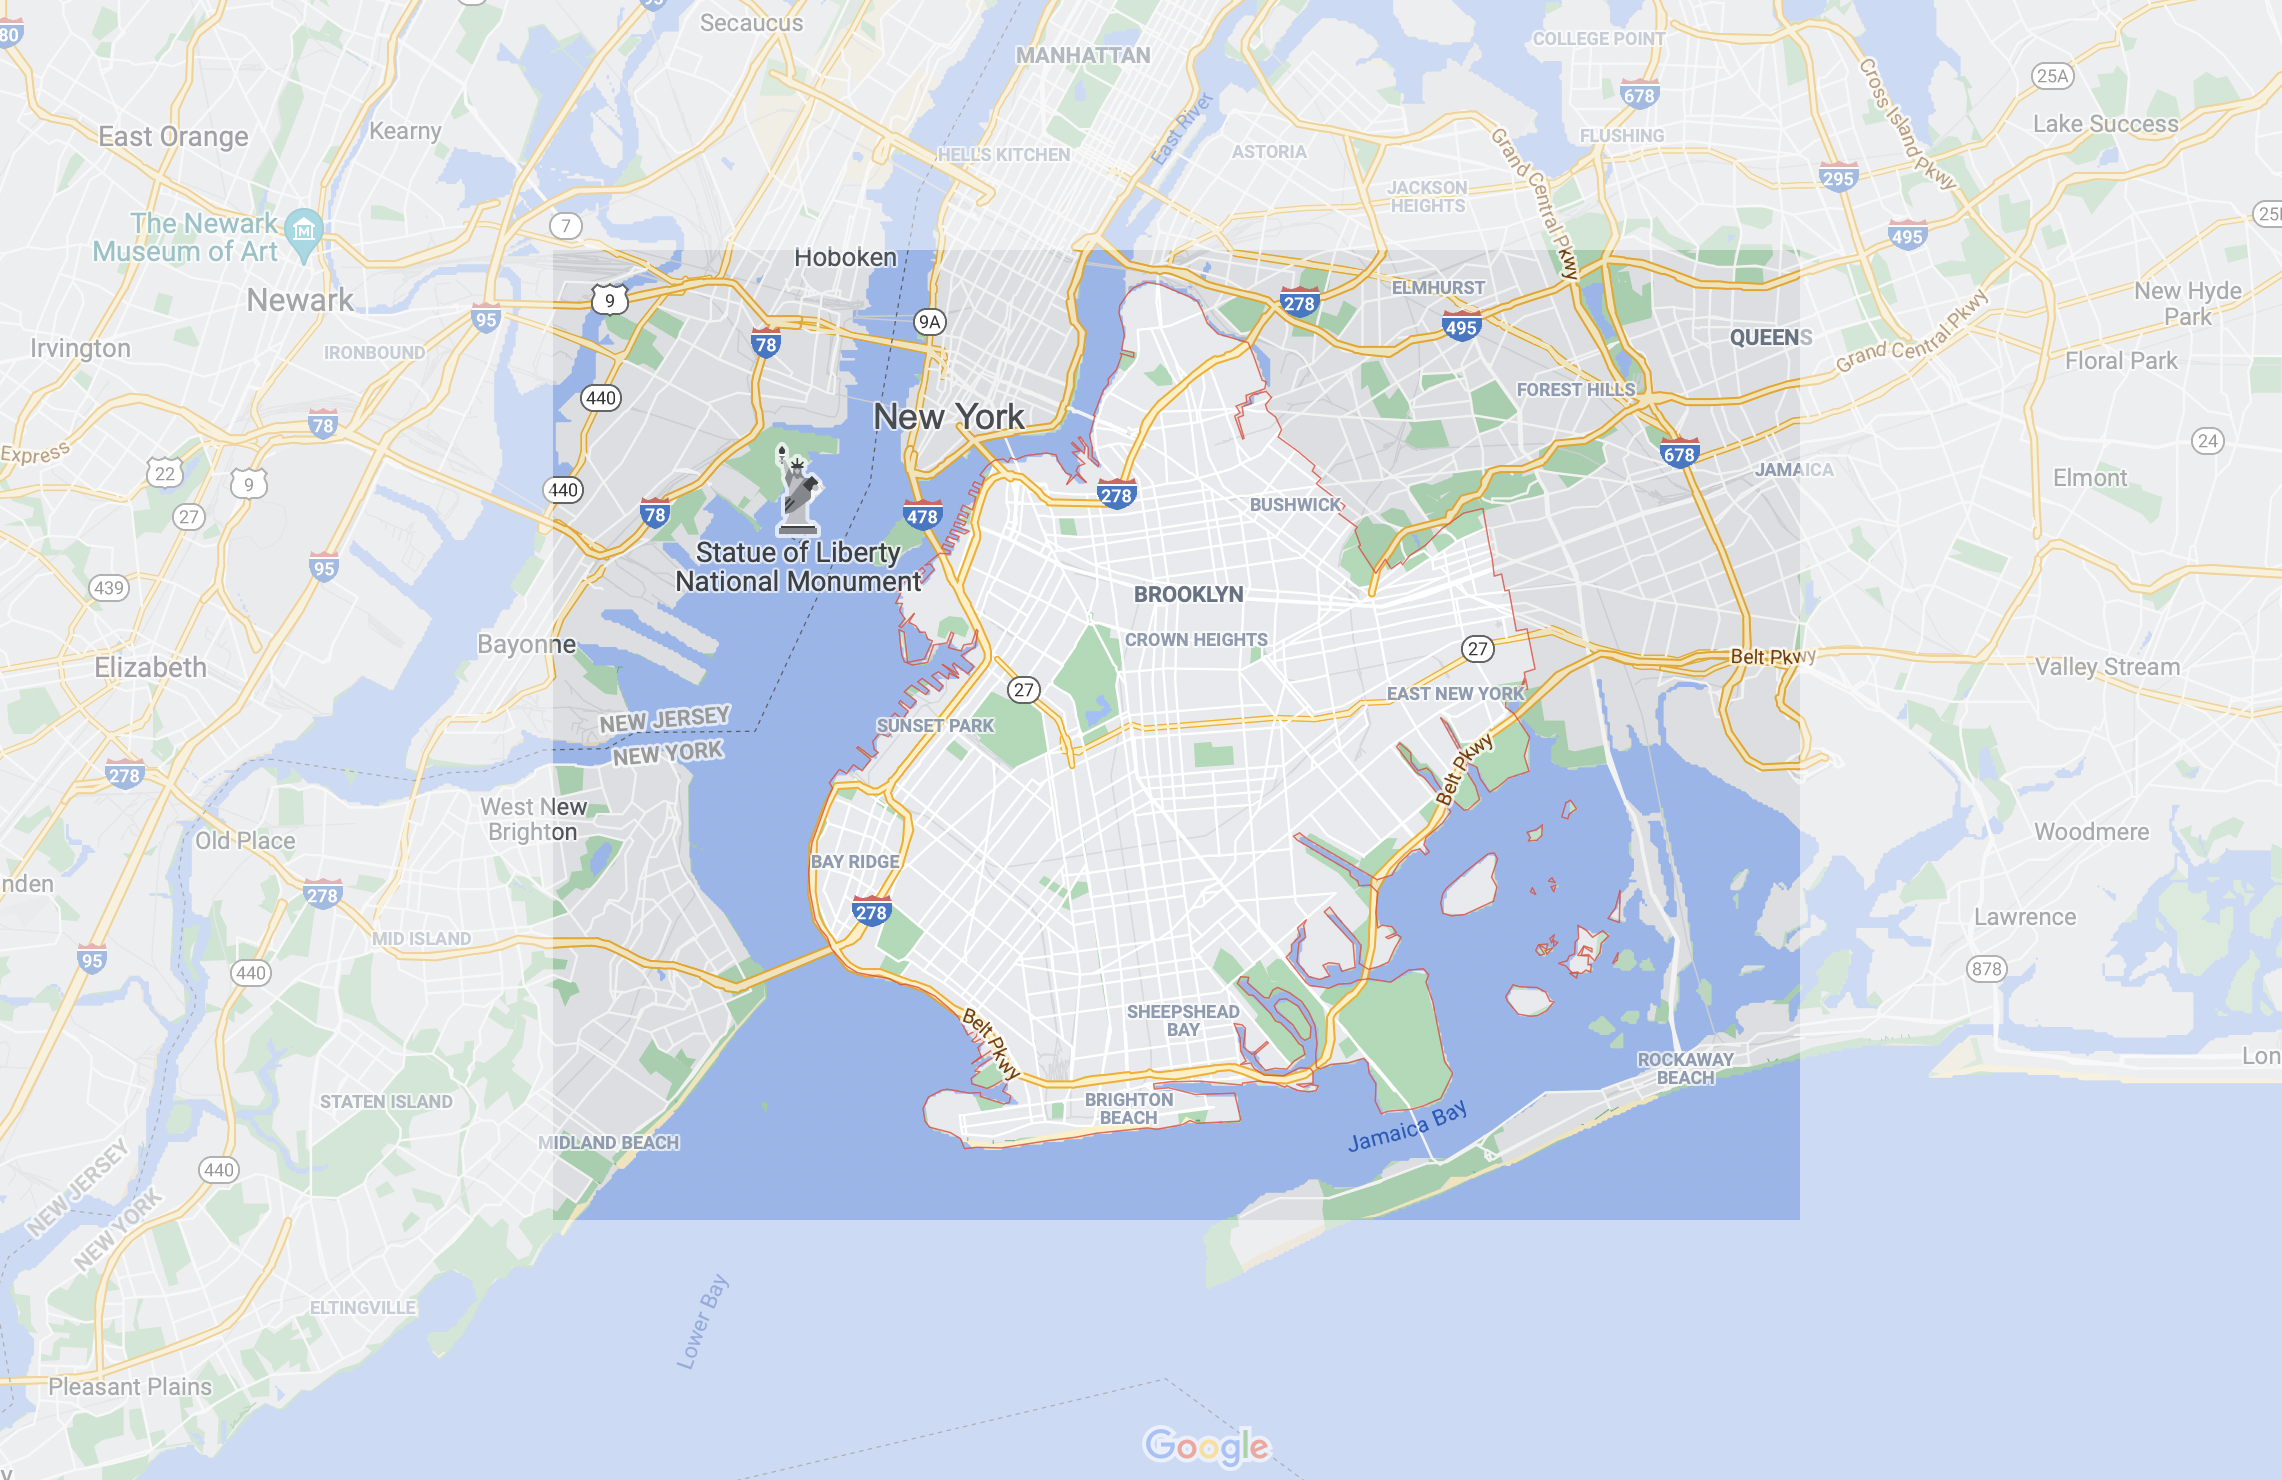
We analyzed the open restaurant application data for Brooklyn in five different neighborhoods: Dumbo, Bay Ridge, Bushwick, Greenpoint, and Sheepshead Bay. We observed the similaraties between each neighborhood and how they ranked against one another in the three qualities—transit access, greenery/shade, safety—we deemed most desirable for outdoor dining. Our data analysis involved observations about how the Brooklyn data compared to the other boroughs along with how the specific neighborhoods were reflected. This analysis focused on aspects of the applications that related to our chosen qualities, such as how the amount of alcohol-serving restaurants relates to the safety of the area.
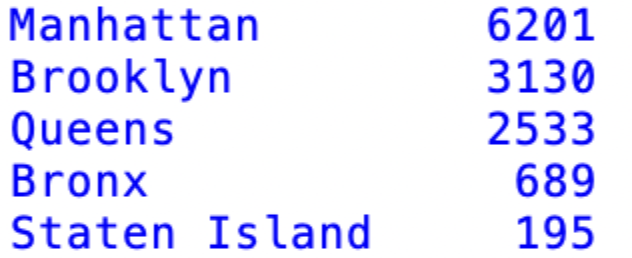
To understand the full scope of the Open Restaurant Program we first took a look at the amount of restaurants that participated per borough and in the program all together. Brooklyn had the second largest amount of open restaurant applications with 3,130 applications. Although Brooklyn is the most populated borough, it only ranked second in the amount of applications for the program. Manhattan had the most establishments that submitted an application with a total of 6,201. This can be linked to the fact that Manhattan is so densely populated and known for its variety of cuisine and nightlife establishments. The total amount of participants in the program was 12748.
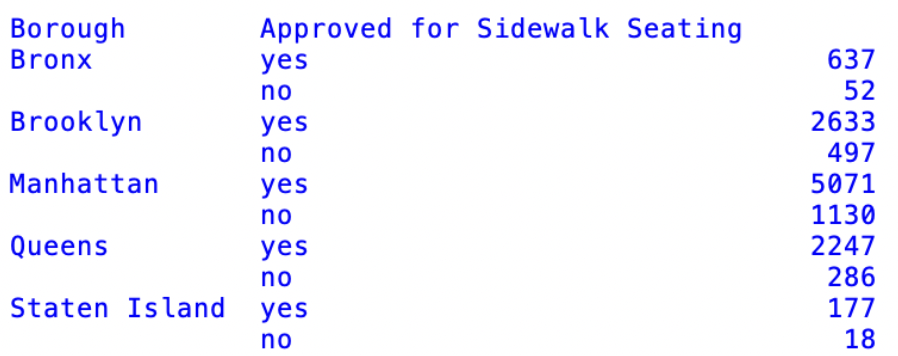
Despite having the largest amount of restaurant applications, Manhattan and Brooklyn had the lowest sidewalk approval percentage. This is likely because the more restaurants there are in the area, the less space there is to allocate to everyone. Also, Manhattan and Brooklyn are both notorious for having small sidewalks in certain areas which can also be a factor for these statistics.
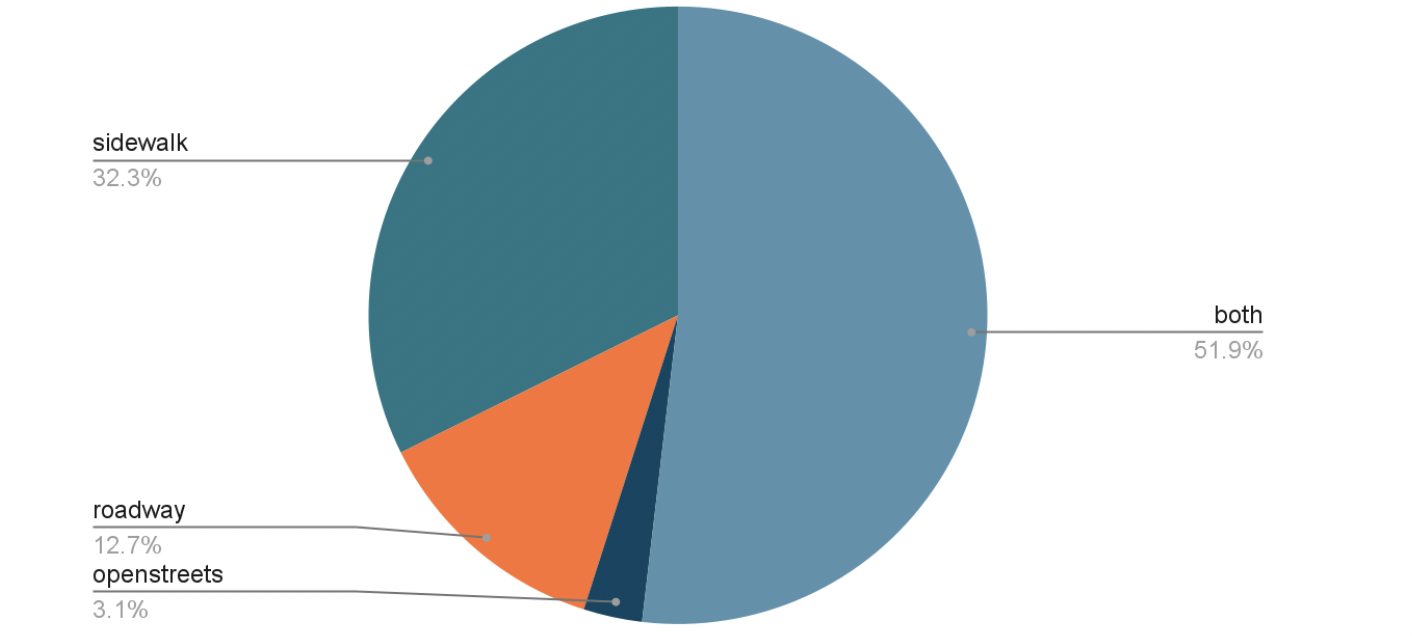

This pie chart displays where restaurants wanted their seating to be located. Here, "both" represents both sidewalk and roadway seating, and has totalled to a 51.9% of interest. Most restaurants are just trying to survive, so they applied for "both" to get anything they could. There are few open streets in our borough. Some are hesitant to take away valuable parking spaces in car-dependent Brooklyn, thus explaining the 3.1% of open street preferences. For restaurants that had very limited seating prior to the pandemic, allowing both sidewalk and roadway seating served to be a benefit to them.
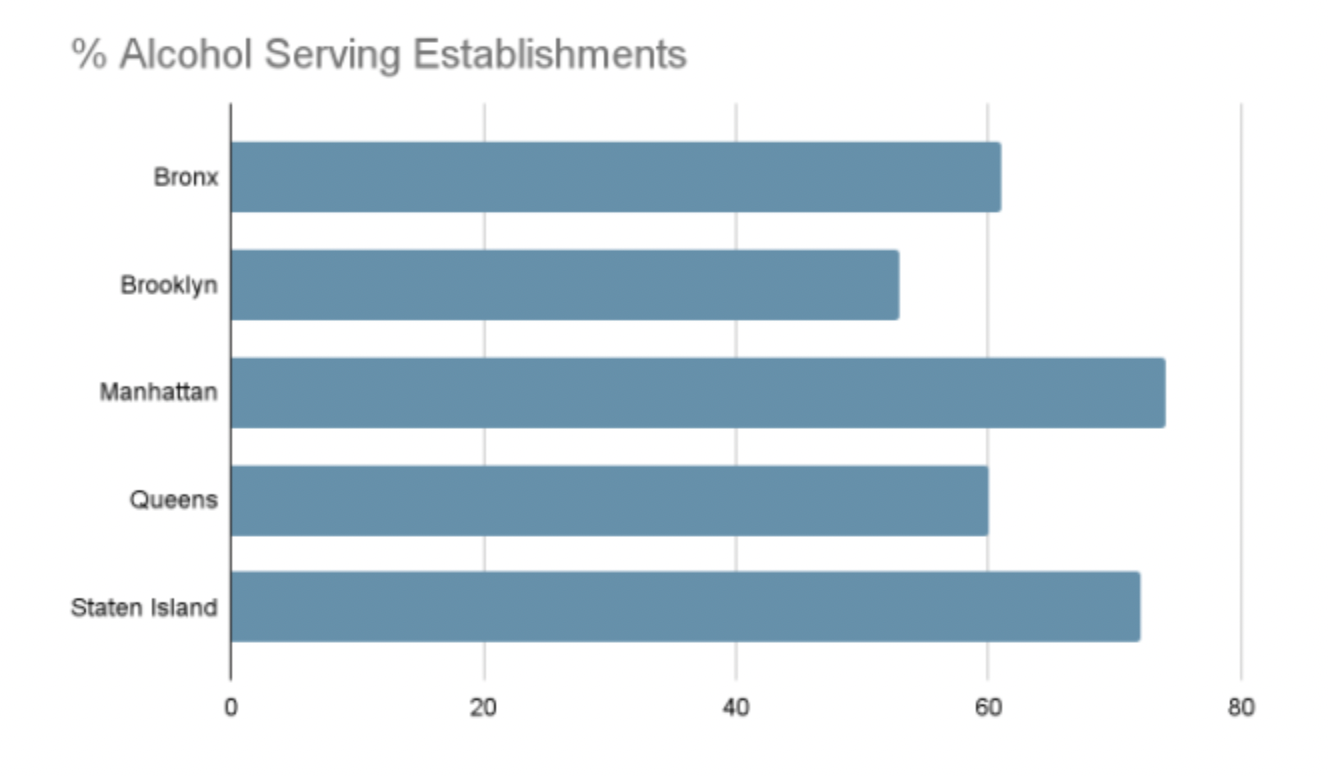
This bar chart shows the proportion of restaurants that serve alcohol to the total number of restaurants in the borough. Brooklyn is average in terms of serving alcohol, but has the lowest percentage out of the 5 boroughs. This data reflects one aspect of safety in Brooklyn, which is that the lower amount of alcohol-serving restaurants can make the neighborhoods safer. Some community boards are keen to preserve the residential character of their neighborhoods, and so they don't approve liquor licenses. Our neighborhoods are also generally family-oriented, primarily Bay Ridge, which could be a reason for Brooklyn’s lowest percentage.