Manual
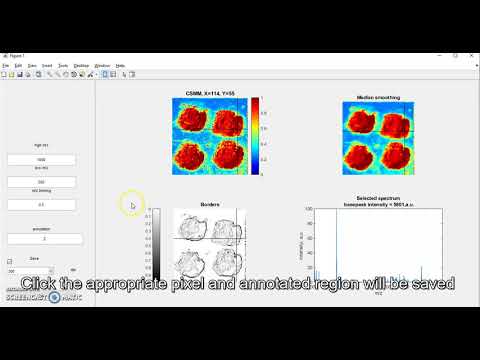
Download all files from https://github.com/EvgenyZhvansky/Interactive_CSMM in any directory Choose the directory as a working directory in MATLAB (R2019b tested).
Run a script using the "CSMM" command in the MATLAB console.
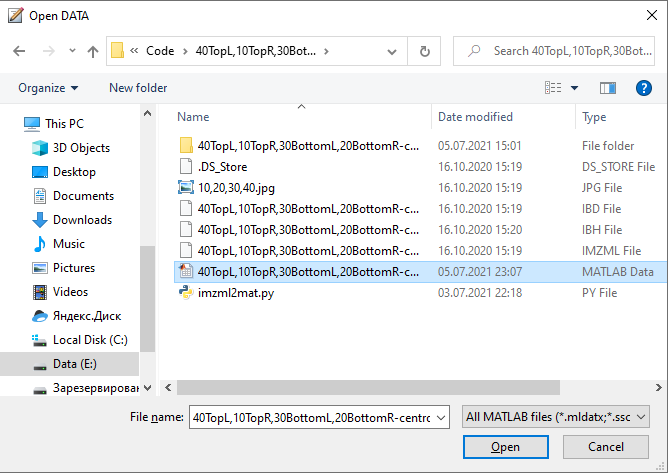
Load .mat file data examples (https://disk.yandex.ru/d/YM13vh6ehGvcFQ). You could prepare your own .mat file from the .imzML file as described in the 16 section of this manual.
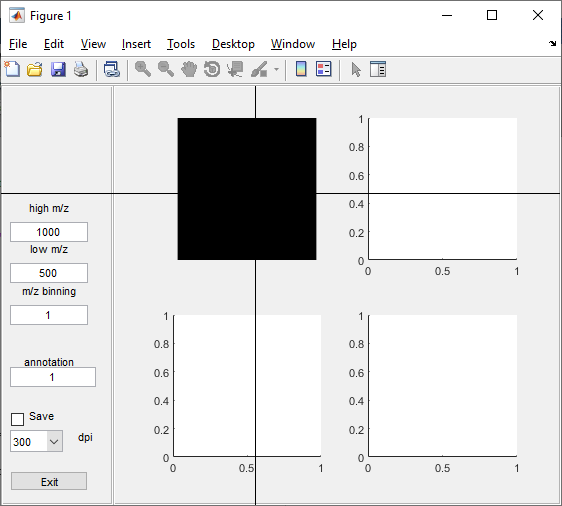
You will see a black CSMM region and empty figures. To build CSMM you should set the first reference pixel by crosshair cursor (click any pixel from the black region).
You can see CSMM on the right panel on the top left figure; CSMM median smoothing on the top right figure. Map of the boundaries of homogeneous regions is on the bottom left figure, and the mass spectrum of the reference pixel is shown on the bottom right (displayed with chosen m/z binning) figure.
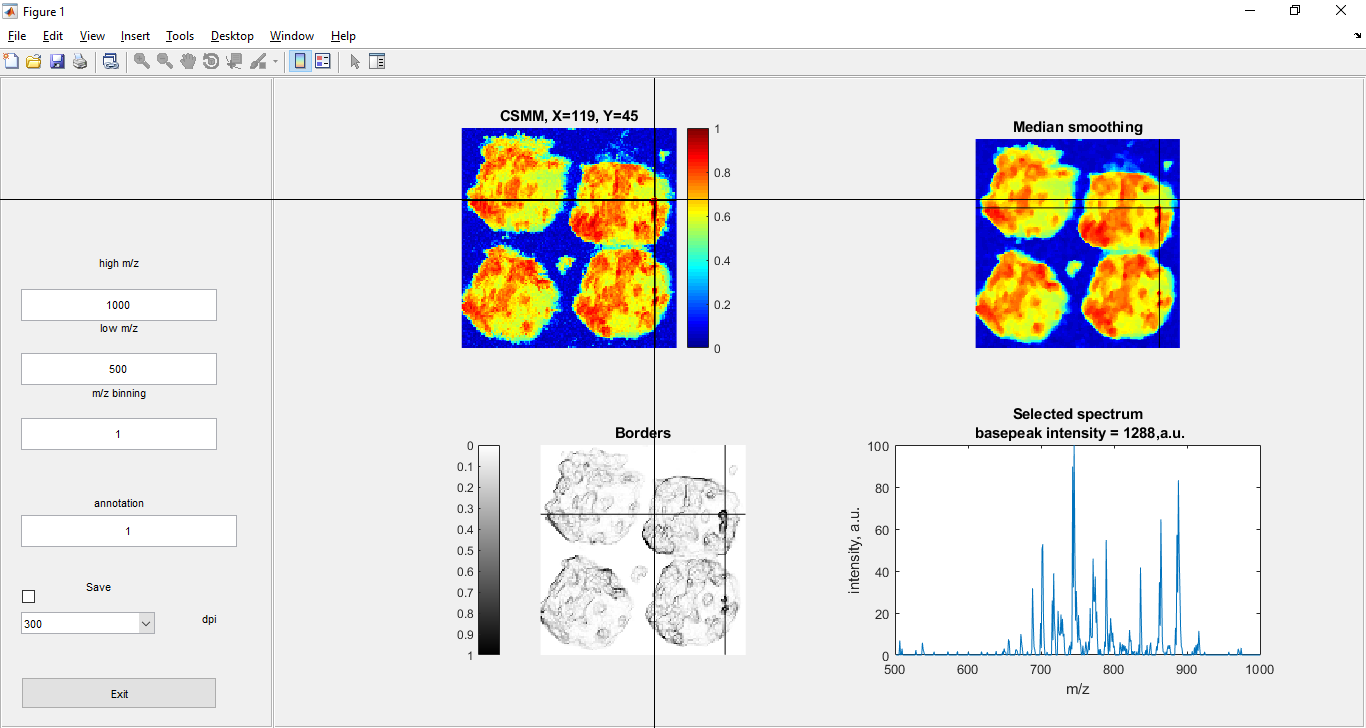
You can change the mass range by putting appropriate values in the “high m/z” and the “low m/z” fields. And choose the “m/z binning” step for your data. Note that the binning step should be smaller than the m/z range value and the min m/z should be smaller than the high m/z. Otherwise, the program corrects input values.
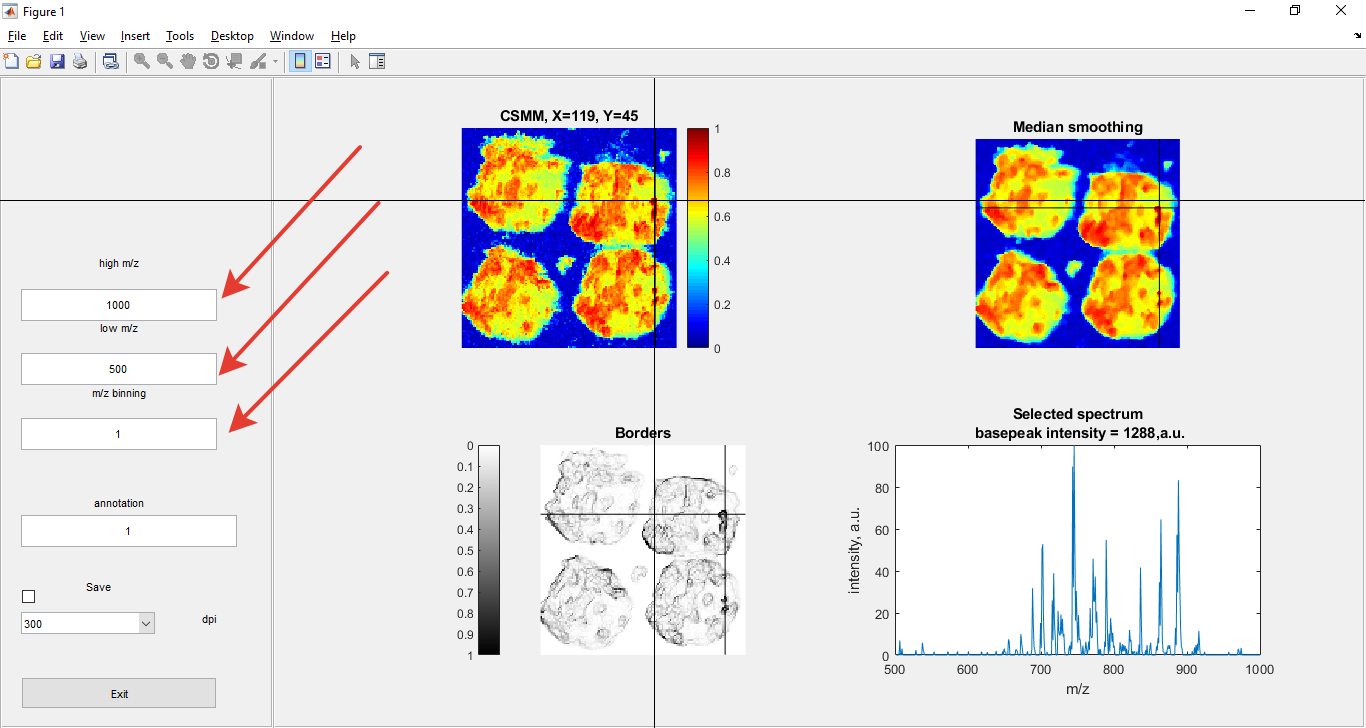 If you put a value for “high m/z” which is lower than the “low m/z” value, the “high m/z” value will turn to “low m/z” + “m/z binning” +1 after the next click.
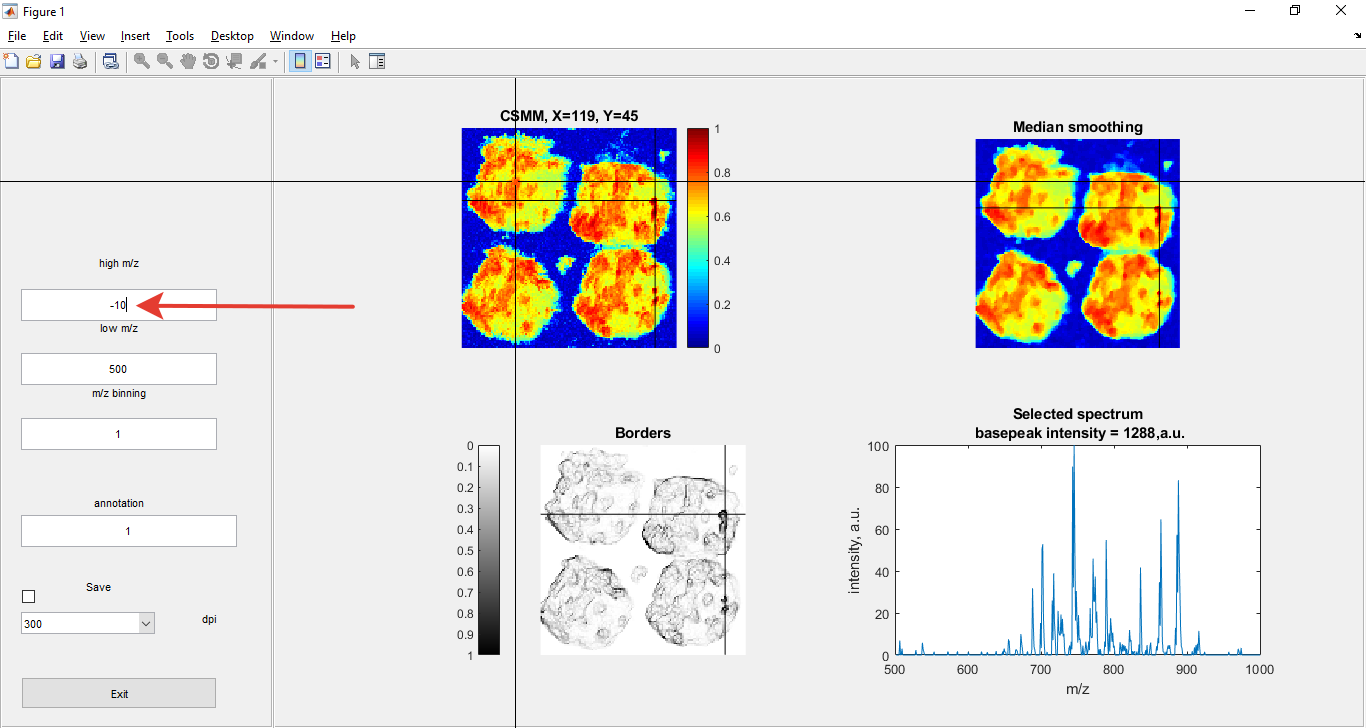
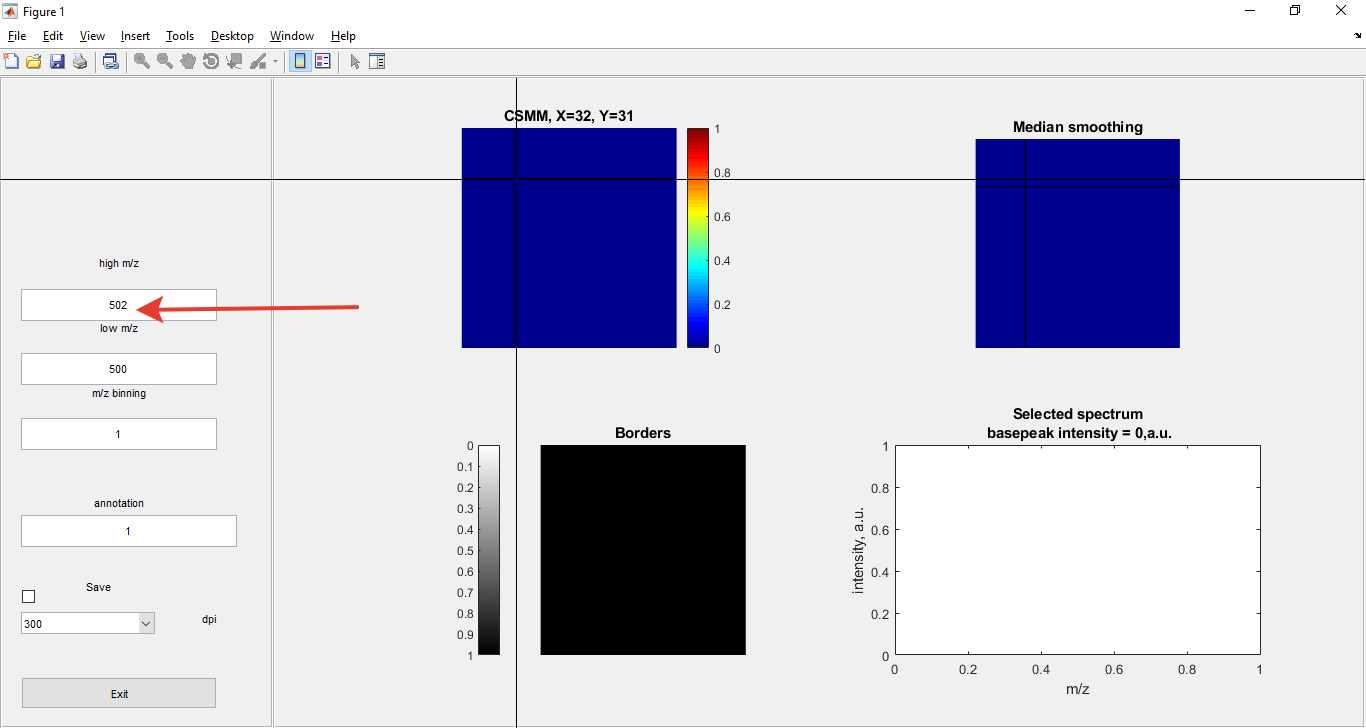
All values can be decimals with a dot as a delimiter.
If you press the Esc button, the previously downloaded .mat file will be loaded again and you will start by choosing the first reference pixel as in step 4.
Annotation. You can match the region and the number, firstly enable saving mode. For this purpose check the box “Save”.
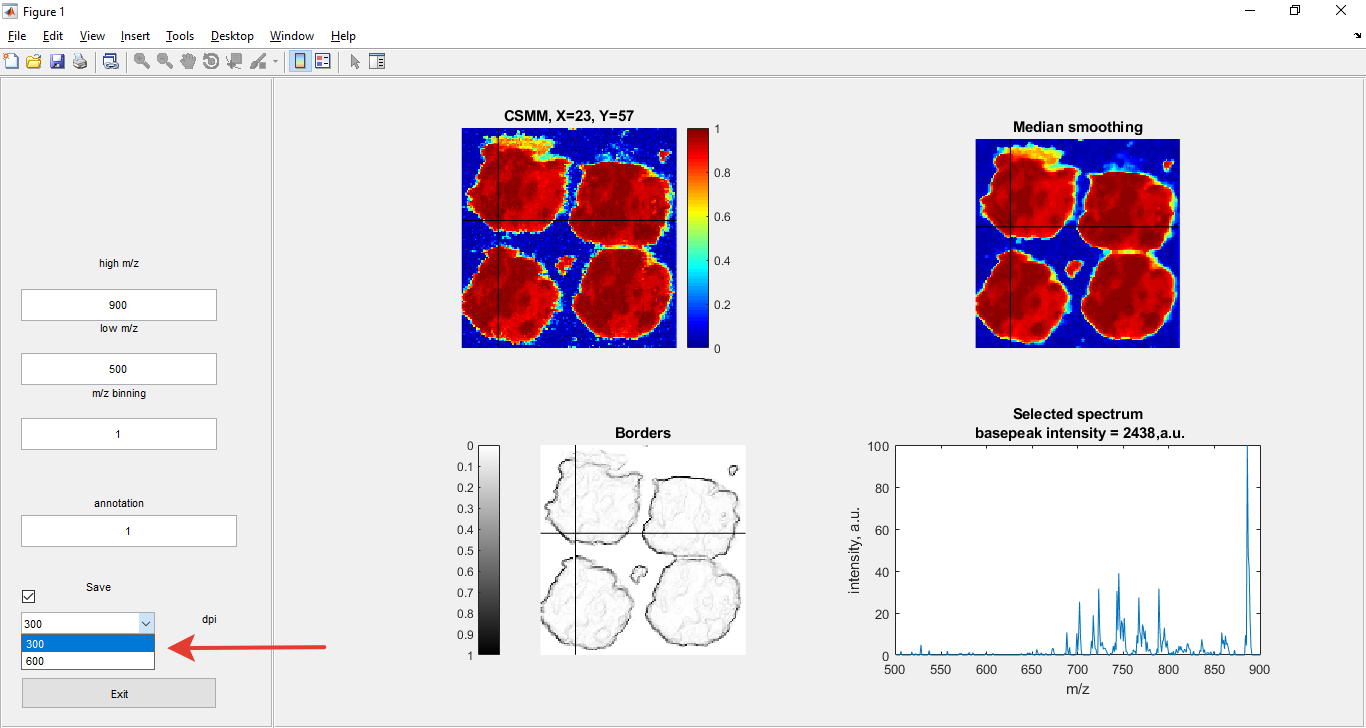
Saving properties Before saving you can choose the quality of an image: 300 or 600 dpi.
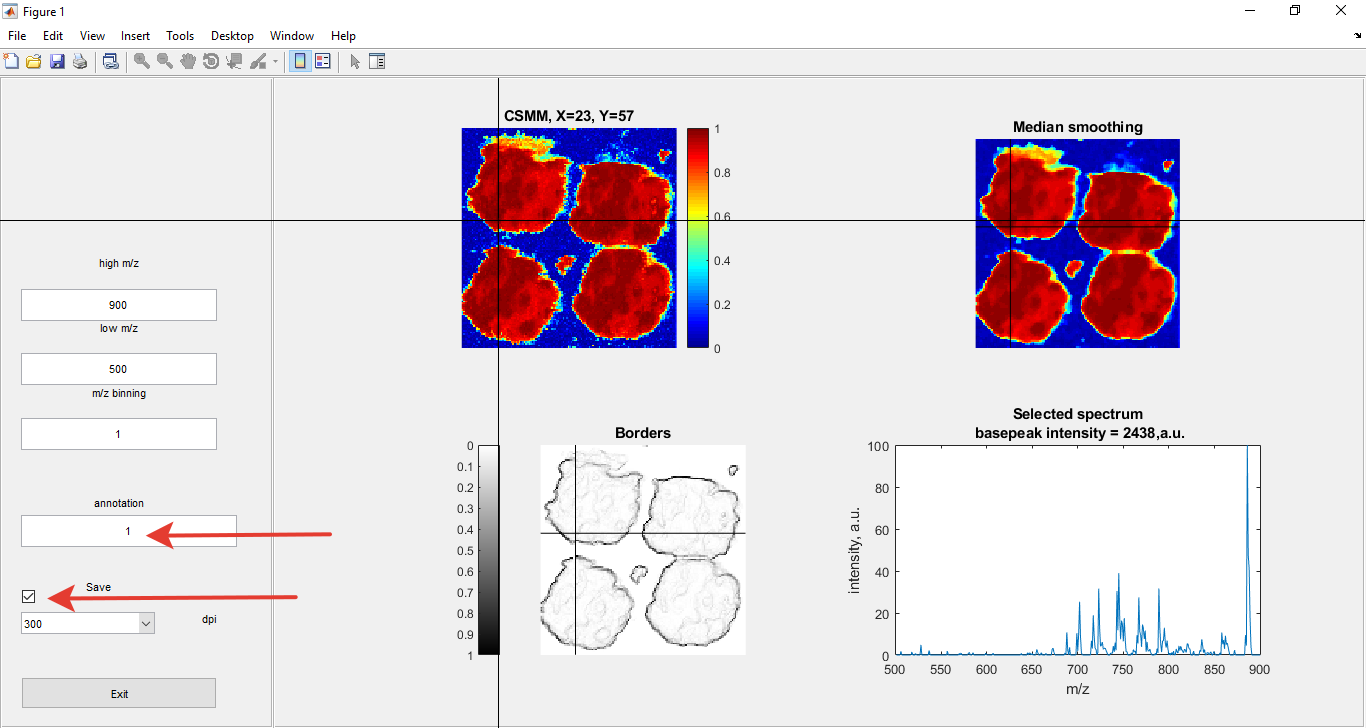
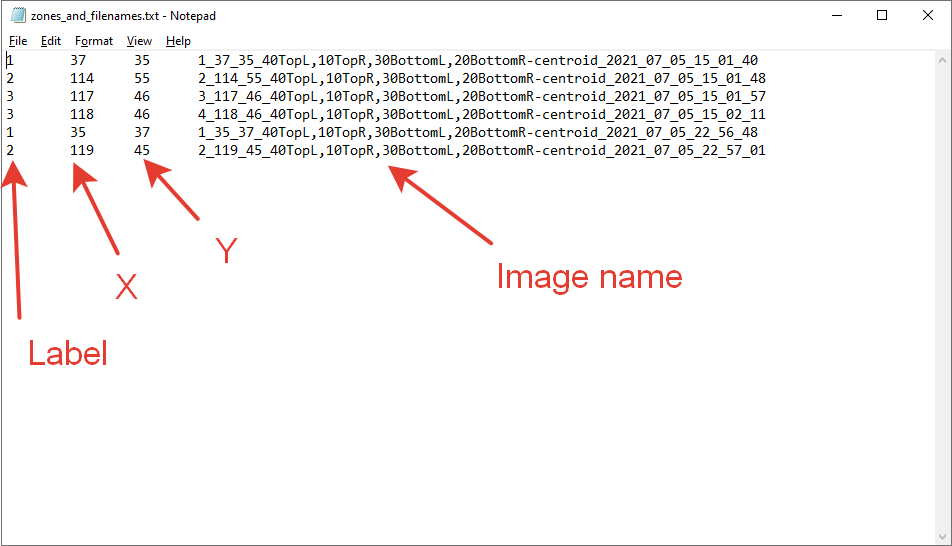
In the “Save” mode after any click at CSMM (choosing a new reference pixel) the screenshot file is saved in the png_maps folder. And the next information adds into the zones_and_filenames.txt file: — assigned zone number — X coordinate — Y coordinate — Screenshot image name (format: number of the click in the current session, X,Y, .mat filename, saving data and time)
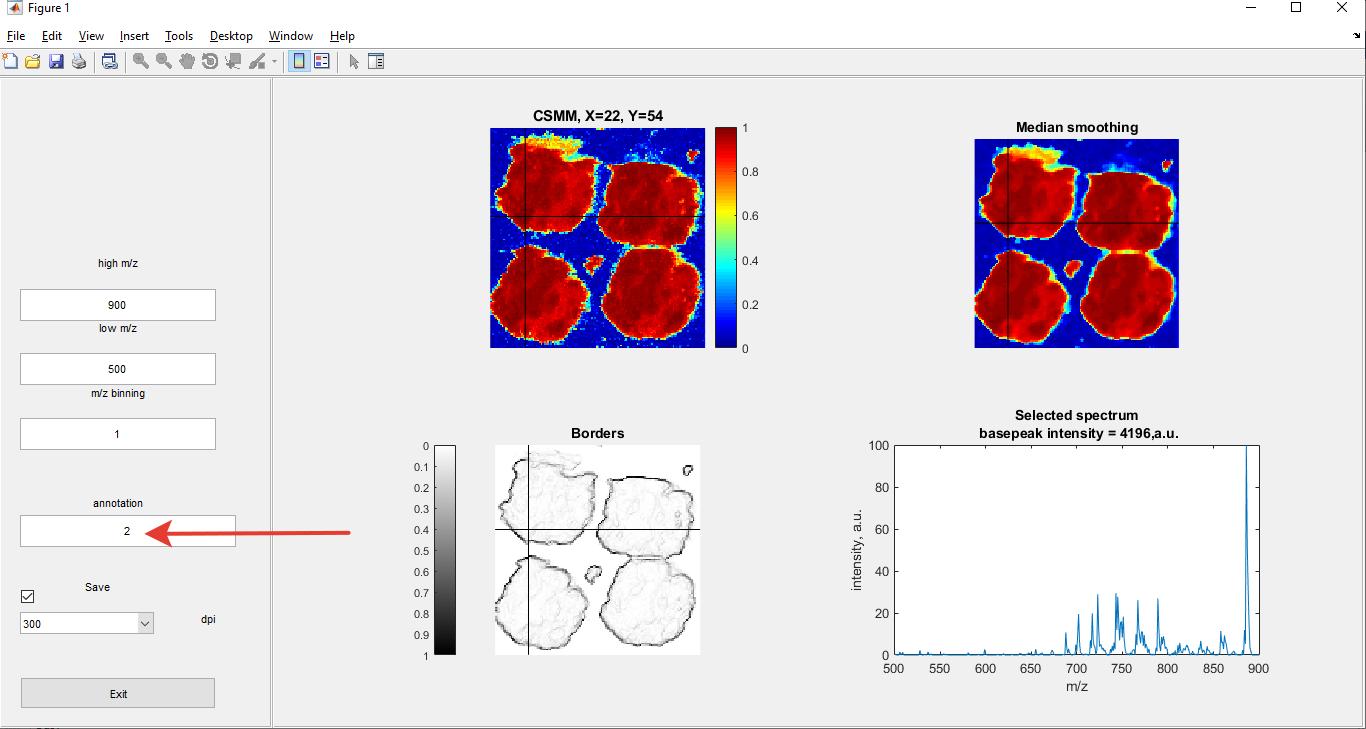
For correct annotation firstly set the zone number,
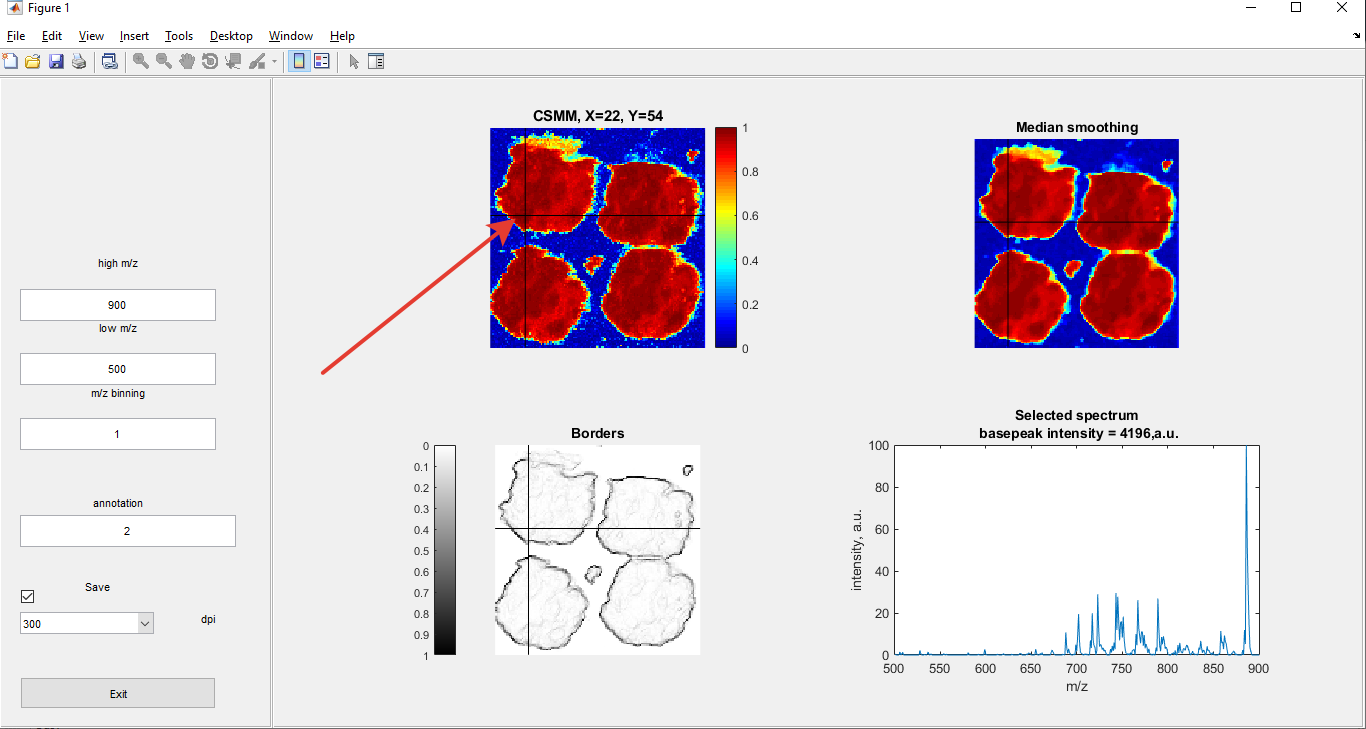
 then click the reference pixel.
The folder containing all the data has the name of the loaded .mat file. This folder is created if it does not exist at first reference pixel choosing, otherwise, the data will be added (appended) to the existing ones. File zones_and_filenames.txt also is appended with new lines if it exists or is created otherwise. If you need to fill the file/files from blank, delete zones_and_filenames.txt or the whole folder.
Also in the “Save” mode after any click at CSMM (choosing a new reference pixel), the .mat file is saved in the mat_files folder. The file names are the same as png files have (see section 9). In these structures in the dot variable X, Y of the reference pixel, assigned zone number, spectrum in the m/z versus intensity format, and CSMM data are saved. You can plot CSMM from the Matlab console, for example, using the “figure, imshow(dot.cosine_map)” command.
In the figure_maps folder, the corresponding .fig files are saved. You can open them by using the built-in Matlab GUI.
You can quit the program using the “Exit” button. You may need to click anywhere inside the window after clicking “Exit” to finish the process.
Create .mat file File imzml2mat.py must be in the containing an imzML file folder. The directory and its subdirectories should not contain any other imzML file. You could load imzML data from an open repository, e.g. here. See the screencast of the creating .mat file here:
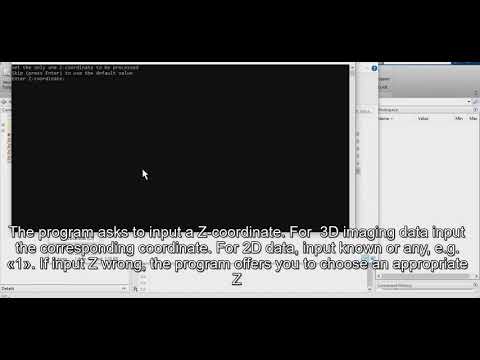
Open imzml2mat.py. The program asks to input a Z-coordinate. If you are going to process 3D imaging data, input the corresponding coordinate. If you have 2D data, input any, e.g. «1» or «0». If you have input the wrong Z-coordinate, the program offers you a list of possible values. After correct input and proper calculations, the program outputs the full name of the created .mat file.
If you have more data points than your operative memory can hold (e.g. you have too large peak-lists in spectra), the program will raise a corresponding error. In this case, you should change your imzML file to have less data, when your mass spectrometer’s proprietary software creates an imzML file. The first option is to set the SNR threshold, the second — use centroids spectrum with an appropriate binning, or the third possibility is to reduce the m/z range.