Home
Please, cite the paper if you use the software.
Mass spectrometry methods are widely used for the analysis of biological and medical samples. Recently developed methods such as DESI, REIMS, NESI allow fast analyses without sample preparation at the cost of higher variability of spectra. In biology and medicine, MS profiles are often used with machine learning (classification, regression, etc.) algorithms and statistical analysis, which are sensitive to outliers and intraclass variability. Here we present SSM Display software, a tool for fast visual outlier detection and variance estimation in mass spectrometric profiles. The tool speeds up the process of manual spectra inspection, improves accuracy and explainability of outlier detection, and decreases the requirements to the operator experience. It allows evaluating the contribution of m/z ranges to the variance of the mass spectra. It was shown that the batch effect could be revealed through SSM analysis and that the SSM calculation can be also used for tuning novel ion sources concerning the quality of obtained mass spectra.
Manual is available here
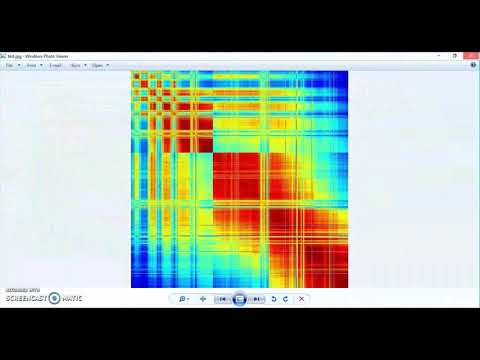
The screencast of the SSM display tool is available here:
Examples of the data are here
Cases of analyses are available here
The last release is available here