
As part of the Data Analyst Associate certification, this project required achieving 100% precision in cleaning and transforming SQL tables, ensuring flawless data integrity across all criteria.
| Column | Name Criteria |
|---|---|
product_id |
Nominal. The unique identifier of the product. Missing values are not possible due to the database structure. |
category |
Nominal. The category of the product, one of 6 values (Housing, Food, Toys, Equipment, Medicine, Accessory). Missing values should be replaced with “Unknown”. |
animal |
Nominal. The type of animal the product is for. One of Dog, Cat, Fish, Bird. Missing values should be replaced with “Unknown”. |
size |
Ordinal. The size of animal the product is for. Small, Medium, Large. Missing values should be replaced with “Unknown”. |
price |
Continuous. The price the product is sold at. Can be any positive value, round to 2 decimal places. Missing values should be replaced with the overall median price. |
sales |
Continuous. The value of all sales of the product in the last year. This can be any positive value, rounded to 2 decimal places. Missing values should be replaced with the overall median sales. |
rating |
Discrete. Customer rating of the product from 1 to 10. Missing values should be replaced with 0. |
repeat_purchase |
Nominal. Whether customers repeatedly buy the product (1) or not (0). Missing values should be removed. |
-- product_id
WITH NumberedRows AS (
    SELECT *, ROW_NUMBER() OVER (PARTITION BY product_id ORDER BY product_id) AS rn
    FROM df
)
SELECT *
FROM NumberedRows
WHERE rn = 1;

-- Category
SELECT
    product_id,
    COALESCE(
        CASE
            WHEN category IN ('Housing', 'Food', 'Toys', 'Equipment', 'Medicine', 'Accessory') THEN category
            ELSE 'Unknown'
        END,
        'Unknown'
    ) AS category
FROM df;

-- Animal
SELECT
    product_id,
    COALESCE(
        CASE
            WHEN animal IN ('Dog', 'Cat', 'Fish', 'Bird') THEN animal
            ELSE 'Unknown'
        END,
        'Unknown'
    ) AS animal
FROM df;

-- Size
SELECT
    product_id,
    COALESCE(
        CASE
            WHEN size IN ('Small', 'Medium', 'Large') THEN size
            ELSE 'Unknown'
        END,
        'Unknown'
    ) AS size
FROM df;

-- Price
WITH MedianPrice AS (
    SELECT PERCENTILE_CONT(0.5) WITHIN GROUP (ORDER BY price) AS median
    FROM df
    WHERE price IS NOT NULL
)
SELECT
    product_id,
    ROUND(COALESCE(price, (SELECT median FROM MedianPrice)), 2) AS price
FROM df;

-- Sales
WITH MedianSales AS (
    SELECT PERCENTILE_CONT(0.5) WITHIN GROUP (ORDER BY sales) AS median
    FROM df
    WHERE sales IS NOT NULL
)
SELECT
    product_id,
    ROUND(COALESCE(sales, (SELECT median FROM MedianSales)), 2) AS sales
FROM df;

-- Rating
SELECT
    product_id,
    COALESCE(
        CASE
            WHEN rating BETWEEN 1 AND 10 THEN rating
            ELSE 0
        END,
        0
    ) AS rating
FROM df;

-- Repeat_purchase
SELECT
    product_id,
    repeat_purchase
FROM df
WHERE repeat_purchase IS NOT NULL
AND repeat_purchase IN (0, 1);We have successfully cleaned the dataset by removing duplicates and replacing null values according to the established criteria. Next, we will merge the findings using the product_id variable as the key index.
SELECT
    c.product_id,
    c.category,
    a.animal,
    s.size,
    p.price,
    sl.sales,
    r.rating,
    rp.repeat_purchase
FROM
    df_category c
    INNER JOIN df_animal a ON c.product_id = a.product_id
    INNER JOIN df_size s ON c.product_id = s.product_id
    INNER JOIN df_price p ON c.product_id = p.product_id
    INNER JOIN df_sales sl ON c.product_id = sl.product_id
    INNER JOIN df_rating r ON c.product_id = r.product_id
INNER JOIN df_repeat_purchase rp ON c.product_id = rp.product_idAfter consolidating all findings, we exported the data into a CSV file named pet_supplies.csv Next, we launched our Python environment to execute the script that generates a visualization addressing the primary objective of the project: illustrating the number of products that are repeat purchases.
import pandas as pd
import matplotlib.pyplot as plt
import seaborn as sns

# Read the CSV file
df = pd.read_csv('pet_supplies.csv')

# Count the number of repeat purchases and non-repeat purchases
repeat_counts = df['repeat_purchase'].value_counts()

# Create a bar plot
plt.figure(figsize=(10, 6))
sns.barplot(x=repeat_counts.index, y=repeat_counts.values)

# Customize the plot
plt.title('Repeat Purchases vs Non-Repeat Purchases', fontsize=16)
plt.xlabel('Repeat Purchase', fontsize=12)
plt.ylabel('Number of Products', fontsize=12)
plt.xticks([0, 1], ['Non-Repeat', 'Repeat'], fontsize=10)

# Add value labels on top of each bar
for i, v in enumerate(repeat_counts.values):
    plt.text(i, v, str(v), ha='center', va='bottom', fontsize=12)

# Add a legend
plt.legend(['Number of Products'], loc='upper right')

# Show the plot
plt.tight_layout()
plt.show()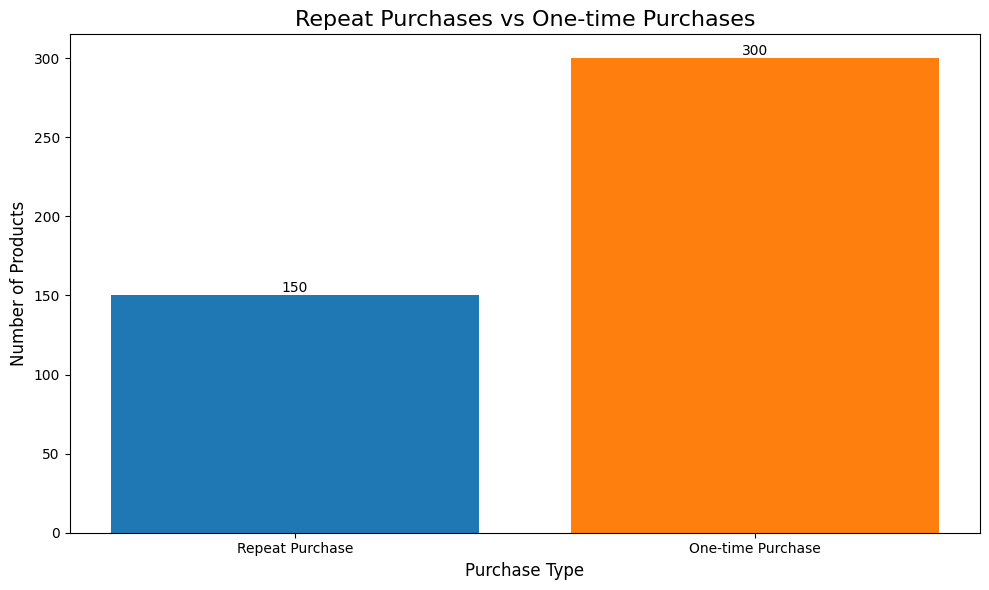
The bar chart titled "Repeat Purchases vs One-time Purchases" visually compares the number of products by purchase type. The x-axis represents the purchase type, while the y-axis shows the number of products, ranging from 0 to 300. The blue bar for Repeat Purchases indicates 150 products, and the orange bar for One-time Purchases shows 300 products. Each bar is labeled with its corresponding value for clarity, providing a clear comparison of product purchase behavior.
I hope this project case study has been helpful to you. I appreciate your time reviewing my code and would greatly value any feedback you may have. Thank you!