One command, and you are watching your GPUs.
uvx labwatch-liteOpen http://localhost:8123 — no clone, no npm, no configuration.
English · 简体中文





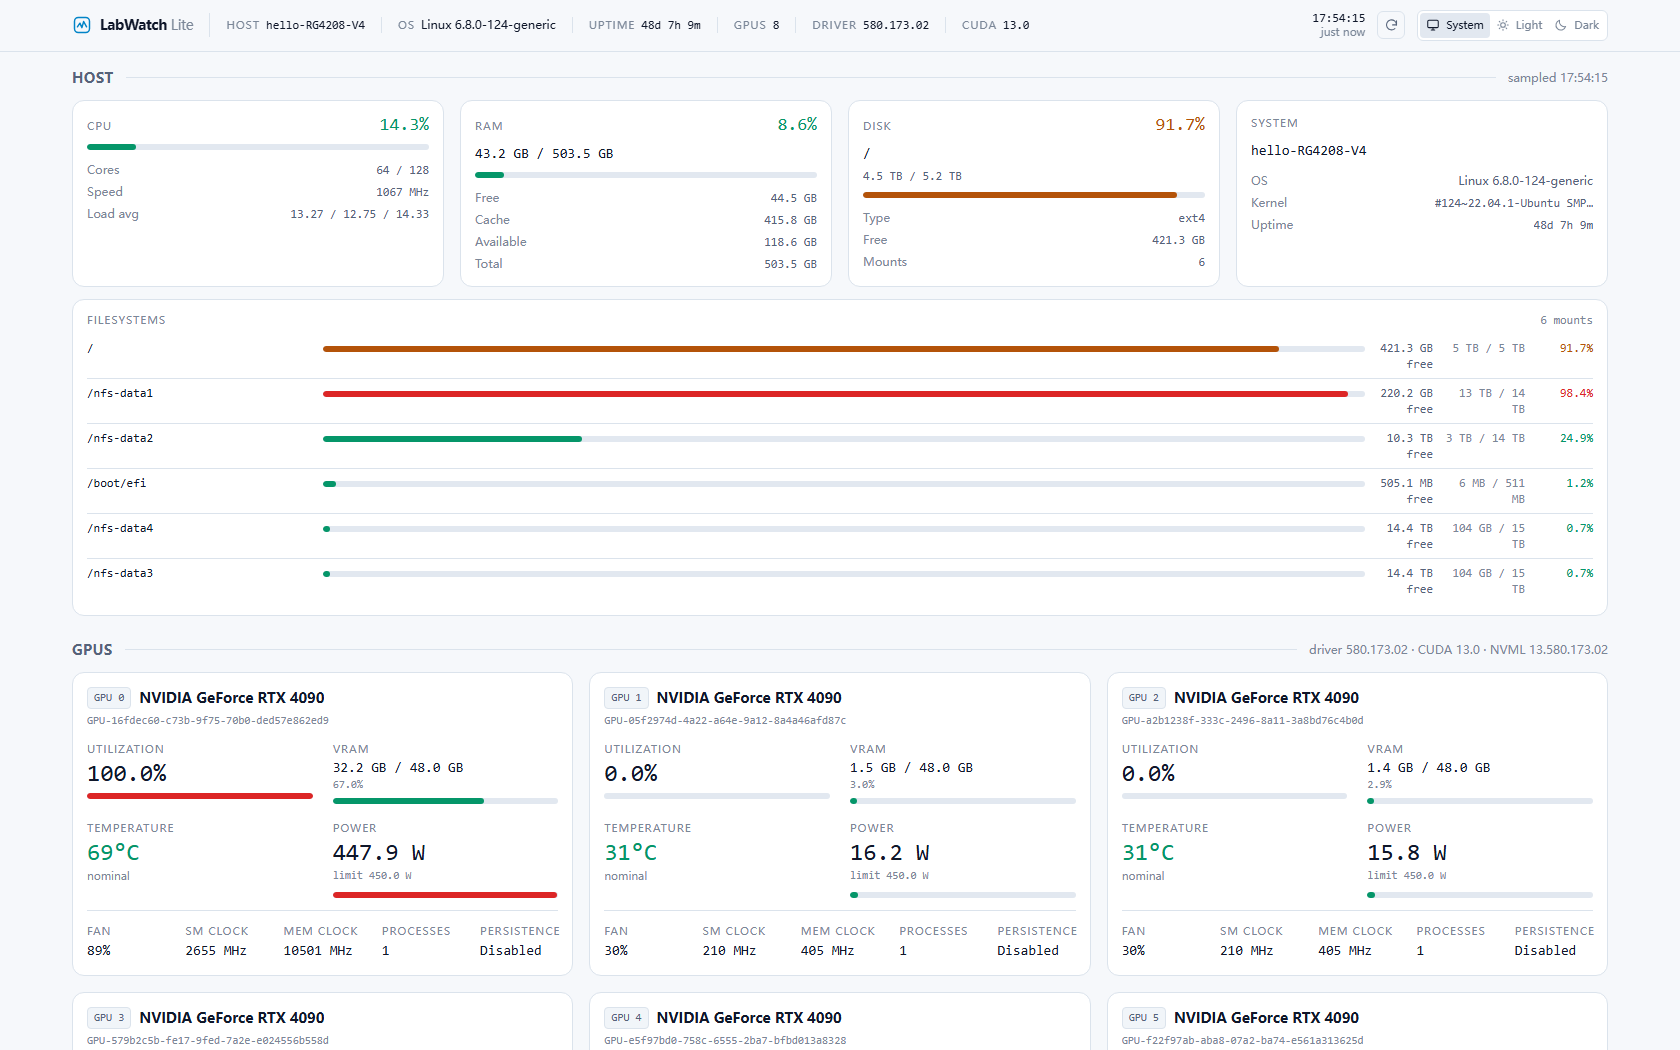
One command, nothing to configure:
uvx labwatch-liteThat is the whole install. uvx fetches LabWatch, starts it, and opens the dashboard.
Prefer a permanent command? Any of these work:
uv tool install labwatch-lite   # then: labwatch
pipx install labwatch-lite      # then: labwatch
pip install labwatch-lite       # then: python -m labwatch
Why the package is called
labwatch-litebut the command islabwatchThe name
labwatchon PyPI belongs to an unrelated project (rbretschneider/labwatch_cli), so this project publishes under the distribution namelabwatch-liteto avoid silently installing someone else's tool. The import package and the console command both remainlabwatch; only the name you type intopip/uvx/pipxdiffers. Installing plainlabwatchfrom PyPI will give you the other project, not this one.
No NVIDIA GPU yet? Explore the UI with synthetic data:
uvx labwatch-lite --demolabwatch # start and open the dashboard
labwatch --port 8124 # a different port
labwatch --demo # synthetic GPUs, no hardware needed
labwatch doctor # can this machine run LabWatch?
labwatch start --background # run it in the background
labwatch status # is it running, and what are the GPUs doing
labwatch stop # stop the background instance
labwatch open # open the dashboard againlabwatch doctor is the answer to "why is it not working":
LabWatch Doctor

✓ Python — 3.12.7
✓ Dependencies — 7 runtime packages importable
✓ NVML — available (driver 580.173.02)
✓ GPUs — 8 detected
  8 × NVIDIA GeForce RTX 4090
✓ Port — 127.0.0.1:8123 available
✓ Database — /home/you/.local/share/labwatch
✓ Dashboard — bundled (640 KB)

✓ Ready — 8 GPUs available.
labwatch status is the one-liner:
LabWatch 1.1.0
  gpu-node-01  ·  http://127.0.0.1:8123

  4 busy / 8 GPUs  ·  4 free  driver 580.173.02

  GPU 0  NVIDIA GeForce RTX 4090    98.4%      33 GB / 48 GB   67°C   448 W  busy
  GPU 1  NVIDIA GeForce RTX 4090     0.0%       1 GB / 48 GB   31°C    16 W  free

  CPU 9%  ·  RAM 9%  ·  8 GPU processes
--json on status and doctor gives machine-readable output, which is what the
VS Code extension consumes.
A lightweight extension puts the GPU state where you are already looking.
- Status bar:
GPU 4 busy / 8orGPU 0 98% · 33/48GB, refreshed on an interval. - LabWatch sidebar: one compact card per GPU — utilisation, VRAM, temperature.
- Open Full Dashboard: jumps to the web UI for history, processes and charts.
It works locally and over Remote-SSH: the extension runs in the remote workspace, sees the remote GPUs, and VS Code forwards the dashboard port to your browser automatically. LabWatch is never reimplemented inside the editor — the extension is a view onto the same collector.
See vscode-extension/README.md to build it,
or install the packaged labwatch-gpu-status-1.4.0.vsix with
code --install-extension. The Marketplace listing is in review.
No separate install step. The collector is a small Python program. If you already
run one — any labwatch on PATH, or a conda environment — the extension finds it
and installs nothing. Otherwise it offers to build a private environment inside its
own storage folder, with no global installs and no PATH edits, and uses PyPI or
your own mirror via labwatch.pipIndexUrl. · 无需单独安装:采集器是个小型 Python
程序。若机器上已有(PATH 上的 labwatch,或 conda 环境里的),扩展会直接使用、不做任何
安装;否则它会在自己的存储目录里创建私有环境,不写全局、不改 PATH,包源用 PyPI 或你通过
labwatch.pipIndexUrl 指定的镜像。
| GPU telemetry | Utilisation, VRAM, temperature, power (with its limit), fan, SM/memory clocks, persistence mode, process count for every NVIDIA device. |
| GPU processes | NVML compute PIDs joined to OS process data: user, full command line, CPU %, resident memory, runtime. Cross-user on a shared server. |
| Host telemetry | CPU (usage, cores, frequency, load average), RAM, every real filesystem, hostname, OS, kernel, uptime. |
| History | CPU, RAM, disk, GPU utilisation, VRAM, temperature and power persisted to SQLite, charted over1H / 6H / 24H. |
| Process table | Sort any numeric column, filter by GPU, search across PID, name, command and user. |
| Graceful degradation | No driver, no GPU, an unsupported sensor or a process that exits mid-query showsN/A — never a broken page. |
| Themes | System / Light / Dark, applied before first paint. |
| Read-only | LabWatch never starts, stops or signals a workload. |
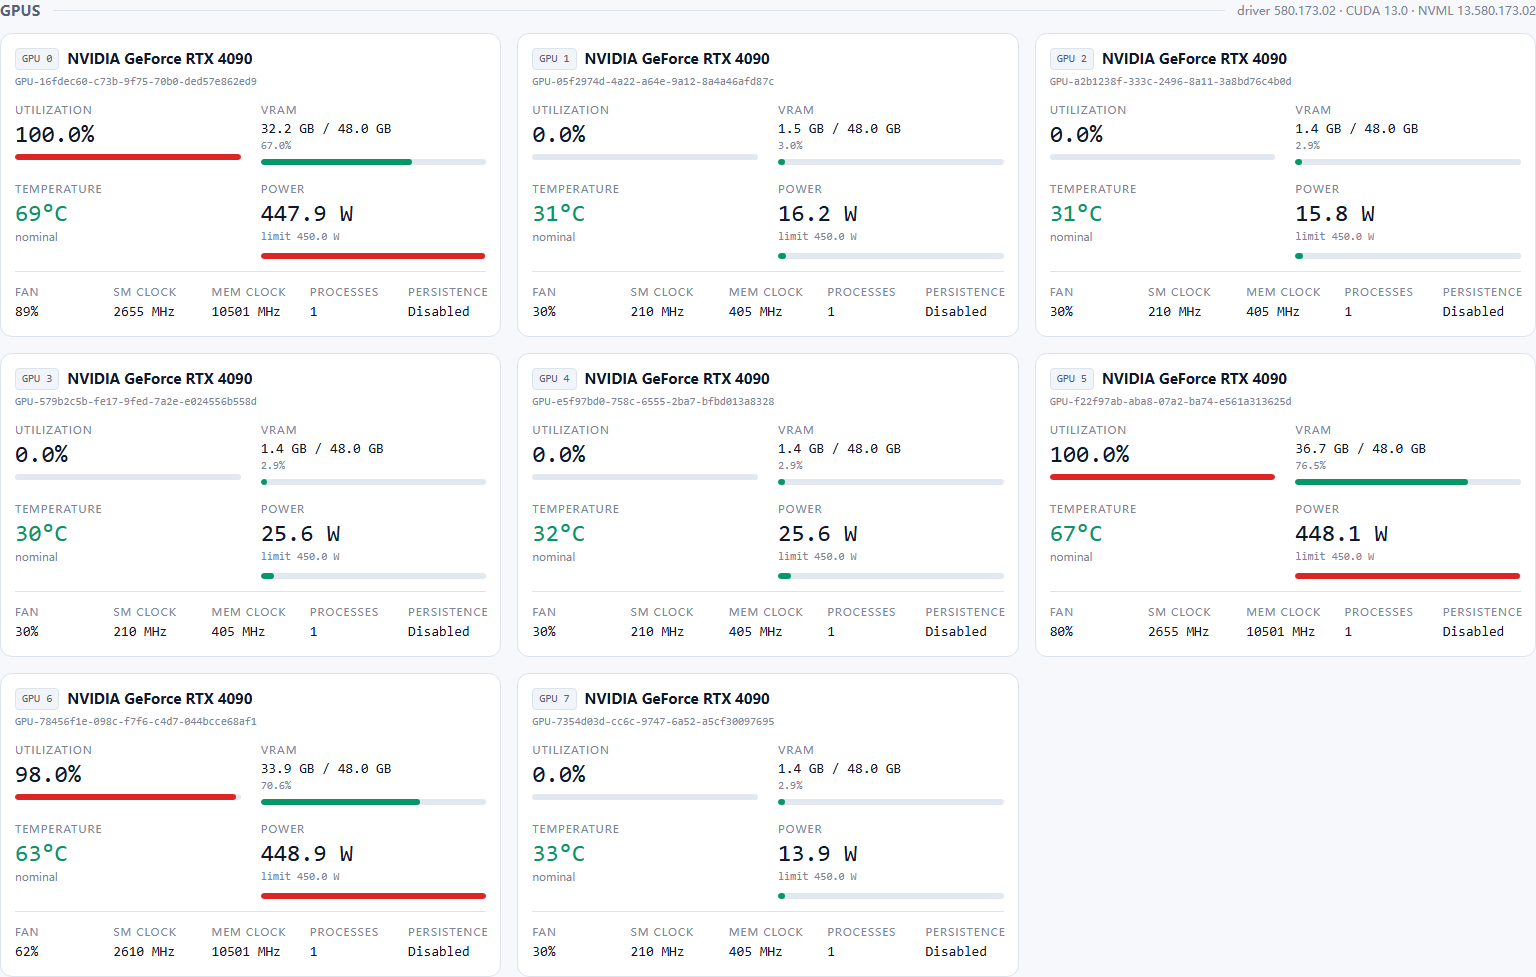 One card per GPU — eight RTX 4090s under live load |
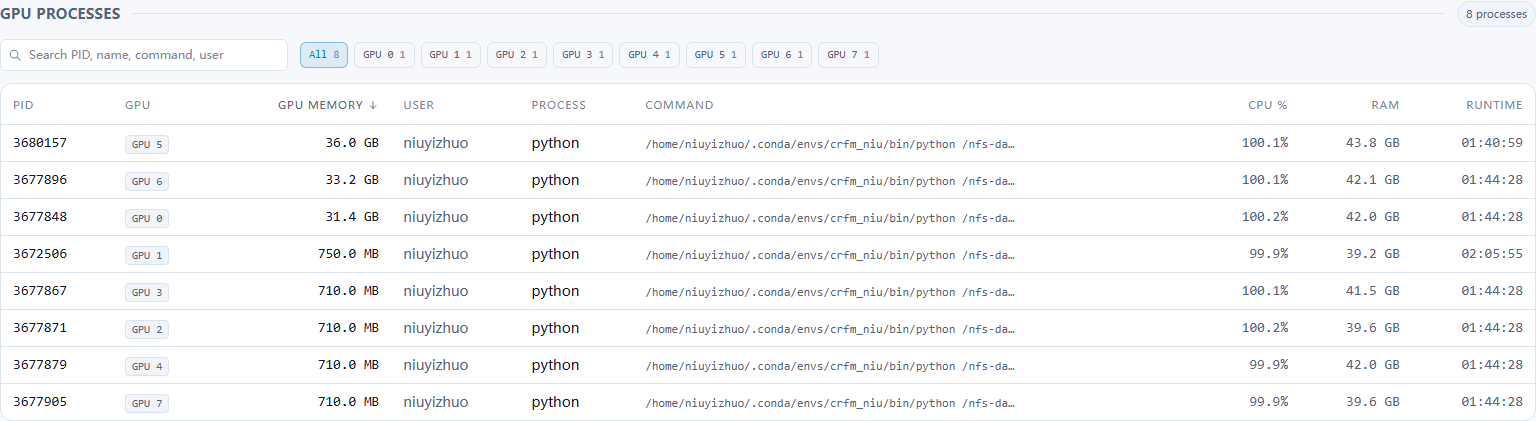 GPU processes — sortable, filterable, searchable |
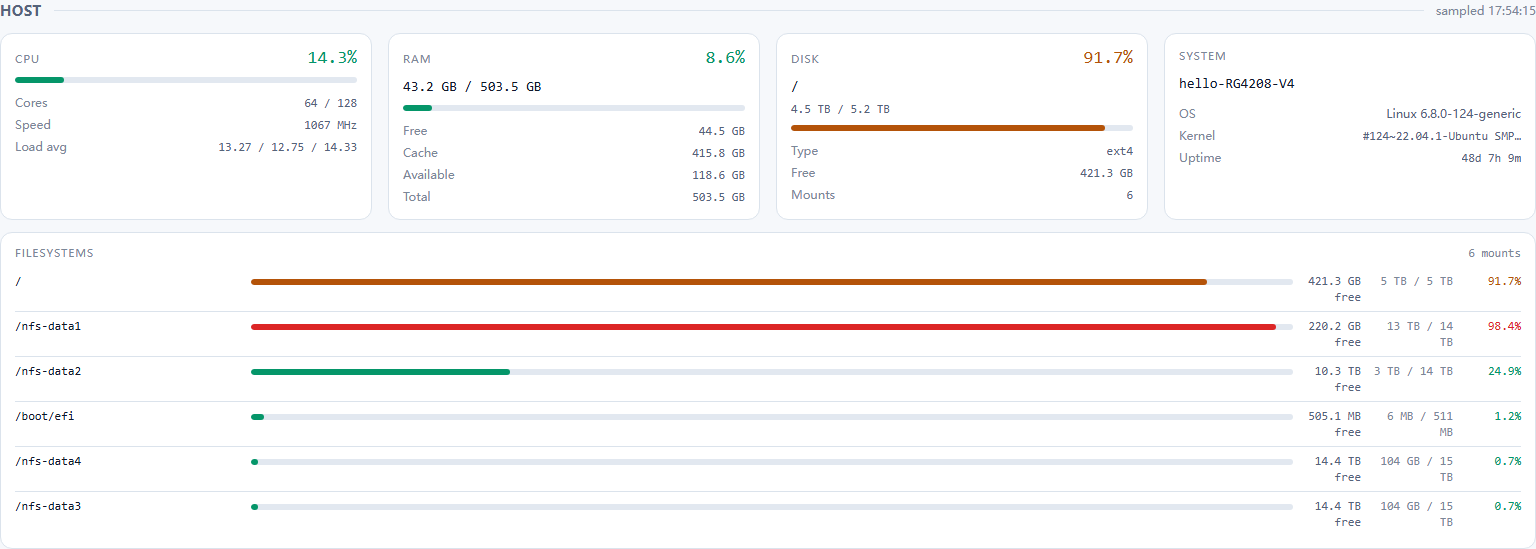 Host overview — CPU, RAM, every filesystem |
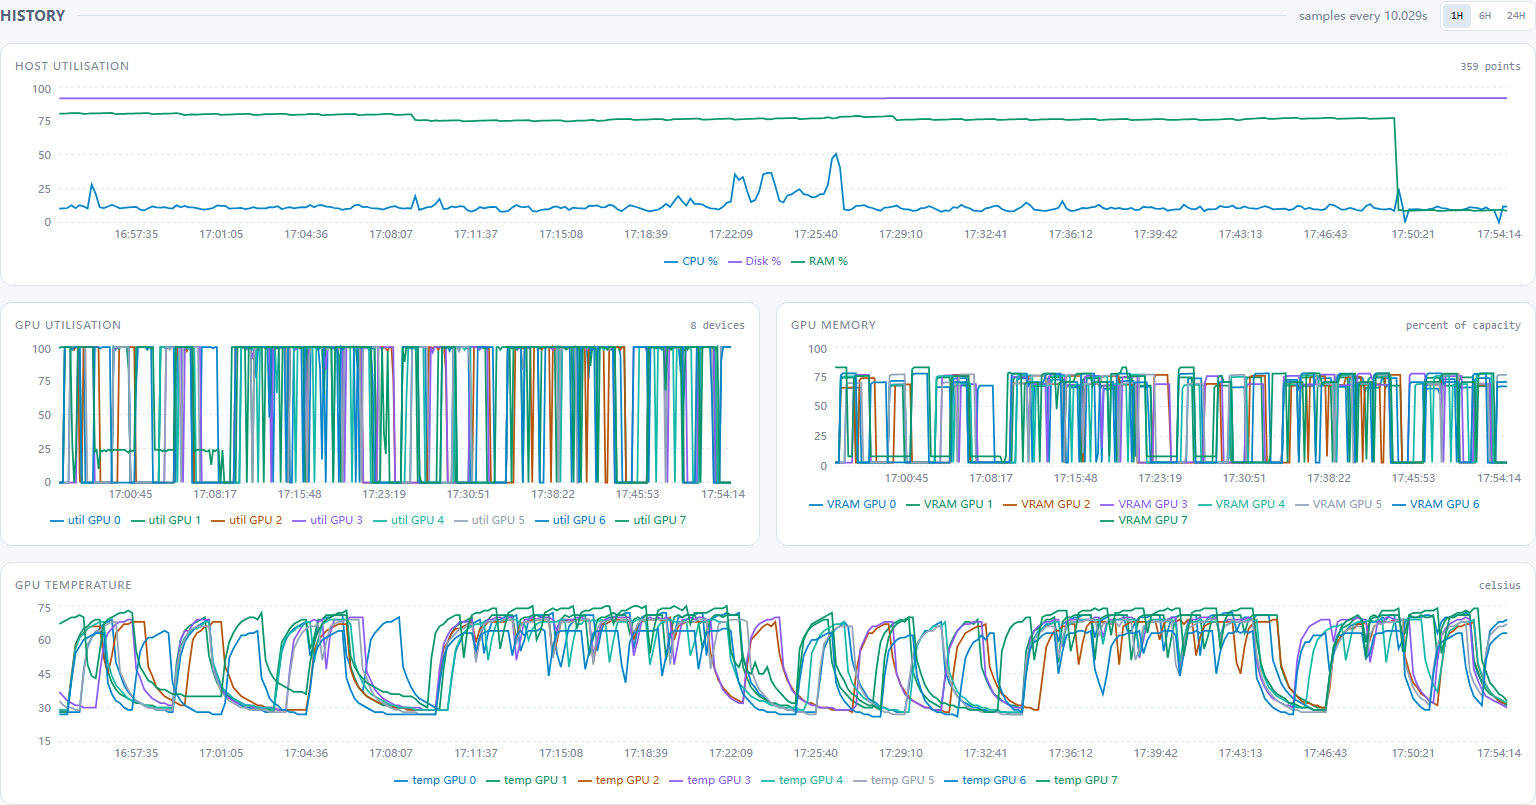 History — 1H / 6H / 24H |
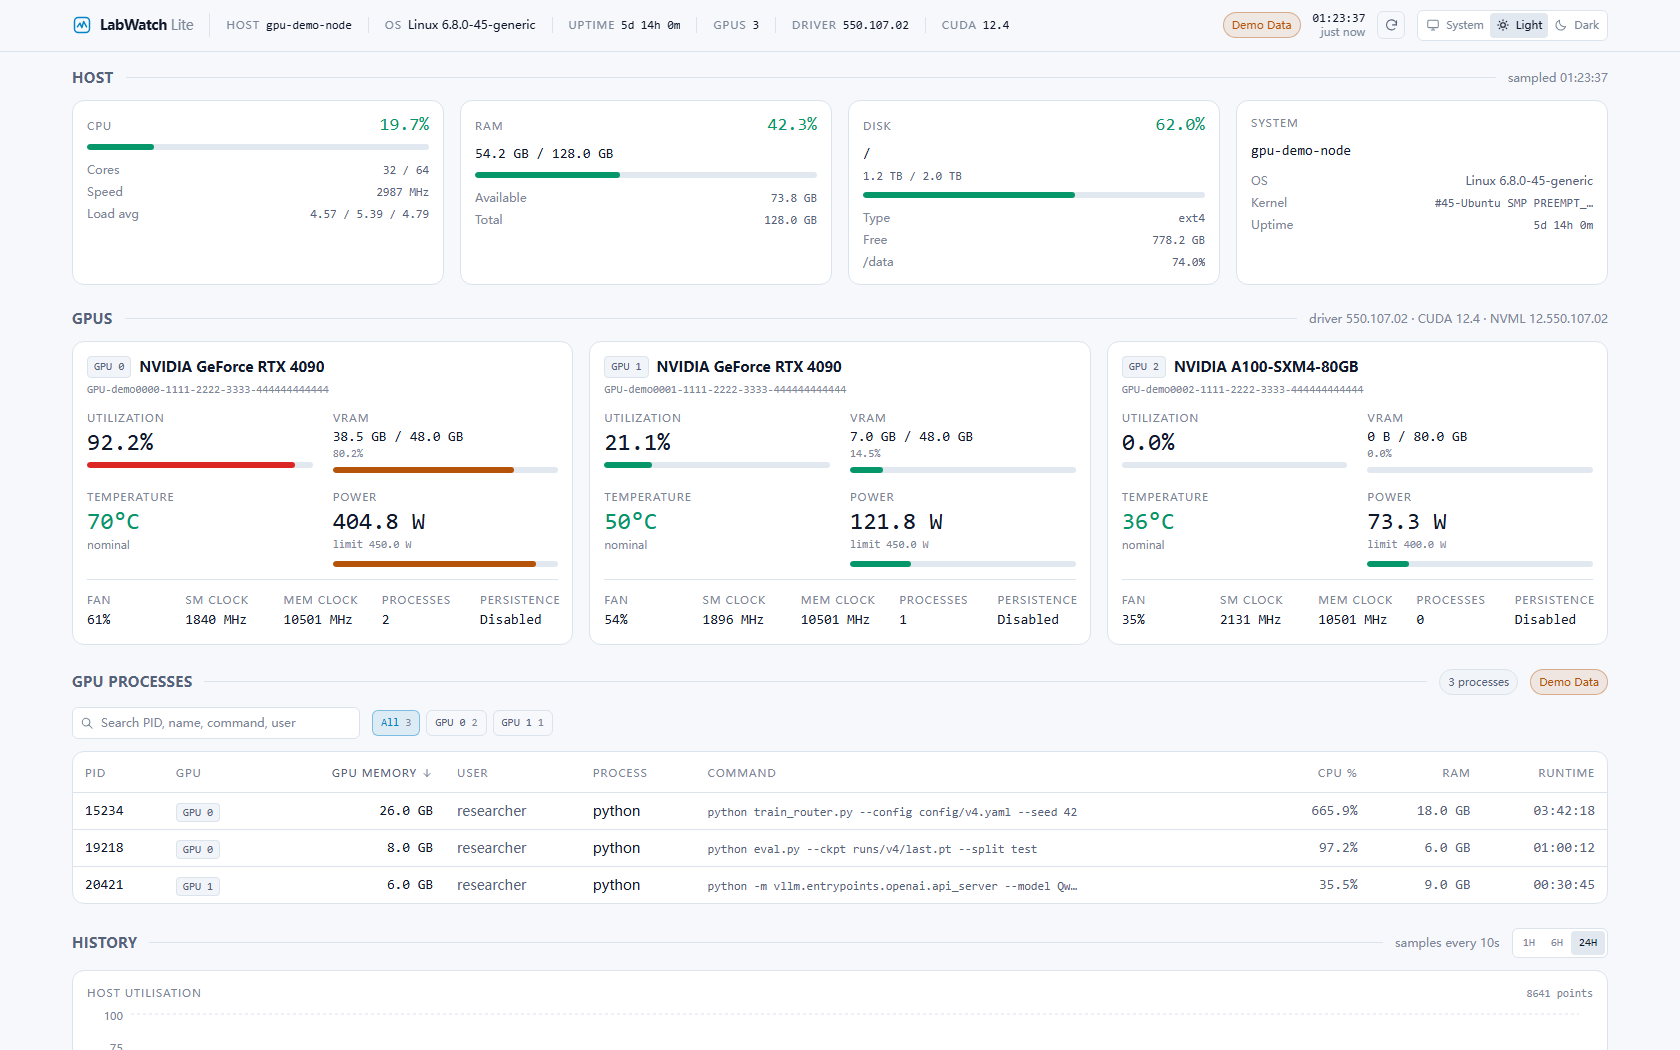 Light theme — same information density |
|
Everything is an environment variable with the LABWATCH_ prefix; the full list
is in .env.example.
The common ones:
| Variable | Default | Purpose |
|---|---|---|
LABWATCH_PORT |
8000 |
Port to serve on (8123 through the labwatch CLI). |
LABWATCH_HOST |
0.0.0.0 |
Bind address. Use127.0.0.1 to keep it local. |
LABWATCH_DATA_DIR |
platform data dir | Wherelabwatch.db lives. |
LABWATCH_POLL_INTERVAL |
2 |
Live refresh interval, seconds. |
LABWATCH_HISTORY_INTERVAL |
10 |
History write interval, seconds. |
LABWATCH_RETENTION_HOURS |
24 |
How long history is kept. |
LABWATCH_DEMO_MODE |
false |
Synthetic data, labelledDemo Data. |
LABWATCH_INCLUDE_ALL_MOUNTS |
true |
Report every real filesystem, not just/. |
LABWATCH_COLLECT_COMMANDS |
true |
Resolve full process command lines. |
LABWATCH_PROCESS_LIMIT |
64 |
GPU processes enriched per sample. |
LABWATCH_INCLUDE_GRAPHICS_PROCESSES |
false |
Also list graphics contexts. Noisy on Windows desktops. |
LABWATCH_STATIC_DIR |
(bundled dashboard) | Serve a different pre-built frontend, e.g. in Docker. |
The quick start above uses the CLI's defaults (127.0.0.1:8123). labwatch
sets these variables for the server it starts; running labwatch serve or the
server module directly uses the defaults in the table.
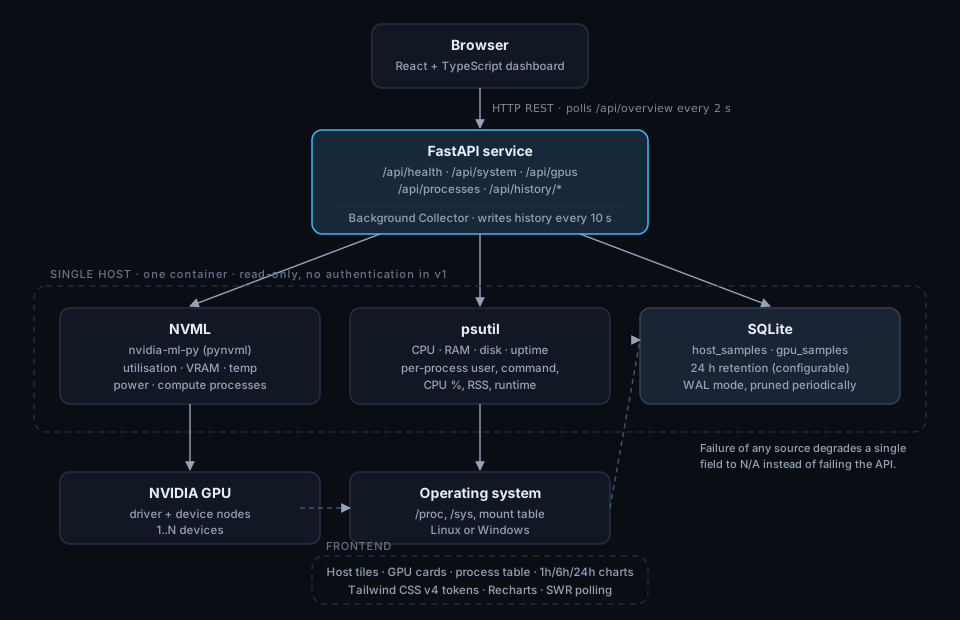
One process, one host, three data sources: NVML for GPU telemetry and compute
process IDs, psutil for host metrics and process enrichment, SQLite for
history. The dashboard polls /api/overview, so a refresh is a single round trip,
and polling pauses while the tab is hidden.
The built dashboard ships inside the Python package, which is why uvx labwatch-lite
needs no Node toolchain. v1 deliberately has no WebSockets, no queue, no cache
layer and no authentication: at a two second refresh they would add operational
surface without changing the experience.
labwatch/
├── labwatch/                 # the Python package
│   ├── cli/                  # labwatch doctor / status / start / stop
│   ├── server/               # FastAPI app, collectors, services
│   └── ui/                   # the built dashboard, shipped in the wheel
├── vscode-extension/         # status bar, sidebar, open-dashboard
├── docker-compose.yml        # server deployment option
└── docs/                     # report, acceptance checklist, screenshots
Docker is the right answer for a shared server, not for a laptop:
docker compose up -dGPU access needs the NVIDIA Container Toolkit on the host. Without a GPU the container still monitors CPU, RAM and disk.
git clone https://github.com/Galaxy-Chjs/LabWatch.git
cd labwatch
pip install -e ".[dev]"
labwatch --demo
The dashboard is committed under labwatch/ui, so a source checkout needs no npm
either. Only rebuild it if you change the frontend:
cd frontend && npm install && npm run build # writes into labwatch/uiInteractive documentation is at /api/docs.
| Endpoint | Returns |
|---|---|
GET /api/health |
Service, database, NVML and collector state. |
GET /api/overview |
System + GPUs + processes in one payload. |
GET /api/system |
Host CPU, memory, filesystems, uptime. |
GET /api/gpus |
Every GPU, includingavailable/error when NVML is unusable. |
GET /api/processes |
GPU processes;?gpu_index=1 filters to one device. |
GET /api/history/system?range=1h |
Host history;range is 1h, 6h or 24h. |
GET /api/history/gpus |
GPU history for all devices. |
curl -s localhost:8123/api/overview | jq '.gpus.gpus[] | {index, utilization_percent, temperature_c}'pip install -e ".[dev]"
pytest # 179 backend tests
ruff check labwatch tests
cd frontend
npm run test # 77 frontend tests
npm run e2e # 8 Playwright tests, starts its own demo backend
cd ../vscode-extension
npm install && npm run compile && npm test # 34 extension testsCI additionally verifies that labwatch/ui matches the frontend sources, that the
wheel contains and serves the dashboard, and that the Docker image comes up
healthy.
Package hatchling · console-script entry point · standard-library-only CLI Backend Python 3.10+ · FastAPI · pydantic-settings · psutil · nvidia-ml-py · SQLAlchemy 2 · SQLite · pytest Frontend React 19 · TypeScript (strict) · Vite · Tailwind CSS v4 · Recharts · SWR · Vitest · Testing Library Editor VS Code extension (TypeScript) Deployment Docker (multi-stage) · Docker Compose · GitHub Actions
- Single host. LabWatch monitors the machine it runs on.
- No authentication. Intended for trusted private networks; process command lines can be sensitive. Use a reverse proxy if you must expose it.
- NVIDIA only. AMD and Intel GPUs are not read.
- Graphics contexts on Windows are noisy; compute processes are the default.
- Load average is
N/Aon Windows, which does not expose it. - The VS Code extension is not on the Marketplace yet. It is built, tested and
packages cleanly; see
vscode-extension/README.mdto install it from source.
- VS Code extension on the Marketplace
- Prometheus
/metricsexport - Threshold alerts (VRAM, temperature, disk) with webhook delivery
- Multi-host aggregation
docs/PROJECT_REPORT.html— consolidated report (English + 中文): features, architecture, test results, every bug found and fixed, release readiness.docs/ACCEPTANCE.md— acceptance checklist with measured results, including the 8-GPU server validation.- docs/RELEASING.md — what a human has to do: GitHub, PyPI (so
uvx labwatch-liteworks) and the VS Code Marketplace.
LabWatch is intended for trusted private networks by default. It performs no authentication and may reveal process command lines.