Home Page
The Home page is the landing/overview surface of the app. It presents a live, at‑a‑glance dashboard of the machine's identity, hardware, operating system, security posture, and real‑time telemetry.
Note
The page has two entry points into richer experiences for the Harden System Security app only.
- An entry to the Windows TopBar.
- An entry to the Live System Intelligence window (documented in full at the end).
The Home page is your system's dashboard. The moment you open it, it fills in with details about your computer and keeps the live values fresh while you're looking at them. Everything is organized into tidy cards so you can scan the whole picture quickly, and some cards can be clicked to reveal a deeper view.
The page is split into two areas:
-
System Overview: Your computer's identity, hardware, operating system, activation, network, and live performance readings.
-
Online Microsoft Defender Status: The latest antivirus engine and definition information published by Microsoft.
Cards that you can click show a small arrow in their corner. Clicking them opens a window with much more detail about that topic. Cards without the arrow are simply live readouts.
-
System Time: The current time on your computer, shown in your preferred 12‑hour or 24‑hour format, along with your time zone's offset from UTC.
-
User: The account you're signed in as, and whether the app is currently running with administrator privileges or as a standard (unelevated) session.
-
Computer Name: Your PC's name. Click this card to rename your computer. Renaming requires administrator privileges, and the app confirms whether the change succeeded.
-
System Model: The manufacturer and model of your computer.
-
Operating System: Your Windows edition, version, and build number.
-
Windows Activation: A quick summary of whether Windows is genuine and how it was licensed. Click the card to see the full activation and licensing breakdown, including license status, product key channel, digital license details, subscription information, and more.
-
Uptime: How long your computer has been running since it was last started. Click to see additional shutdown and startup details.
-
Last Boot Time: How long the firmware startup (the phase before Windows loads) took, shown in seconds.
- Pending Reboot Operations: Displays any operation that will happen by the operating system during the next reboot, and also shows underlying system components that need a reboot, such as any pending driver installation, Windows Updates, domain join, computer name change and such.
-
System RAM: The total amount of memory installed, along with its type and speed (for example, DDR5 5600 MT/s).
-
App RAM Usage: How much memory the app itself is using right now, along with a small live graph showing the last 60 seconds.
-
Storage Size and Temperature: The combined capacity of your fixed drives and the current temperature of each drive, with a live graph tracking the hottest drive over the last 60 seconds.
-
USB Device History: A count of every USB storage device that has ever been connected to this computer. Click to see the full list with each device's name and identifier.
-
Internet Speed: Your live download and upload speeds, plus the running totals of data received and sent.
-
IP Address: Your public IP address. For privacy, it isn't looked up automatically, click the card to retrieve it, and click again to refresh it. It uses secure anonymous Cloudflare and AWS servers.
-
Open Network Ports: How many network ports are currently listening for connections, split into TCP and UDP. Click to see the details of those open ports.
-
CPU: Your processor's name, core and thread counts, architecture, base speed, cache size, and socket count.
-
GPU: The name of your graphics hardware. Click to see full details such as manufacturer, driver version and date, and device identifiers.
-
CPU Temperature: The current temperature of your processor, with a live graph covering the last 60 seconds.
-
Power Plan: The name of the power plan Windows is currently using.
-
System Serial Number: Your computer's serial number.
-
System UUID: The unique hardware identifier assigned to your computer.
-
Baseboard Serial Number: The serial number of your motherboard.
-
Chassis Serial / Asset Tag: The serial number of your computer's chassis and, if one is assigned, its asset tag.
This section shows the newest Microsoft Defender information published online by Microsoft. These are the latest available values, which is handy for checking whether newer protection is out there compared with what your machine already has:
-
Engine Version: The latest antimalware engine version.
-
Signature Version: The latest antivirus definition version.
-
Platform Version: The latest Defender platform version.
-
Signature Update Date: When those latest definitions were published (in UTC).
If your computer is offline or the information can't be retrieved, these cards simply show "Unavailable."
The Home page is designed to be gentle on your system. Its live readings and subtle background animation are only active while you're actually viewing the page. As soon as you move to another part of the app, everything on the page winds down so it isn't quietly using resources in the background.
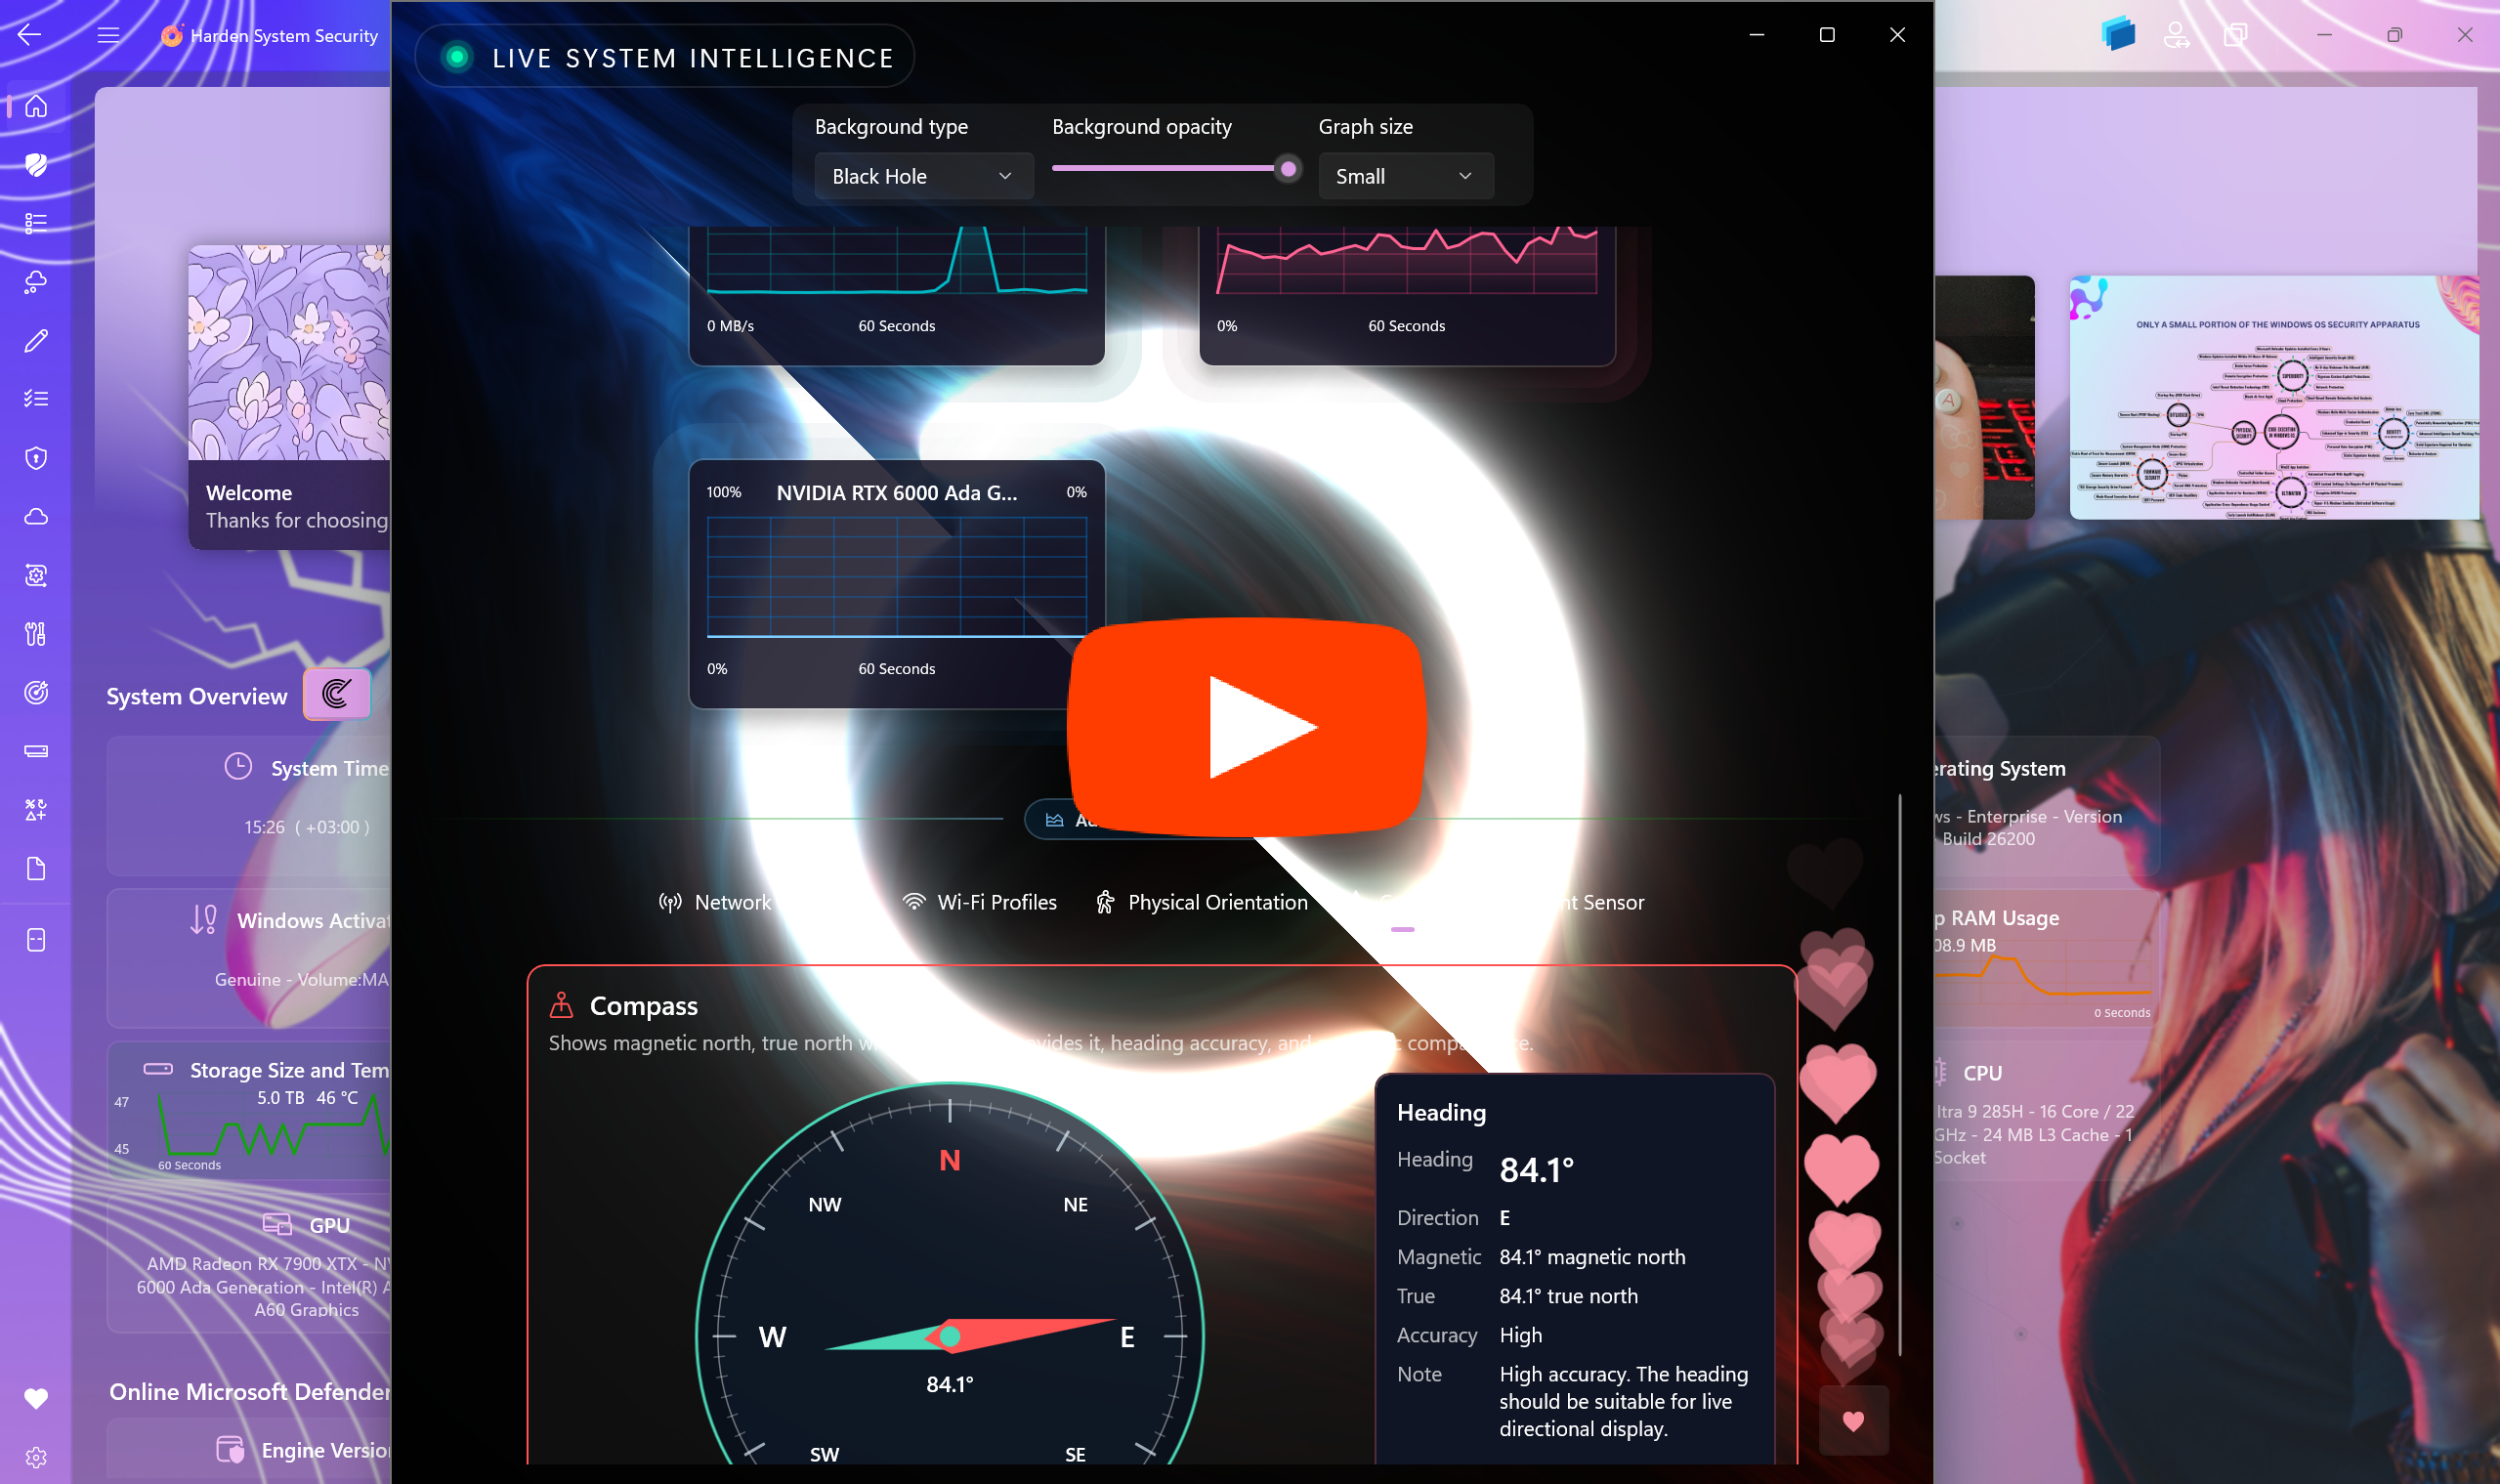
It's a YouTube video. Click to play it.
At the top of the System Overview area, next to the section title, is a button that opens the Live System Intelligence window; a full, immersive, real‑time view of how your computer is performing.
Like the Home page itself, this window is careful with resources: it does nothing in the background when it's closed. If you leave it open and move to another part of the app, its graphs keep updating; once you close it, everything stops.
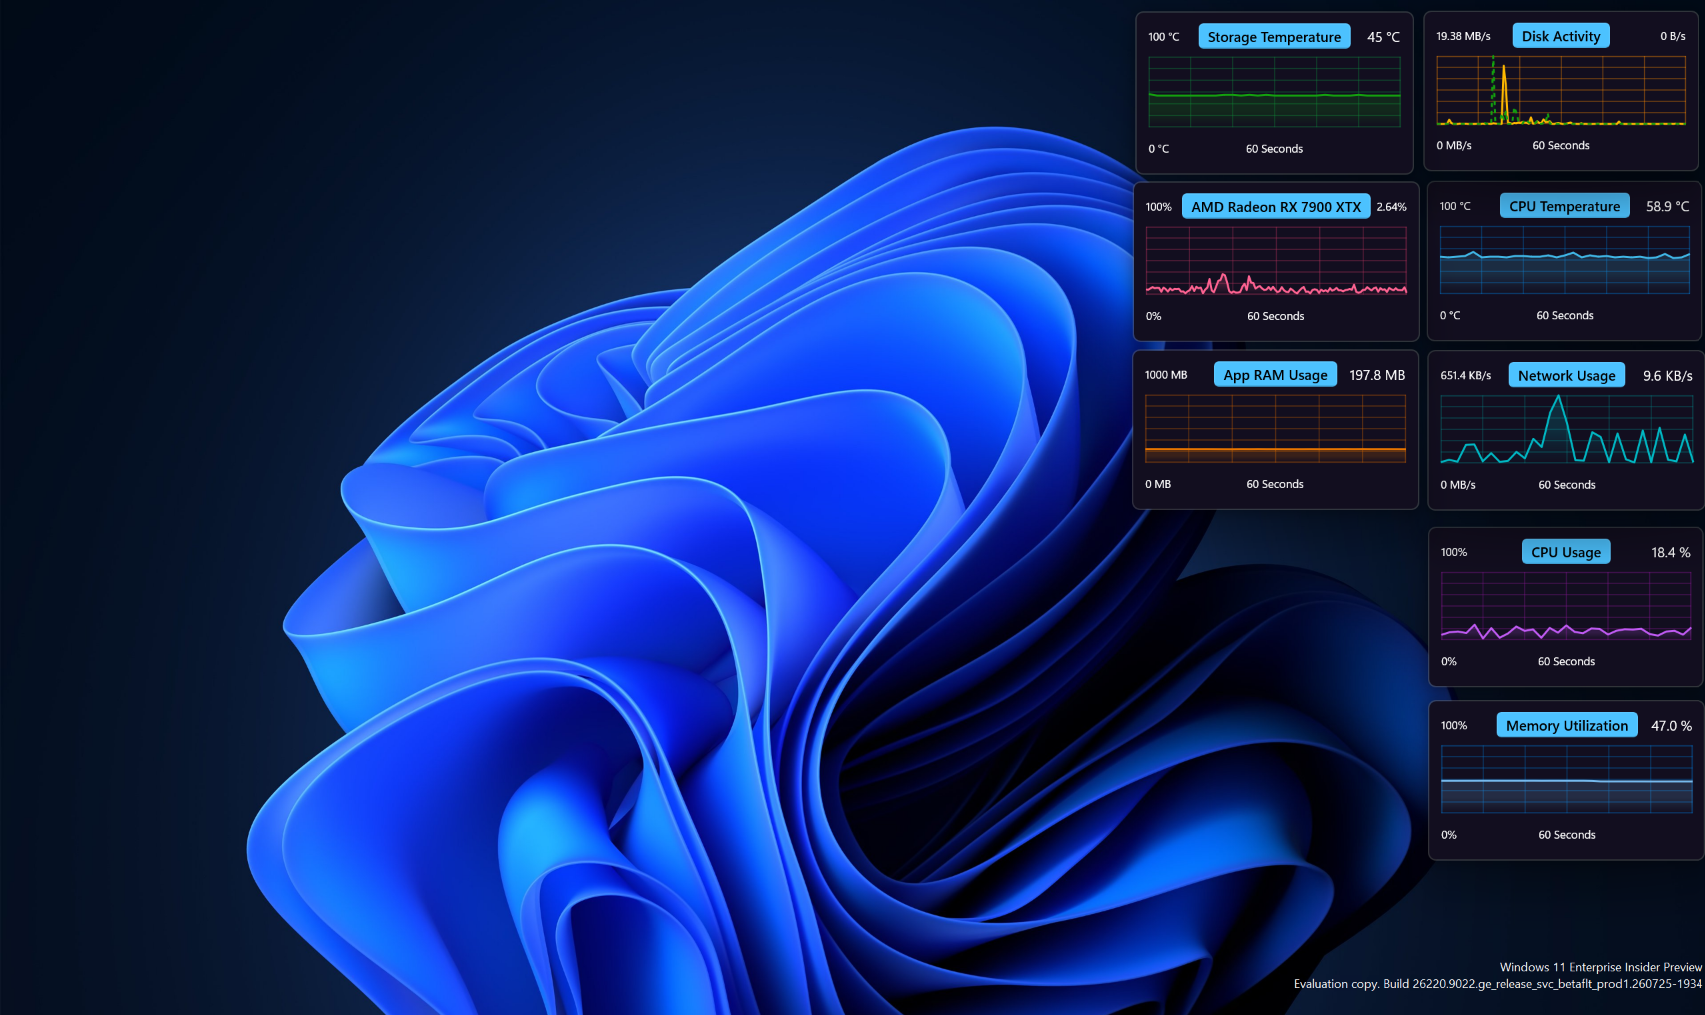
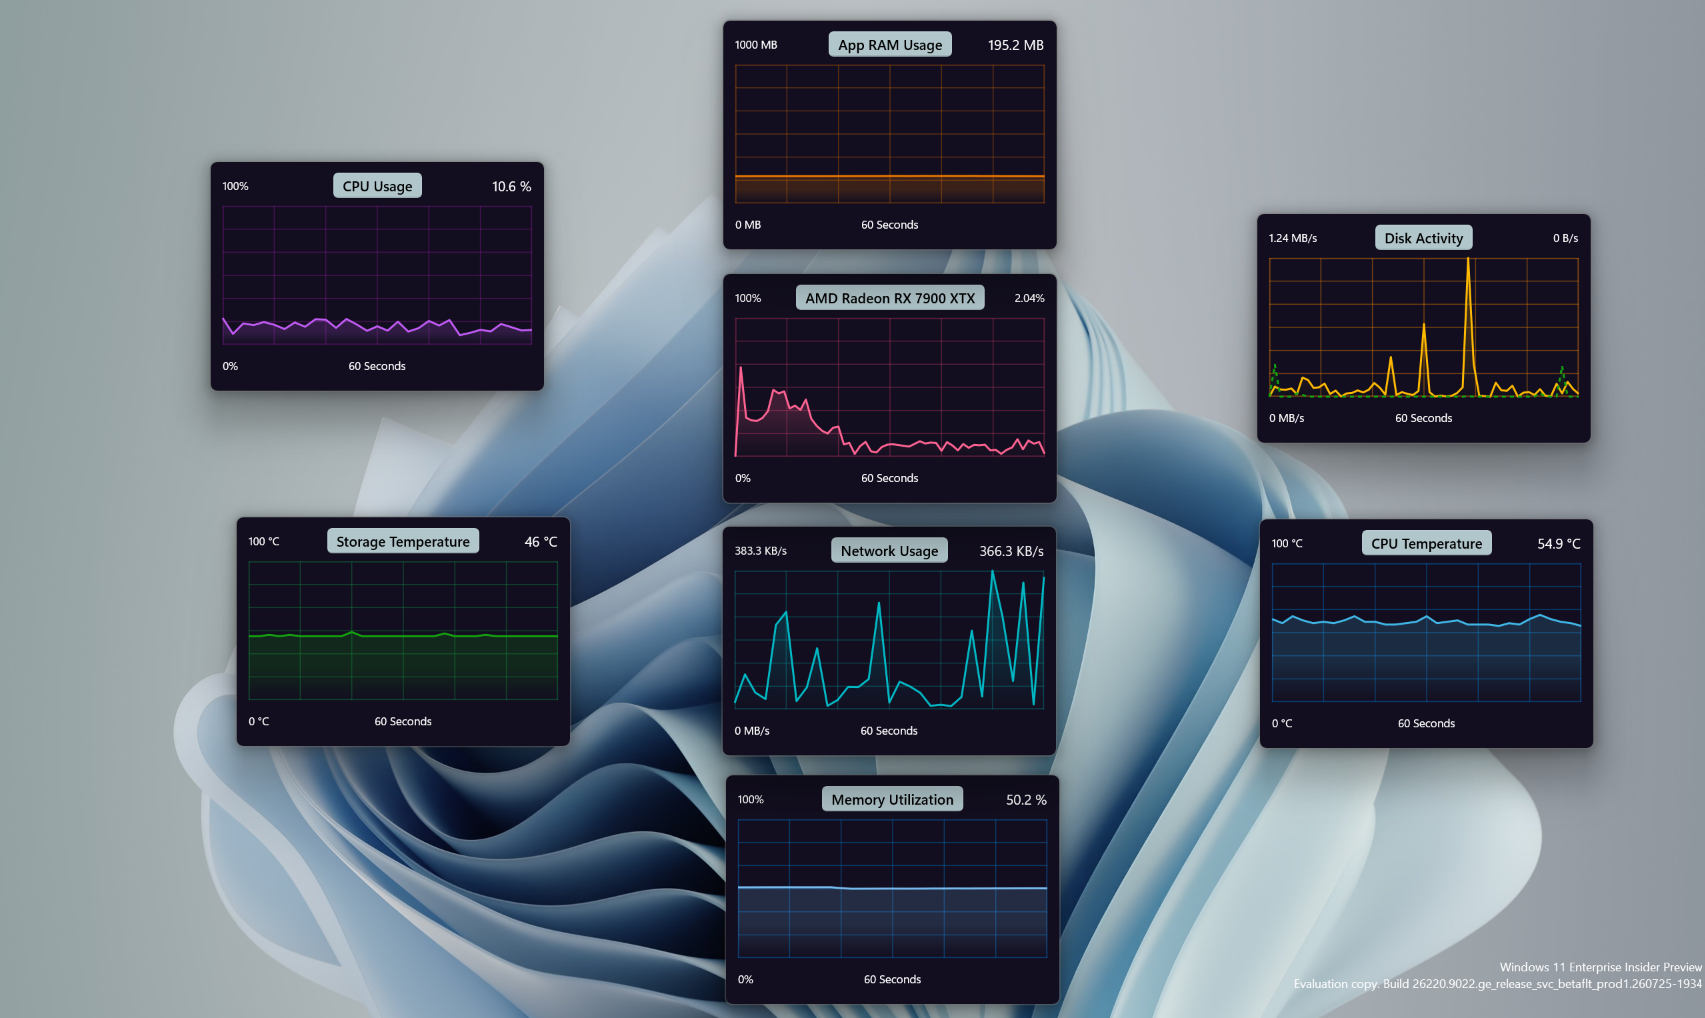
The window presents a wall of live graphs, each updating every couple of seconds. Every graph is interactive, hover or tap along the line to see the exact value at that moment in time. The built‑in graphs cover:
-
App RAM: Memory used by the app.
-
System Memory Utilization: How much of your total RAM is in use, as a percentage.
-
Storage Temperature: The temperature of your hottest drive.
-
CPU Temperature: Your processor's temperature.
-
CPU Usage: How hard your processor is working, as a percentage.
-
Disk Activity: Read and write speeds of your storage.
-
Network Usage: Your combined upload and download activity.
-
Total System Power: The overall power draw of your system, in watts (on supported hardware).
-
Battery Discharge: How quickly your battery is discharging, in watts (on supported hardware).
-
GPU Usage: In addition, a separate live graph appears automatically for each graphics card in your system, showing how busy it is.
Every graph's title can be clicked to "pop it out" into its own floating, always‑on‑top window that you can resize and place anywhere on screen. Close the pop‑out and the graph slides right back into the dashboard. You can even launch a specific graph straight from the app's taskbar shortcuts.
A control strip at the top lets you tailor the experience:
-
Background: Choose between an animated Tesseract backdrop or a Black Hole effect, or turn the background off entirely.
-
Background style and opacity: Pick a color theme for the Tesseract and dial the background's intensity up or down.
-
Chart animations: Turn the smooth graph animations on or off.
-
Graph size: Switch between Small, Medium, and Big layouts to fit more graphs on screen or make each one larger.
A glowing "Live System Intelligence" title badge and a playful heart button add a bit of personality to the window.
Below the graphs, a row of tabs opens a set of deeper, hands‑on diagnostic tools:
-
Network Openness: Runs a quick check of how reachable a curated list of popular websites and services is from your current network, grouped into categories such as social media, messaging, news, search, developer tools, and privacy tools. It gives you an overall openness score along with a per‑category breakdown and a detailed log, a great way to understand how open or restricted your internet connection is.
-
Wi‑Fi Profiles: Lists the saved Wi‑Fi networks on your computer and shows details for each one, such as its security type, encryption, and connection settings.
-
Physical Orientation: A live 3‑D view of how your device is physically tilted and moving, using your device's motion sensors (pitch, roll, yaw, and movement state), on hardware that has them.
-
Compass: A live compass showing your heading, direction, and accuracy, on devices with a magnetometer.
-
Light Sensor: A live ambient‑light meter showing the brightness around you in lux, a plain‑language rating, and helpful notes, on devices with a light sensor.
To stay efficient, only the diagnostic tab you're currently viewing does any live updating.
The Home page gives you a clear, all‑in‑one snapshot of your computer, who and what it is and how it's doing. And when you want to go deeper, the Live System Intelligence window turns that snapshot into a living, real‑time cockpit complete with pop‑out graphs, per‑GPU tracking, power and battery insights, and a handy set of network and sensor diagnostics.




- Home
- Create AppControl Policy
- Create Supplemental Policy
- System Information
- Configure Policy Rule Options
- Policy Editor
- Simulation
- Allow New Apps
- Build New Certificate
- Create Policy From Event Logs
- Create Policy From MDE Advanced Hunting
- Create Deny Policy
- Merge App Control Policies
- Deploy App Control Policy
- Get Code Integrity Hashes
- Get Secure Policy Settings
- Update
- Sidebar
- Validate Policies
- View File Certificates
- Microsoft Graph
- Firewall Sentinel
- Data Analysis in AppControl Manager
- Compare Policies

- Home
- TopBar
- Protect
- Microsoft Security Baselines
- Microsoft Security Baselines Overrides
- Microsoft 365 Apps Security Baseline
- Microsoft Defender
- Attack Surface Reduction
- Bitlocker
- Device Guard
- TLS Security
- Lock Screen
- User Account Control
- Windows Firewall
- Optional Windows Features
- Windows Networking
- Miscellaneous Configurations
- Windows Update
- Edge Browser
- Certificate Checking
- Country IP Blocking
- Non Admin Measures
- Group Policy Editor
- Manage Installed Apps
- File Reputation
- Audit Policies
- Cryptographic Bill of Materials
- Intune
- Configuration Service Provider (CSP)
- Service Manager
- Exploit Mitigations
- Sandbox Maker
- WinGet Management
- Tweaks
- Secure Vault
- Duplicate Photos Finder
- EXIF Manager
- Download Manager
- Bootable Drive Maker

- Introduction
- How To Generate Audit Logs via App Control Policies
- How To Create an App Control Supplemental Policy
- The Strength of Signed App Control Policies
- How To Upload App Control Policies To Intune Using AppControl Manager
- How To Create and Maintain Strict Kernel‐Mode App Control Policy
- How to Create an App Control Deny Policy
- App Control Notes
- How to use Windows Server to Create App Control Code Signing Certificate
- Fast and Automatic Microsoft Recommended Driver Block Rules updates
- App Control policy for BYOVD Kernel mode only protection
- EKUs in App Control for Business Policies
- App Control Rule Levels Comparison and Guide
- Script Enforcement and PowerShell Constrained Language Mode in App Control Policies
- How to Use Microsoft Defender for Endpoint Advanced Hunting With App Control
- App Control Frequently Asked Questions (FAQs)
- System Integrity Policy Transformations | XML to CIP and Back
- About Code Integrity Policy Signing

- How To Install Microsoft Store Apps Completely Offline
- Create Bootable USB flash drive with no 3rd party tools
- Event Viewer
- Group Policy
- How to compact your OS and free up extra space
- Hyper V
- Git GitHub Desktop and Mandatory ASLR
- Signed and Verified commits with GitHub desktop
- About TLS, DNS, Encryption and OPSEC concepts
- Things to do when clean installing Windows
- Comparison of security benchmarks
- BitLocker, TPM and Pluton | What Are They and How Do They Work
- How to Detect Changes in User and Local Machine Certificate Stores in Real Time Using PowerShell
- Cloning Personal and Enterprise Repositories Using GitHub Desktop
- Only a Small Portion of The Windows OS Security Apparatus
- Rethinking Trust: Advanced Security Measures for High‐Stakes Systems

- Clean Source principle, Azure and Privileged Access Workstations
- How to Securely Connect to Azure VMs and Use RDP

- Basic PowerShell tricks and notes
- Basic PowerShell tricks and notes Part 2
- Basic PowerShell tricks and notes Part 3
- Basic PowerShell tricks and notes Part 4
- Basic PowerShell tricks and notes Part 5
- How To Access All Stream Outputs From Thread Jobs In PowerShell In Real Time
- PowerShell Best Practices To Follow When Coding
- How To Asynchronously Access All Stream Outputs From Background Jobs In PowerShell
- Powershell Dynamic Parameters and How to Add Them to the Get‐Help Syntax
- RunSpaces In PowerShell
- How To Use Reflection And Prevent Using Internal & Private C# Methods in PowerShell