Sidebar Views
The toolkit adds a Paradox activity-bar container (its icon appears in the far-left strip of VS Code) holding the Project dashboard and a set of views that give you a live picture of your mod. This page covers each one.
With multiple mods open, these views show one mod at a time. By default they follow the active editor: the mod that owns the file you are editing. To pin a specific mod instead, use the focus dot in the Project view or run Paradox: Pick Focus Mod (there is a button in the view headers). Switching is instant, because all mods are indexed once at launch and the views just re-filter in memory. See Multi Mod and Translation.
The dashboard at the top of the container, and the first thing to look at. Three collapsible sections, each remembering whether you left it open.
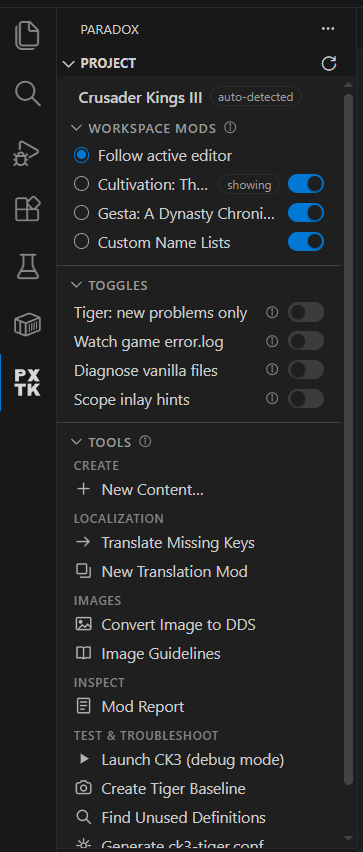
Header. Names the active game with an "auto-detected" or "set manually" badge. Click it to change px.gameId when detection guessed wrong. If the folder has no mod descriptor, the empty state offers Create descriptor.mod rather than a dead end.
Workspace Mods. Every mod in the workspace as a row with two controls: a focus dot (pin the sidebar views to this mod, or leave "Follow active editor" selected) and an index switch (turn indexing off for a mod you are not working on, backed by px.excludedMods).
Toggles. Live switches for the tiger new-problems-only filter (hidden for games with no tiger), the game error.log watcher, vanilla diagnostics and scope inlay hints. A Clear Game Problems (N) row appears while there is something to clear.
Tools. The launchers, grouped by Create, Localization, Images, Inspect, and Test & Troubleshoot. Only commands that have no button elsewhere are listed, so nothing is duplicated; tiger runs live in the status bar and setup is the toolkit status-bar item. Everything has an info tooltip on hover, and the view reflects state changes from anywhere (settings, commands, status bar) immediately.
What it shows: your mod's content inventory, grouped by kind (events, decisions, traits, cultures, and so on) with counts.
Why you care: a quick census of what is actually in the mod, and a fast way to jump to any definition.
How to use it: click any item to open its definition.
What it shows: every diagnostic, sliced severity → source·code → file. The toolkit's structural checks, tiger reports and the game's own error.log entries all feed it.
Why you care: it groups problems by what kind they are, so you can knock out a whole class at once instead of walking a flat list.
How to use it: expand a severity, then a source and code, then click a file to jump to the problem.
What it shows: per language, which keys are missing (referenced but never defined), orphaned (defined but unused), and untranslated (present but blank).
Why you care: missing loc is the most common reason a mod shows raw keys in game, and this makes the gaps visible per language.
How to use it: missing entries carry an inline Add Localization... action that writes the entry for you. Blank values count as untranslated, so the view doubles as a translation progress tracker.
What it shows: what your mod shadows in vanilla, with the resolved winner marked (script overrides are LIOS, last wins; GUI is FIOS, first-in-only-served, which is a common trap). It also flags definitions that two of your workspace mods both declare, noting that launcher load order decides those.
Why you care: overrides are invisible until they bite. This surfaces every one, including the GUI first-in-only case where a later definition is silently ignored, and mod-vs-mod collisions between the mods you have open.
What it shows: for the definition at your cursor, what references it and what it references, grouped by kind.
How to use it: run Paradox: Show Dependencies of Definition at Cursor, then click any entry to jump to the site.
What it shows: your events wired to each other through trigger_event and on_actions, as an interactive graph. Open it with Paradox: Show Event Graph, or the button on the editor title of an events / on_action / decisions file.
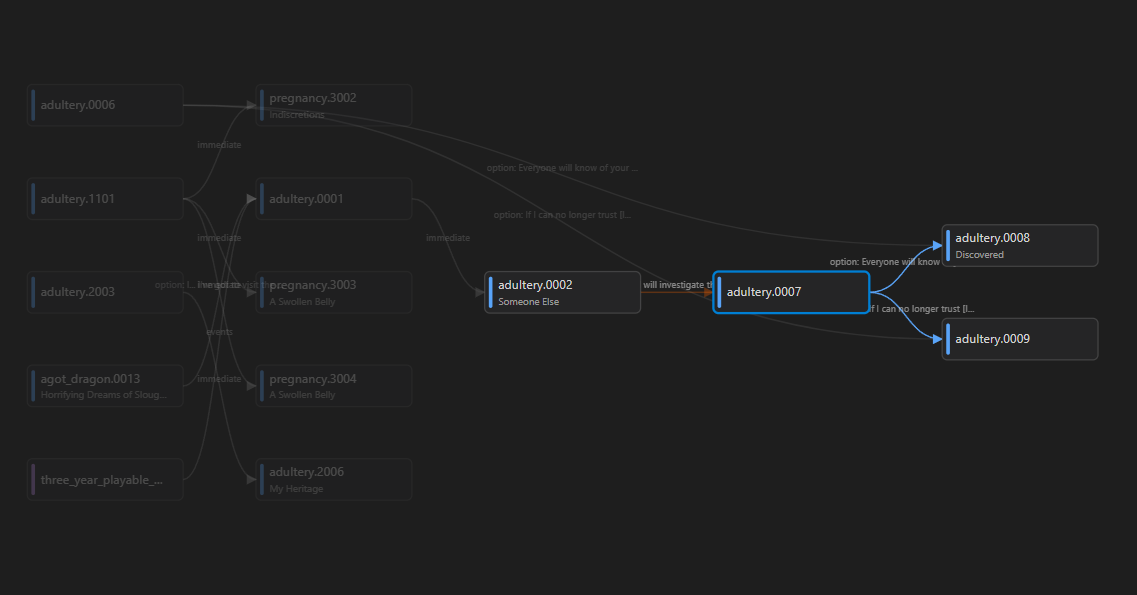
Why you care: event chains get tangled fast, and a picture of who triggers whom (plus a place to edit event text) beats scrolling files.
How to use it:
- Select a node and everything outside its neighborhood dims. What it fires goes blue, what fires it goes orange, and its edge labels appear. (Labels show everywhere only in sparse graphs, which keeps a big graph from turning into label soup.)
- The legend is clickable to dim whole kinds. Esc deselects, so does clicking empty canvas.
-
Zoom with the +/−/fit controls or the keyboard (
+,−,0). Middle-mouse drag pans. - The query box completes on your mod's real event ids and namespaces as you type, from the same index that draws the graph.
- The inspector shows the event's localized title, description and options (all editable inline, written back BOM-correct), per-section summaries, and every referenced scope, variable and scripted effect with jump-to-definition. + Add option scaffolds a new option straight into the file, and Center graph here re-roots the view.
- A selected node offers Simulate next to Open source. Ctrl+click opens the source, and the graph exports as SVG.
What it shows: the PdxGui widget hierarchy of a .gui file as a collapsible tree, with type badges, names, using refs and animation states.
Why you care: GUI files nest deeply and reuse templates; a structural tree is far easier to navigate than raw text.
How to use it: open a .gui file and run Paradox: Show GUI Widget Tree (or use the tree icon on the editor title). Click a node to jump to its source; the widget's line also flashes in the editor with a range highlight and an overview-ruler mark. Filter by name, and it refreshes on save.
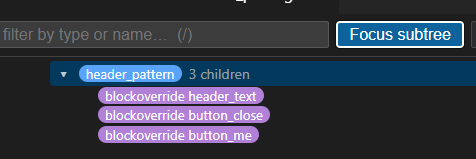
Focus subtree (Ctrl+Alt+H) pins one branch: clicking around inside it navigates without re-narrowing, h on a deeper node re-focuses there, and Esc zooms back out. The button says what it does in each mode.
To work on the file visually rather than structurally, see GUI Editor.
Paradox: Show Mod Report renders the whole dashboard (inventory, coverage, overrides and more) as a single markdown page you can read top to bottom or share. It counts only the focused mod's diagnostics, and it does not leave a dirty Untitled tab behind.