Results and Validation
This example connects the pipeline diagrams and formulas to files that can be heard and inspected. It uses a real 30 second piano recording, a public domain score reference, and the MIDI produced by A2M 3.0.0.
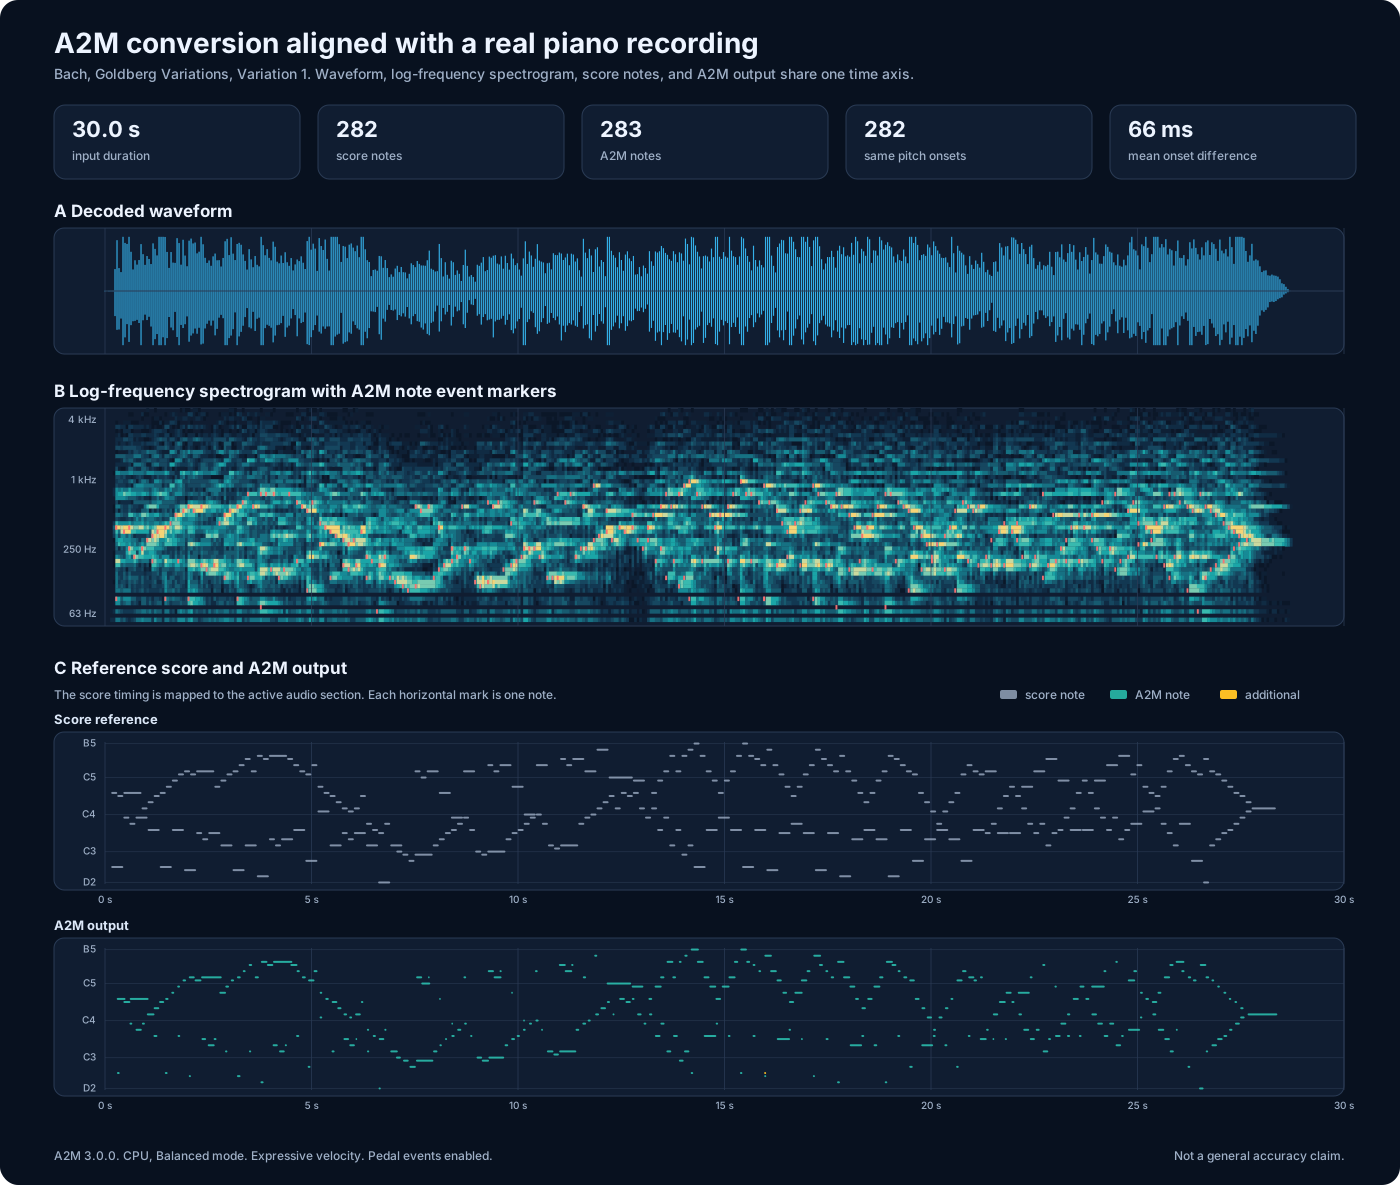
The excerpt is the opening section of Johann Sebastian Bach's Goldberg Variations, Variation 1, performed by Kimiko Ishizaka for the Open Goldberg Variations project. The recording is released under CC0. The score and recording can be copied, modified, and distributed without a permission or attribution requirement.
The reference MIDI contains the same written notes. Its timing is mapped to the active audio region from 0.15 seconds through 28.35 seconds. A2M received only the MP3 during transcription. It did not receive the score reference.
| Property | Value |
|---|---|
| Input | MP3, 44.1 kHz, stereo, 192 kbps |
| Duration | 30.0 seconds |
| Reference notes | 282 |
| A2M notes | 283 |
| Same pitch onsets within 250 ms | 282 of 282 |
| Same pitch onsets within 100 ms | 233 of 282 |
| Mean absolute onset difference | 66 ms |
| Missed reference notes | 0 |
| Additional A2M notes | 1 |
| Execution | A2M 3.0.0, Piano Engine 1.0.1, CPU, Balanced mode |
| Export | Expressive velocity, pedal events enabled |
- Decoded waveform: The height shows audio amplitude over time. Individual pitches are difficult to separate here.
- Log-frequency spectrogram: Brighter regions indicate greater spectral magnitude at a given time and frequency. Thin red markers indicate the temporal and pitch locations of note events detected by A2M. Piano notes appear as groups of related frequency bands corresponding to their fundamental frequencies and harmonics.
- Score reference: The written notes are mapped to the active audio region.
- A2M output: The detected pitches and timing are shown on the same axes. The single amber mark is the additional note.
- The onset times in the first notated section were linearly mapped to the corresponding region of the audio recording.
- Each reference note was matched to the nearest unmatched A2M note of the same pitch, provided that their onset times differed by no more than 250 ms.
- Each A2M note could be paired once. An unmatched reference note counted as missed. An unmatched A2M note counted as additional.
- The mean absolute onset error was calculated across all 282 matched note pairs.
For this comparison, TP = 282, FP = 1, and FN = 0. This gives 99.6%
precision, 100% recall, and 99.8% F1 for this one excerpt.
Precision = TP / (TP + FP)
Recall = TP / (TP + FN)
F1 = 2 * Precision * Recall / (Precision + Recall)
For the 282 paired onsets:
Mean onset difference = sum(abs(A2M onset minus reference onset)) / 282 = 66 ms
The 250 ms boundary allows for expressive timing and the section level score mapping. The separate 100 ms count shows the tighter timing result.
This example demonstrates the complete current A2M transcription pipeline on a real piano recording. It covers MP3 decoding, resampling, feature extraction, model inference, note-interval decoding, timing refinement, section stitching, and MIDI-file generation. The single unmatched A2M note is retained in the results rather than removed.
This example does not establish general performance across all pianos, microphones, acoustic environments, recording conditions, performance styles, or musical works. Instead, it provides one transparent and reproducible case that users can listen to, inspect, and evaluate directly.