What defines the end of a pandemic? The New York Times states, "According to historians, pandemics typically have two types of endings: the medical, which occurs when the incidence and death rates plummet, and the social, when the epidemic of fear about the disease wanes." Covid-19 is not gone but have we reached the point in our pandemic when it has ended socially?
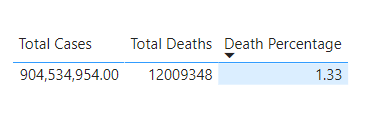
So, will this pandemic become endemic? Meaning will Covid be around year after year like influenza but with a much lower rate of death? If that is the case, when do we accept the death rate of Covid as a community and decide that it will no longer affect our day-to-day lives? In this table we look at global totals for deaths and cases.
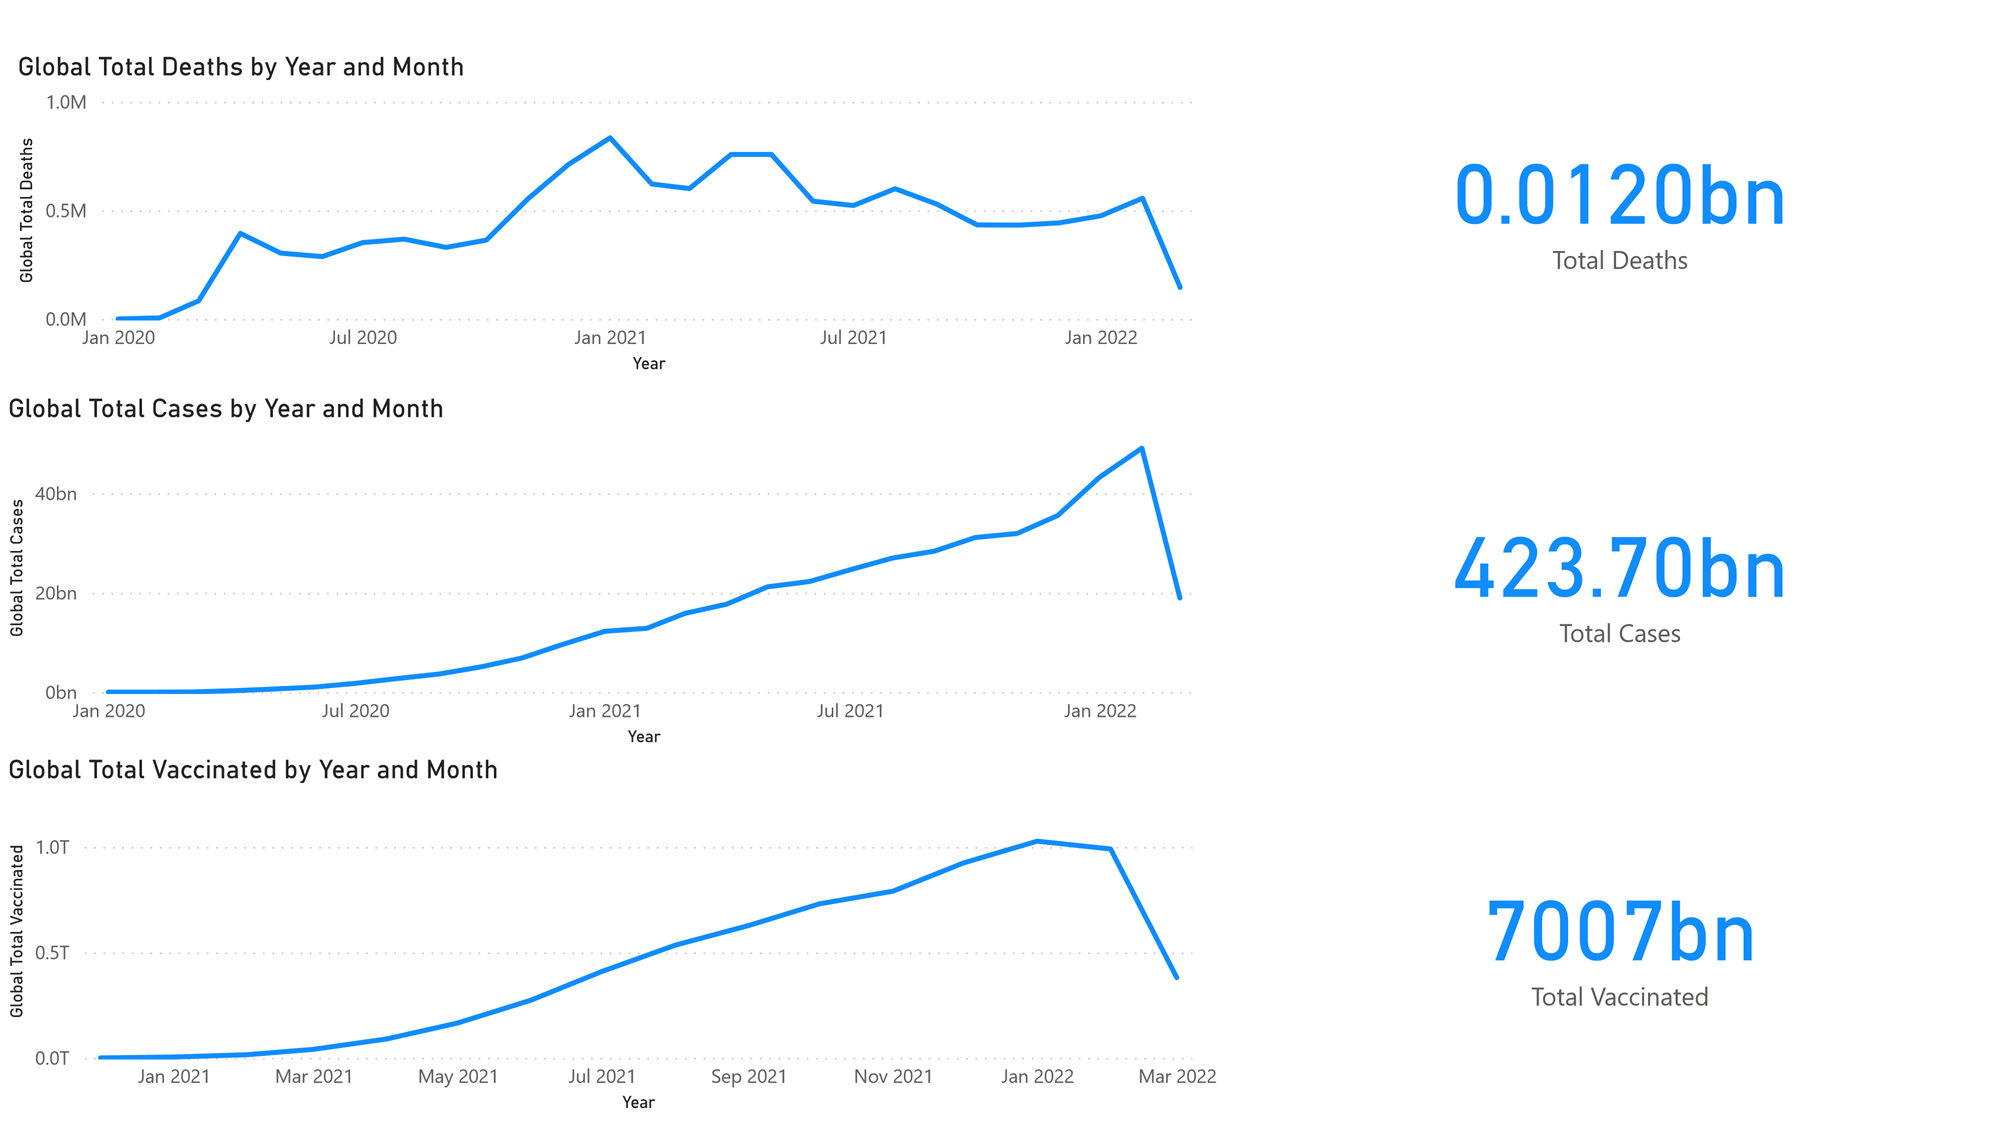
This project is a brief look at the Covid death, infection, and vaccination rates gathered from ourworldindata.org. As you can see from the graphs below all global levels have dropped since Febrary of 2022.
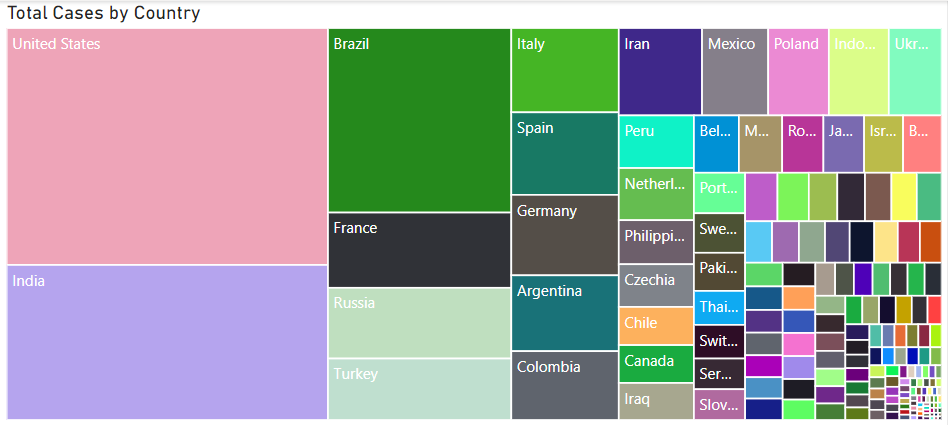
It is easy to see that the United States has the largest number of cases of Covid when observing the Treemap below of number of cases by country.
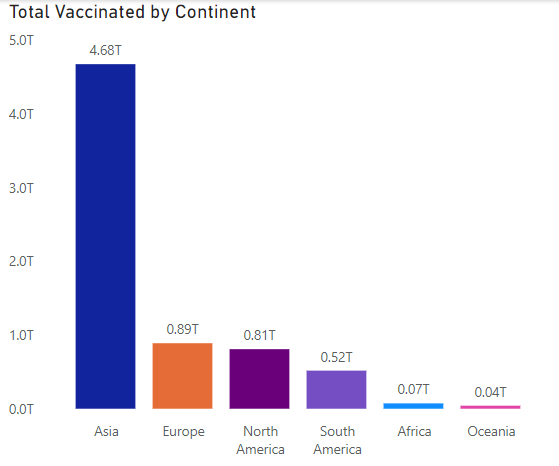
From our next visual we can see the number of people vaccinated within each continent. What this doesn't show is that over all it is China, India, and the United States that are leading in the number of people vaccinated by country. If you take a look at the Power BI Visualization that are archived here on the site you can drill down into the data and see these numbers! Please feel free to check those out!
*Data was last pulled in March 2022
The data from this project was obtained from https://ourworldindata.org/coronavirus. It was imported directly into Excel. Then the data was transformed using Microsoft SQL Server Studio. Several views were created inorder to focus and customize tables to be used to create visualizations and to analyze the data. Power Bi and Tableau were both used to create different Dashboards and visualizations.
From this project we can see that levels are dropping off. Next step is to see if this drop off is statistically relevent. Another good approach to see if Covid will become a endemic would be to do a sentiment analysis of a social media site like twitter to see if people around the globe feel that the pandemic is coming to an end.
Power BI Visualizations can be downloaded in archive.(Covid Data Project.pbix) This is a Dashboard of cases, vaccinations, and death. These pages are much more indepth look at the data in a visual display.
Tableau Visualization https://public.tableau.com/views/PortfolioProject1_16472180549570/Dashboard1?:language=en-US&publish=yes&:display_count=n&:origin=viz_share_link
References:
National Library of Medicine https://www.ncbi.nlm.nih.gov/pmc/articles/PMC8014506/ Scientific American https://www.scientificamerican.com/article/how-the-covid-19-pandemic-could-end1/ New York Times https://www.nytimes.com/2020/05/10/health/coronavirus-plague-pandemic-history.html