Tutorial
This tutorial walks you through setting up the IXP Digital Twin using a small example IXP with three customers connected to an IPv4-only route server.
The tutorial starts with a Kathará lab emulating a small IXP and uses the dashboard to recreate its digital twin and configure the quarantine checks.
Our small IXP comprises three customers connected to an IPv4-only route server. The topology is shown in the following figure.

The route server (RSv4) runs the BIRD daemon. The three customers (AS1, AS2, AS3) run FRR. Their configurations are tweaked to provide realistic AS paths in the route announcements.
It is important to note that the digital twin does not mirror the IXP's physical fabric interconnections, the switches, VLANs, trunk links, and vendor-specific switching configurations that form the underlying infrastructure. Emulating the complete switching fabric would require running proprietary, resource-intensive virtual appliances, managing complex multi-vendor configurations, and building an environment that replicates every detail of the layer-2 topology. Such an approach would shift the focus entirely, transforming the digital twin from a lightweight routing validation tool into a full-scale data centre infrastructure replica.
That is not the goal of this project. The digital twin is purpose-built to validate routing behaviour: BGP sessions, route filtering, prefix announcements, and policy enforcement at the route server level. The emulated peering LAN is a simple shared layer-2 segment – sufficient to establish BGP sessions and exchange routes – not a replica of production switching hardware. This design choice keeps the environment lightweight, fast to deploy, and focused on the operational risks that matter most to IXP operators: misconfigurations in route server policy, incorrect filters, and problematic customer announcements.
Before configuring our digital twin, we need a file describing the peering connections in the IXP.
This file can be downloaded from IXP Manager or created as a raw JSON file like the following:
[
  {
    "ORIG_AS_NUM": "1",
    "ORIG_AS_NAME": "CUSTOMER-1",
    "PEERING_ADDR4": "192.0.2.1",
    "PEERING_ADDR6": "",
    "MAC_ADDR": "000000.000001"
  },
  {
    "ORIG_AS_NUM": "2",
    "ORIG_AS_NAME": "CUSTOMER-2",
    "PEERING_ADDR4": "192.0.2.2",
    "PEERING_ADDR6": "",
    "MAC_ADDR": "000000.000002"
  },
  {
    "ORIG_AS_NUM": "3",
    "ORIG_AS_NAME": "CUSTOMER-3",
    "PEERING_ADDR4": "192.0.2.3",
    "PEERING_ADDR6": "",
    "MAC_ADDR": "000000.000003"
  }
]
Create a file named peering.json with the above content describing the customers of this small IXP.
Next, to complete our configuration, we also need the route server configuration (a bird.conf file in this case) and
its RIB. Normally, we should obtain the RIB from our running route server. To simulate this, we will run the Kathará
network scenario and dump the RIB from our emulated route server.
Download the network scenario and extract the ixp-lab directory.
The ixp-lab directory contains the files needed to run the Kathará network scenario. The configuration is
straightforward; this section describes it for users unfamiliar with Kathará.
Each Kathará network scenario folder contains a lab.conf file describing device connections
and features (e.g., the Docker image used for a specific device). For more details about the lab.conf file, refer to
the man page.
Additionally, each device has a <device_name>.startup file containing the commands to execute at device startup. Each
device can also have a directory with its name containing device-specific configuration. The folder structure mirrors
the filesystem path on the device. For example, the route server configuration is located
at rsv4/etc/bird/bird.conf. At startup, this bird.conf file is copied to the
/etc/bird/ directory of the rsv4 Kathará device.
You can explore other device directories to understand how the network scenario is configured, though this is not required for this tutorial.
To run the network scenario, enter the ixp-lab directory and execute:
kathara lstartThis command starts the Kathará network scenario, opening a terminal for each device.

Select the rsv4 terminal (opened by the previous command) and execute:
cat /etc/bird/bird.conf > /shared/bird.confThis command dumps the running configuration to the shared directory.
The shared directory is a special Kathará directory shared with the host machine. After running the command, you will
find the bird.conf file in the ixp-lab/shared directory on your host.
Similarly, dump the routes from the route server:
birdc show route all > /shared/rsv4.dumpYou will find the routes in the rsv4.dump file in the shared directory.
You now have all the files needed to proceed with the configuration.
Start by cloning the IXP Digital Twin repository:
git clone git@github.com:KatharaFramework/ixp-digital-twin.gitNext, in the same directory, clone the dashboard repository:
git clone git@github.com:KatharaFramework/ixp-digital-twin-dashboard.gitThe dashboard repository contains two Docker Compose files: one for production and one for development. This tutorial uses the development file, though the production file can be easily configured with custom settings.
Enter the dashboard repository directory and run:
docker compose -f docker-compose-dev.yml up --buildThis command builds the Docker images and deploys both the backend and frontend of the dashboard.
Note: If you need production deployment instructions, please refer to the complete Installation Guide or contact us for assistance.
After Docker Compose starts, access the dashboard at http://localhost:5174/.
On the first run, no configuration file exists for your digital twin. The dashboard indicates this with a
Configuration Missing status.

To start configuring the digital twin, click the Configure button to open the configuration page.

The configuration page is organized into several sections. This section walks through each one to help you configure your digital twin.
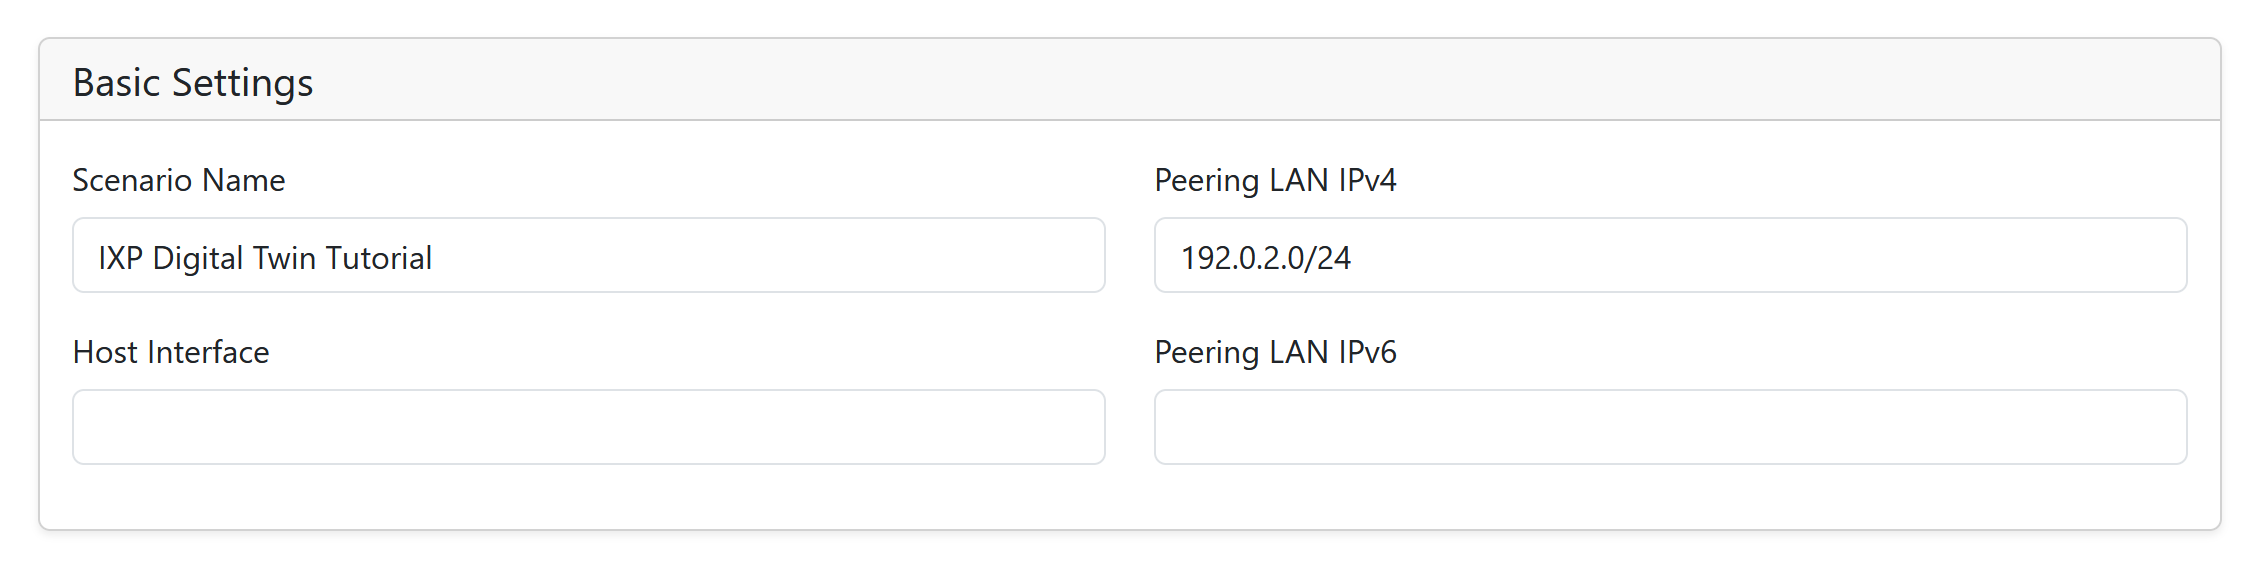
The Basic Settings section contains fundamental information about your IXP scenario:
Scenario Name: A descriptive name for our digital twin scenario. This helps identify the configuration when we have multiple setups. For this example, use "Kathará IXP".
Host Interface: The network interface on our host machine used for the simulation. This is optional and only needed if we want to set up quarantine checks for customers. For local testing, leave this empty.
Peering LAN IPv4: The IPv4 subnet where our customers peer with the route server. In this example, use
192.0.2.0/24. This is crucial as it defines the network where peering connections occur.
Peering LAN IPv6: The IPv6 subnet where customers peer (if applicable). For IPv6-only or dual-stack deployments, enter the appropriate IPv6 prefix. In this example, leave this field empty since only IPv4 is used.
This section defines how the digital twin learns about the peering relationships in our IXP.
Peering Configuration Type: Choose the format of our peering data. Two options are available:
-
raw_json: For manually created JSON files with peering information, as shown earlier. -
ixp_manager: For JSON exports from IXP Manager (a common IXP management system). For more details, refer here.
For our tutorial, select raw_json since we created a simple JSON file with our customer information.
Peering Configuration Path: Upload the file containing our peering data. Click the dropdown to see available files, or use the upload button (📤) to add a new file. The dashboard lists all JSON files in the resources directory.

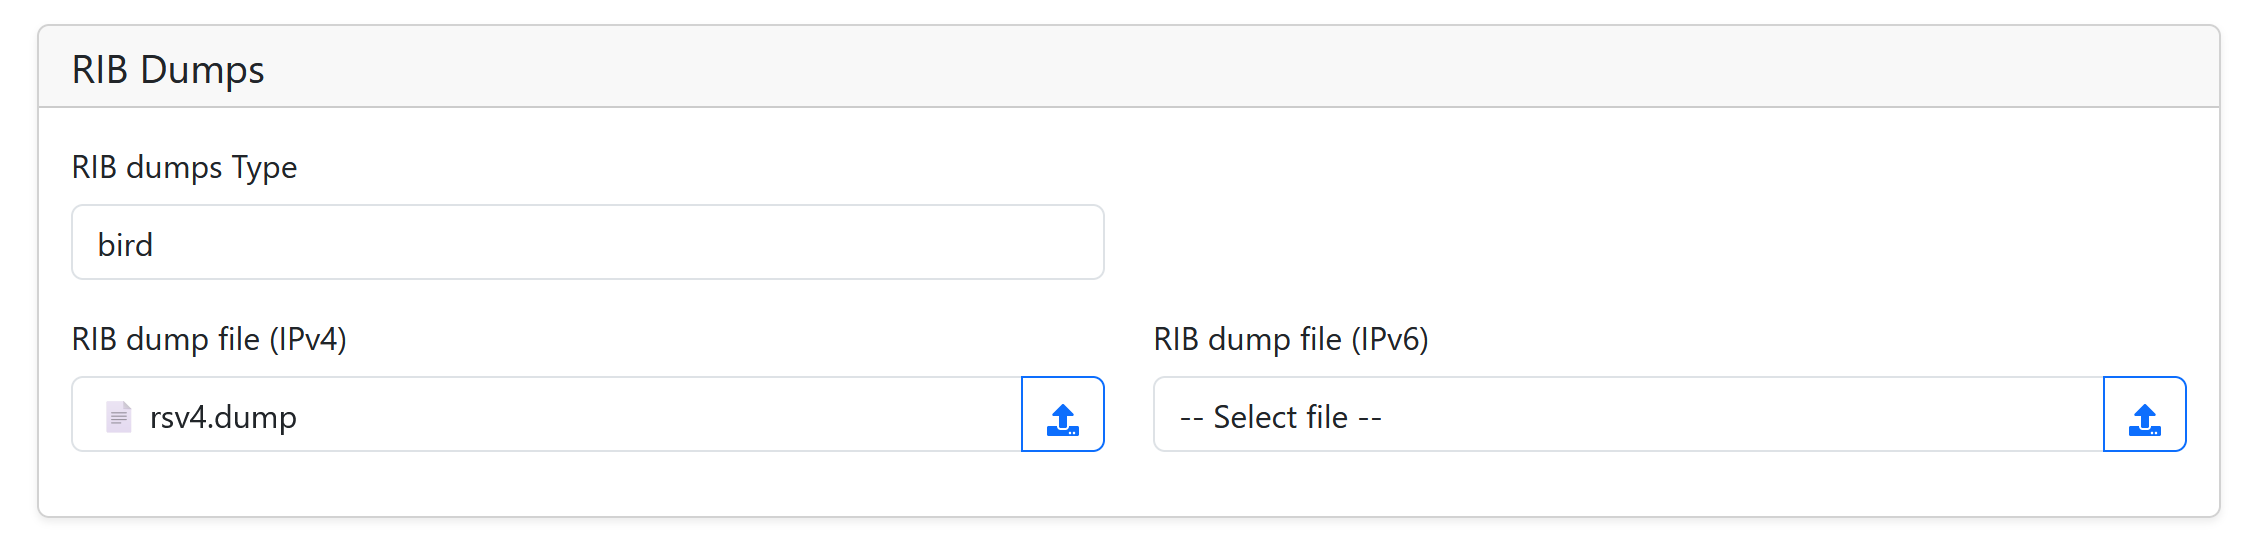
The RIB (Routing Information Base) dumps contain the actual routes that the route server has learned from its customers. This is essential for the digital twin to replicate the real routing state.
RIB Dumps Type: Select the format of your RIB dump file:
-
bird: For route servers using BIRD -
open_bgpd: For route servers using OpenBGPD
For our tutorial, select bird since we're using the BIRD daemon.
RIB Dump File (IPv4): Select or upload the IPv4 RIB dump file. This is the output from the birdc show route all
command executed earlier. The file contains all IPv4 routes from our route server.
RIB Dump File (IPv6): Select or upload the IPv6 RIB dump file if our setup supports IPv6 routing. This is optional for IPv4-only IXPs like this example.
Once you've uploaded these files, they appear in the dropdown for easy selection.
In the digital twin architecture, IPv4 and IPv6 route servers run in separate containers (even if in the real fabric there is a single route server) to simplify deployment and improve scalability. Despite running separately, the information obtained by customers is identical to that of the production network.
Device Name: The name of the route server device (e.g., rsv4). This should match the name in our Kathará lab or
actual IXP setup.
Type: The daemon type running on this route server:
-
bird: For BIRD BGP daemon -
open_bgpd: For OpenBGPD
Docker Image: The Docker image to use when launching the route server in the digital twin. This should match the
version and software used in our production environment. The image encapsulates the BIRD daemon and necessary tools for
BGP route processing. For example: kathara/bird2-birdwatcher:2.0.8. We ship several Docker images such as BIRD2,
BIRD3, and OpenBGPD. The repository allows building
them with different software versions by simply running a makefile.
AS Number: The Autonomous System number of the route server. In this example, use 10.
Config File/Directory: Upload the route server configuration files. For BIRD, this is the bird.conf file. The
dashboard accepts single files or entire directories. Use the upload button to add our configuration.
IP Address: The IP address of the route server on the peering LAN. In this example, use 192.0.2.10. This is where
customers establish BGP sessions.
Options: Optional settings for the route server. You can use this to configure Birdwatcher (for example, set the TCP
port and the Birdwatcher config file relative to the resources folder). In this tutorial, leave this field unset.
Click "Add Route Server" to add multiple route servers if your IXP has redundancy or dual-stack IPv4/IPv6 route servers.

RPKI (Resource Public Key Infrastructure) servers validate the origins of BGP routes.
Type:
-
external: For RPKI cache servers outside our management domain -
internal: For internally running RPKI validators
Address: The IP address or hostname of the RPKI server.
Port: The port number where the RPKI RTR (Router-to-Router) protocol listens (typically 3323 for external
validators or 8283 for the standard RTR port).
Protocol: The protocol used (typically rtr for the RTR protocol or https for HTTP-based access).
This is not covered in the tutorial; leave this section empty. For details, refer to the RPKI Configuration section.
This section configures the quarantine checks of the digital twin. These checks ensure customers comply with IXP technical rules before being fully connected.
Quarantine Actions: Select which validation checks should be performed on customer connections:
- connectivity.CheckPingAction: Verifies basic layer 3 connectivity by pinging the customer's address
- connectivity.CheckPingMtuAction: Verifies the Path MTU is correct (typically 1500 bytes)
- connectivity.CheckProxyArpAction: Validates Proxy ARP responses from the customer
- bgp.CheckBgpSessionAction: Verifies that BGP sessions can be established with the customer
- bgp.CheckBgpRibAction: Validates routes received from the customer against the RIB dump
- security.CheckServicesAction: Verifies that only permitted services run on the customer's port
- security.CheckTrafficAction: Monitors traffic patterns for policy violations
For a complete setup, we would typically enable all the actions to ensure comprehensive validation.
Max RIB Prefixes (IPv4/IPv6): The maximum number of prefixes a customer may announce. This prevents route table
pollution. For example, 5000 is a reasonable limit for most customers. The digital twin alerts if a customer attempts
to announce more prefixes than allowed.
Traffic Dump Duration (minutes): How long the system captures traffic during validation tests. Typically, 1 minute
is sufficient, but we can increase this for more thorough testing.
Probe IP (IPv4/IPv6): The IP address(es) used by the quarantine system to send test traffic (ping, traceroute, etc.)
to validate connectivity. This should be an address on the peering LAN or reachable from it. For IPv4, this might be
192.0.2.254.
DNS Name: A domain name used during traffic checks. This is used by some security tests to verify DNS resolution
capability. For example: kathara.org or our IXP's domain.
Proxy ARP IPs: A list of IP addresses for which Proxy ARP responses are expected. These are typically the peering LAN gateway addresses or special service addresses. Click "Add IP" to add multiple addresses. For example, add the route server's address or special monitoring addresses.
Configure the checks as shown in the figure below.

For complete information about the configuration, refer to the Configuration-Reference or contact us.
Once we've filled in all the necessary fields:
- Click the Save button to persist our configuration to disk.
- The dashboard validates our settings and shows success or error messages.
- Use Reload from disk to revert to the last saved configuration if needed.
- Click View raw to see the underlying JSON configuration file for debugging.
After saving, the dashboard status changes from "Configuration Missing" to show the active configuration. We're now ready to use the digital twin for testing customer connections.
After saving the configuration, start the digital twin from the dashboard. The dashboard reads the configuration file and uses it to build the emulation.
- Return to the main dashboard page.
- Verify the status is no longer Configuration Missing.
- Click Start to launch the digital twin services.
- Wait for the status to become Running.
When the digital twin is running, the dashboard displays a live status so you can verify that the route server containers and quarantine checks are operating correctly.

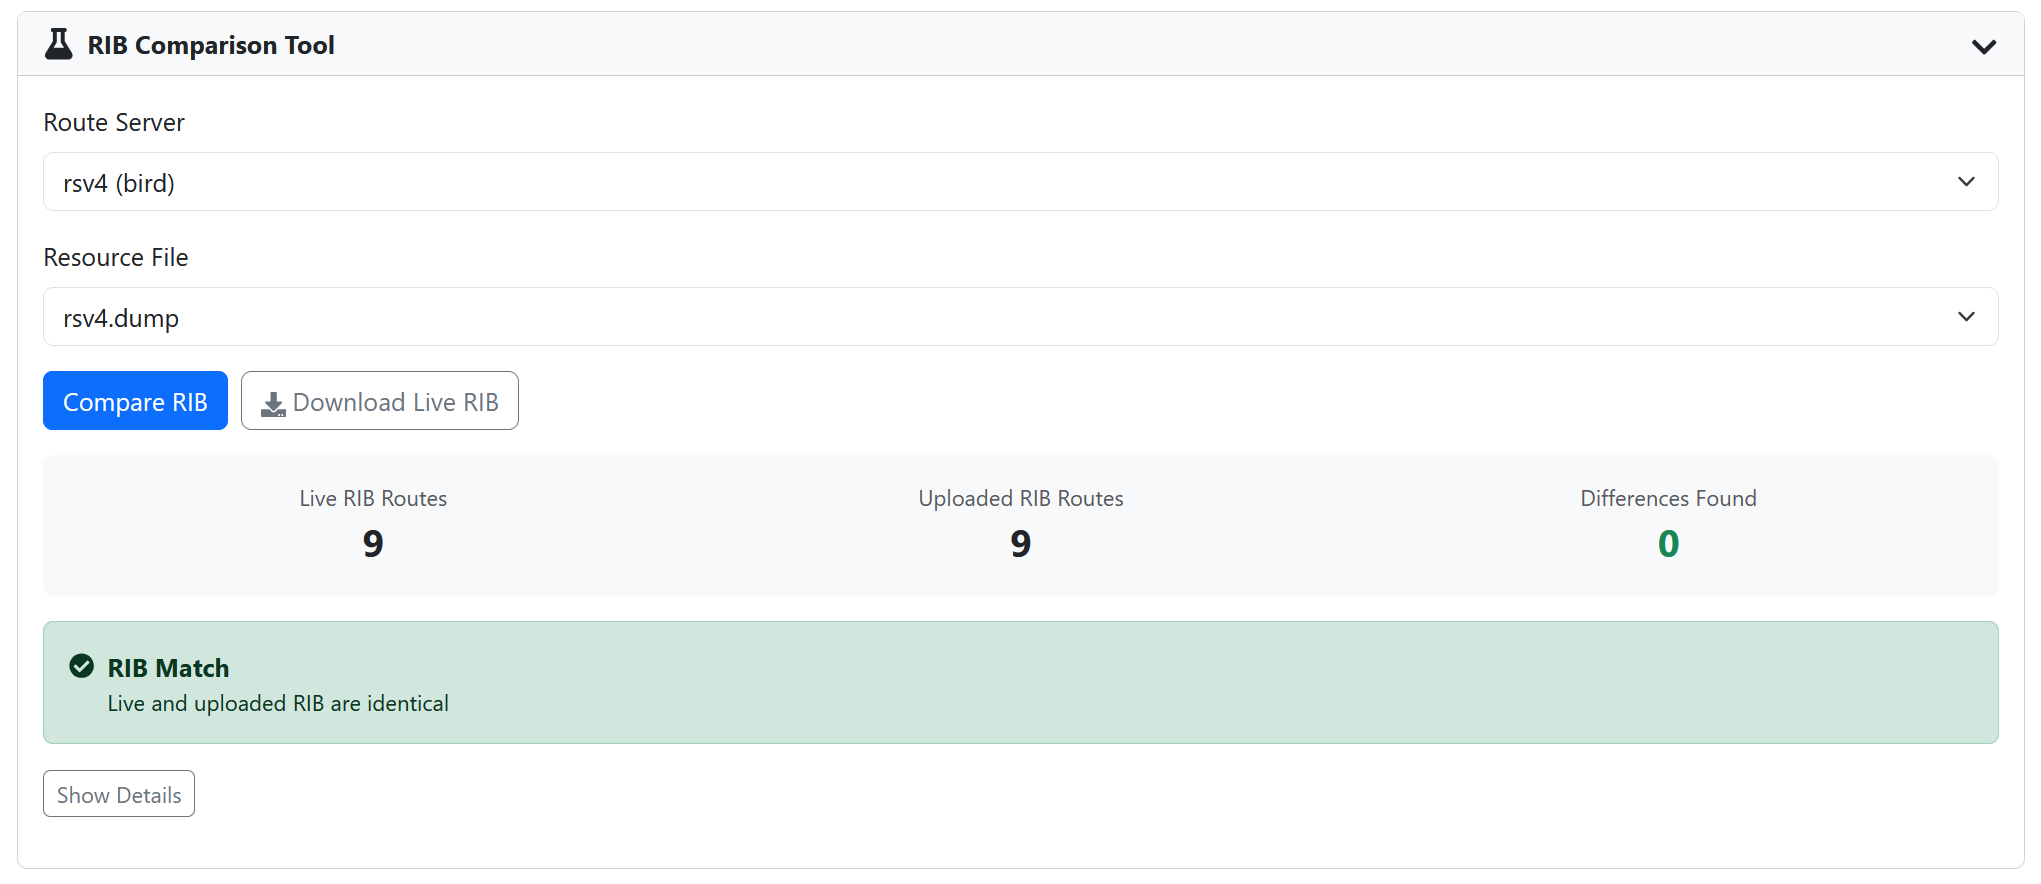
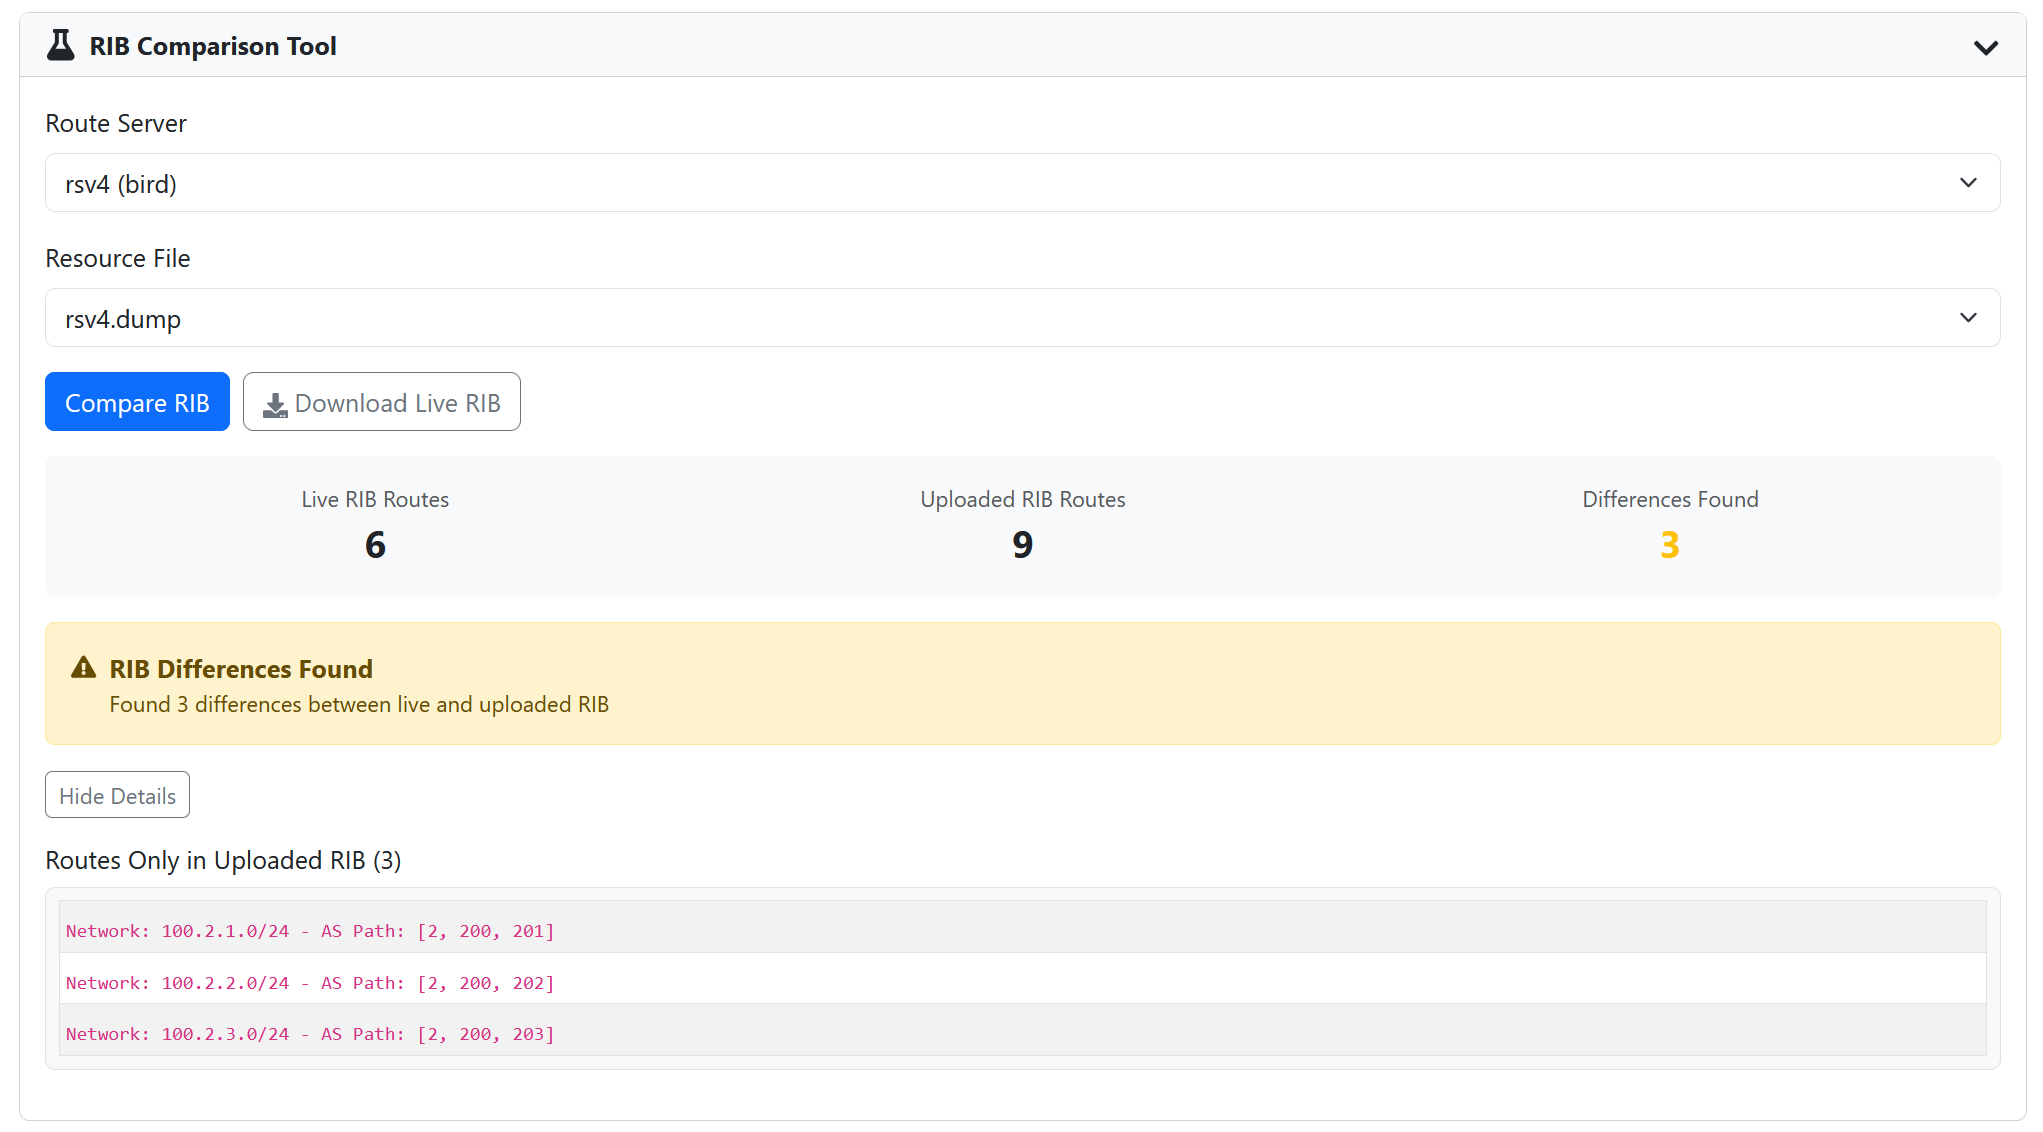
The RIB Comparison tool verifies that routes in the emulated route server match the RIB dump we uploaded. To run a
comparison, open the RIB Comparison section, select the route server (e.g., rsv4 for IPv4), and click Run
Comparison. The dashboard highlights any missing or extra routes, validating that the digital twin accurately
reproduces the production routing state.
If the configuration is correct, no differences should be reported.
If discrepancies are found, the tool displays them for further investigation and debugging.
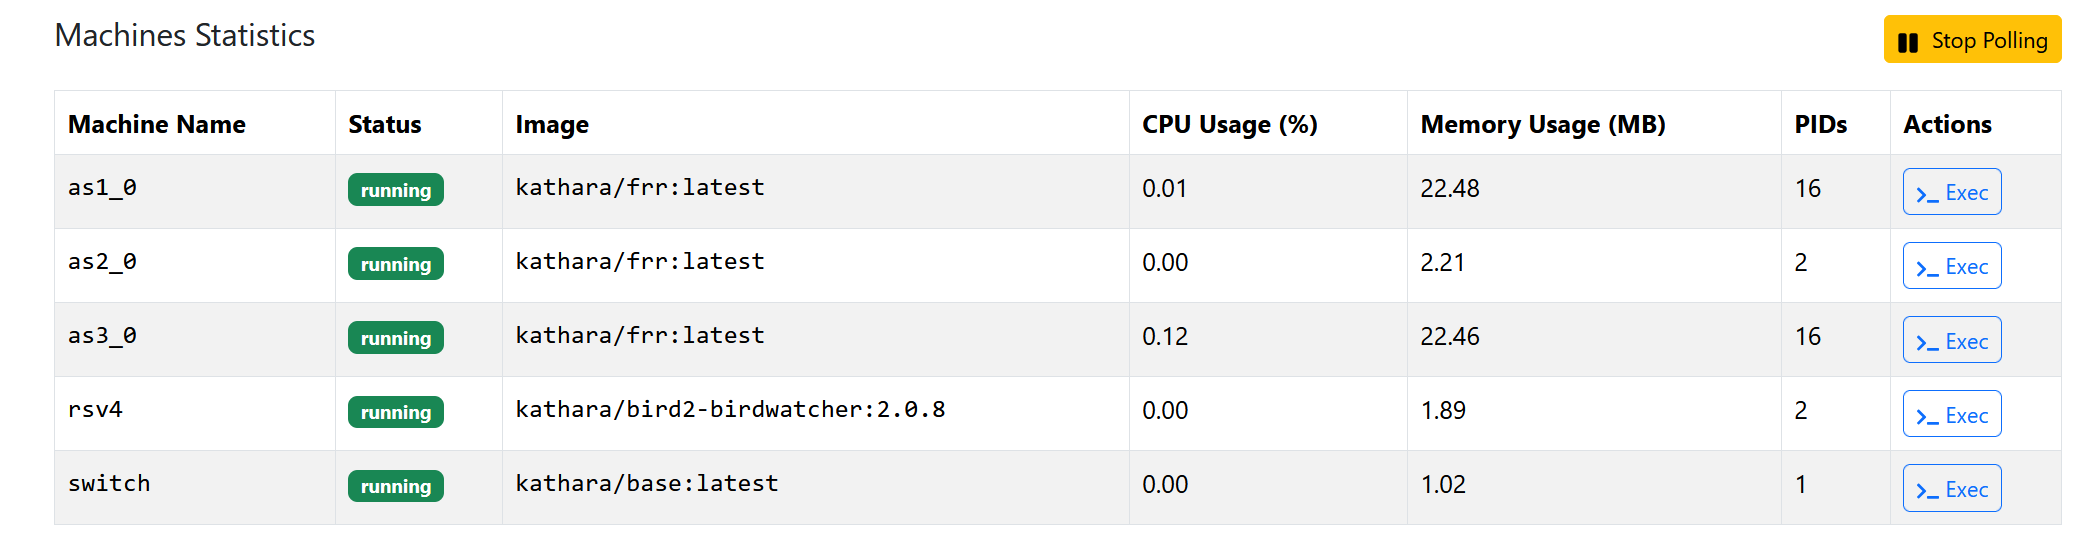
Once the digital twin is running, the Device Statistics section appears. It provides a quick overview of the
emulated devices, showing per-device metrics such as running status, CPU and memory usage, and basic network counters.
Use this view to confirm that route servers and customers are running and to spot abnormal resource usage while running
tests or quarantine checks. We can also execute commands (with the exec button), though it is usually better to log
into the container directly with Docker.
The quarantine dashboard is a separate web interface that helps us monitor and test customer onboarding. It connects to the digital twin backend and uses the same configuration we already saved.
In the same directory where we cloned the other repositories, clone the quarantine dashboard repository:
git clone git@github.com:KatharaFramework/ixp-quarantine-dashboard.gitEnter the repository and start the development stack:
docker compose -f docker-compose-dev.yml up --buildThis command builds the images and starts the backend, frontend, and reverse proxy services for the quarantine dashboard.
Note: If you need production deployment instructions, please refer to the complete Installation Guide or contact us for assistance.
Open our browser at the URL shown in the compose output (typically http://localhost:5173/). Verify that the digital twin status is Running. From here, we can create test sessions, run the selected quarantine actions, and inspect results for each customer.

The quarantine dashboard is designed for new customers during the onboarding phase. In practice, a new customer connects to the digital twin before being connected to the production network. Once connected, the customer can verify their router configuration and execute quarantine checks to ensure compliance with the IXP's technical rules.
To enable this, configure the host interface in the digital twin configuration, allowing customers to connect directly to the digital twin using Kathará's external connectivity feature.
In this tutorial, we execute the checks on AS3, assuming it is a new customer.
- Open the quarantine dashboard and fill in the form with AS3's information:
{
  "AS_NUMBER": 3,
  "IPv4 Address": "192.0.2.3",
  "MAC Address": "00:00:00:00:00:03"
}- Run the quarantine checks. This executes all checks we enabled in the configuration (ping, BGP session, RIB validation, etc.).

All checks should pass except one, which signals that an IP is in a private range (even though 192.0.2.0/24 is not
truly private, but reserved for documentation). This check should not fail if you use a public prefix for your fabric.
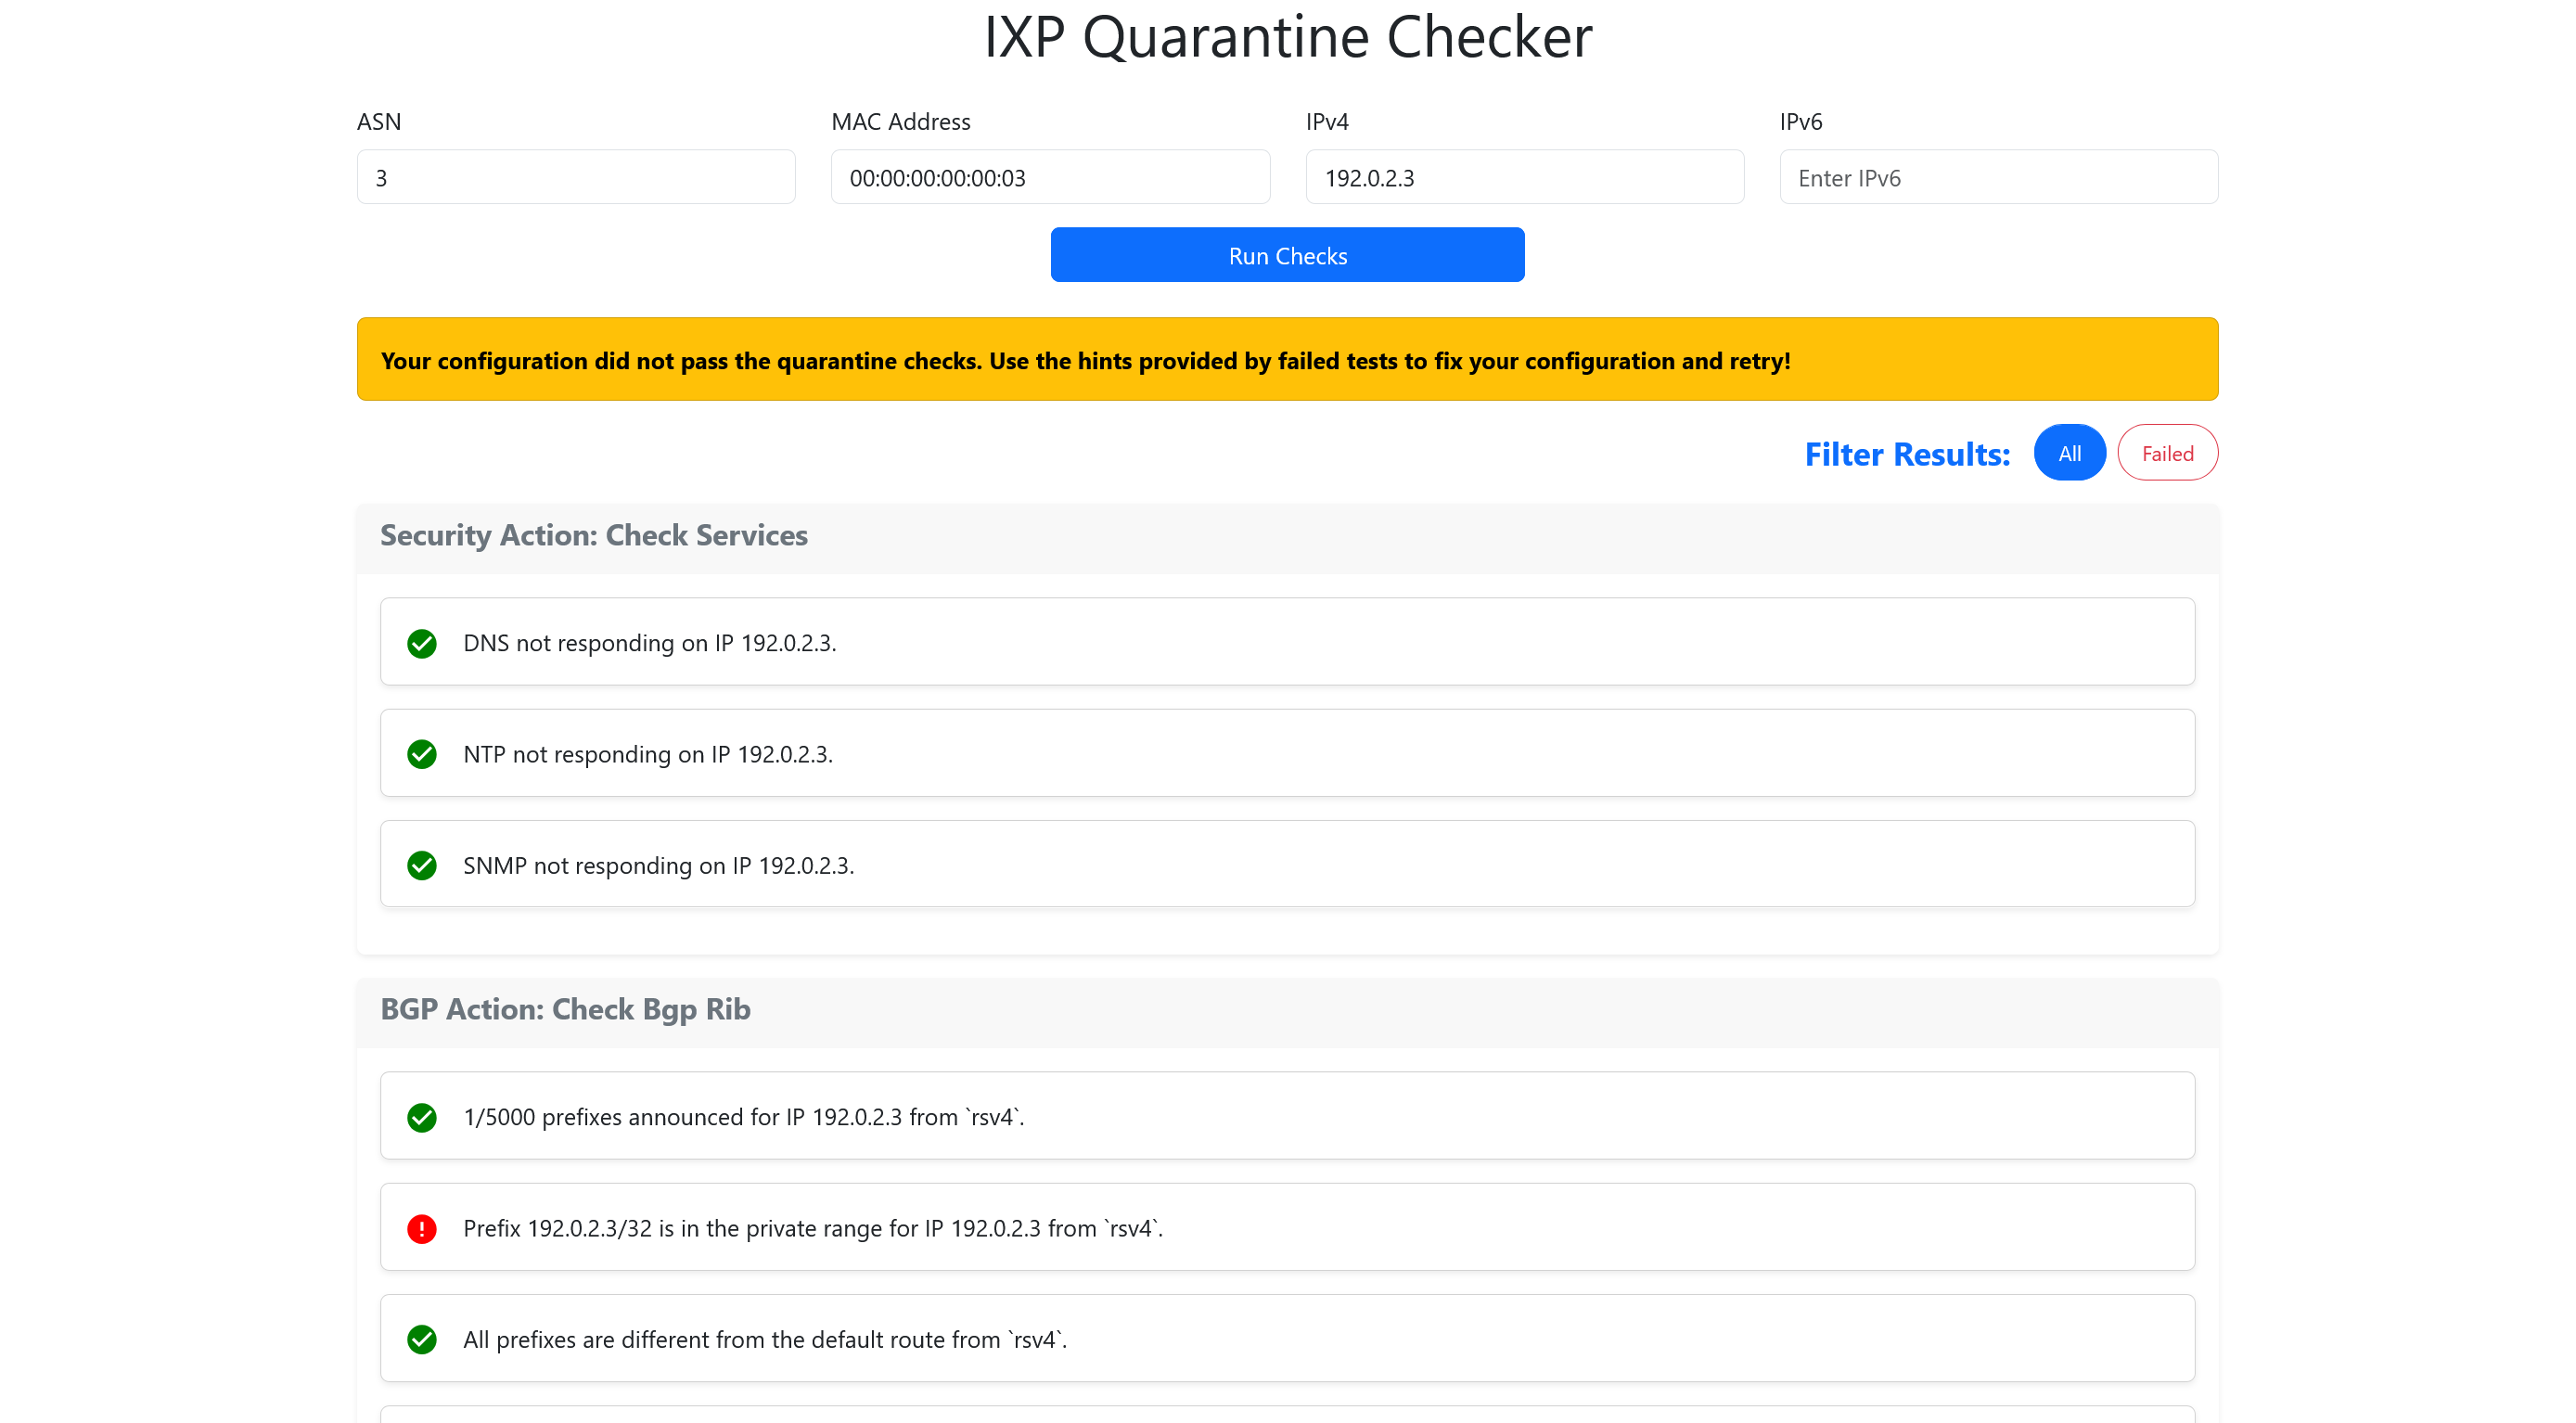
If all checks pass, the customer is compliant with the IXP's technical rules and can be safely connected to the production network.

A complete list of quarantine checks and their results is available in the Quarantine Checks section.
To ensure your Digital Twin remains an accurate representation of your production IXP, it needs to stay synchronized with changes in peering configurations, route server settings, and routing state. This includes updates to customer peerings, route server configuration changes, and periodic RIB refreshes to maintain consistency.
For a detailed walkthrough of how to implement a systematic synchronization procedure, see Synchronization Procedure.
We now have a complete workflow to model our IXP, validate route server behavior, and test customer compliance before production onboarding. Use the digital twin to iterate safely on route server configurations and quarantine policies, then deploy changes to the live infrastructure with confidence.
If you need further information or assistance for setting up your digital twin, please contact us.