Data Source:
Open University Learning Analytics dataset (OULAD) https://analyse.kmi.open.ac.uk/open_dataset
Data Description:
It contains data about courses, students and their interactions with Virtual Learning Environment (VLE) for seven selected courses (called modules). Presentations of courses start in February and October - they are marked by “B” and “J” respectively. The dataset consists of tables connected using unique identifiers. All tables are stored in the csv format.
Tables:
- courses
- assessments
- vle
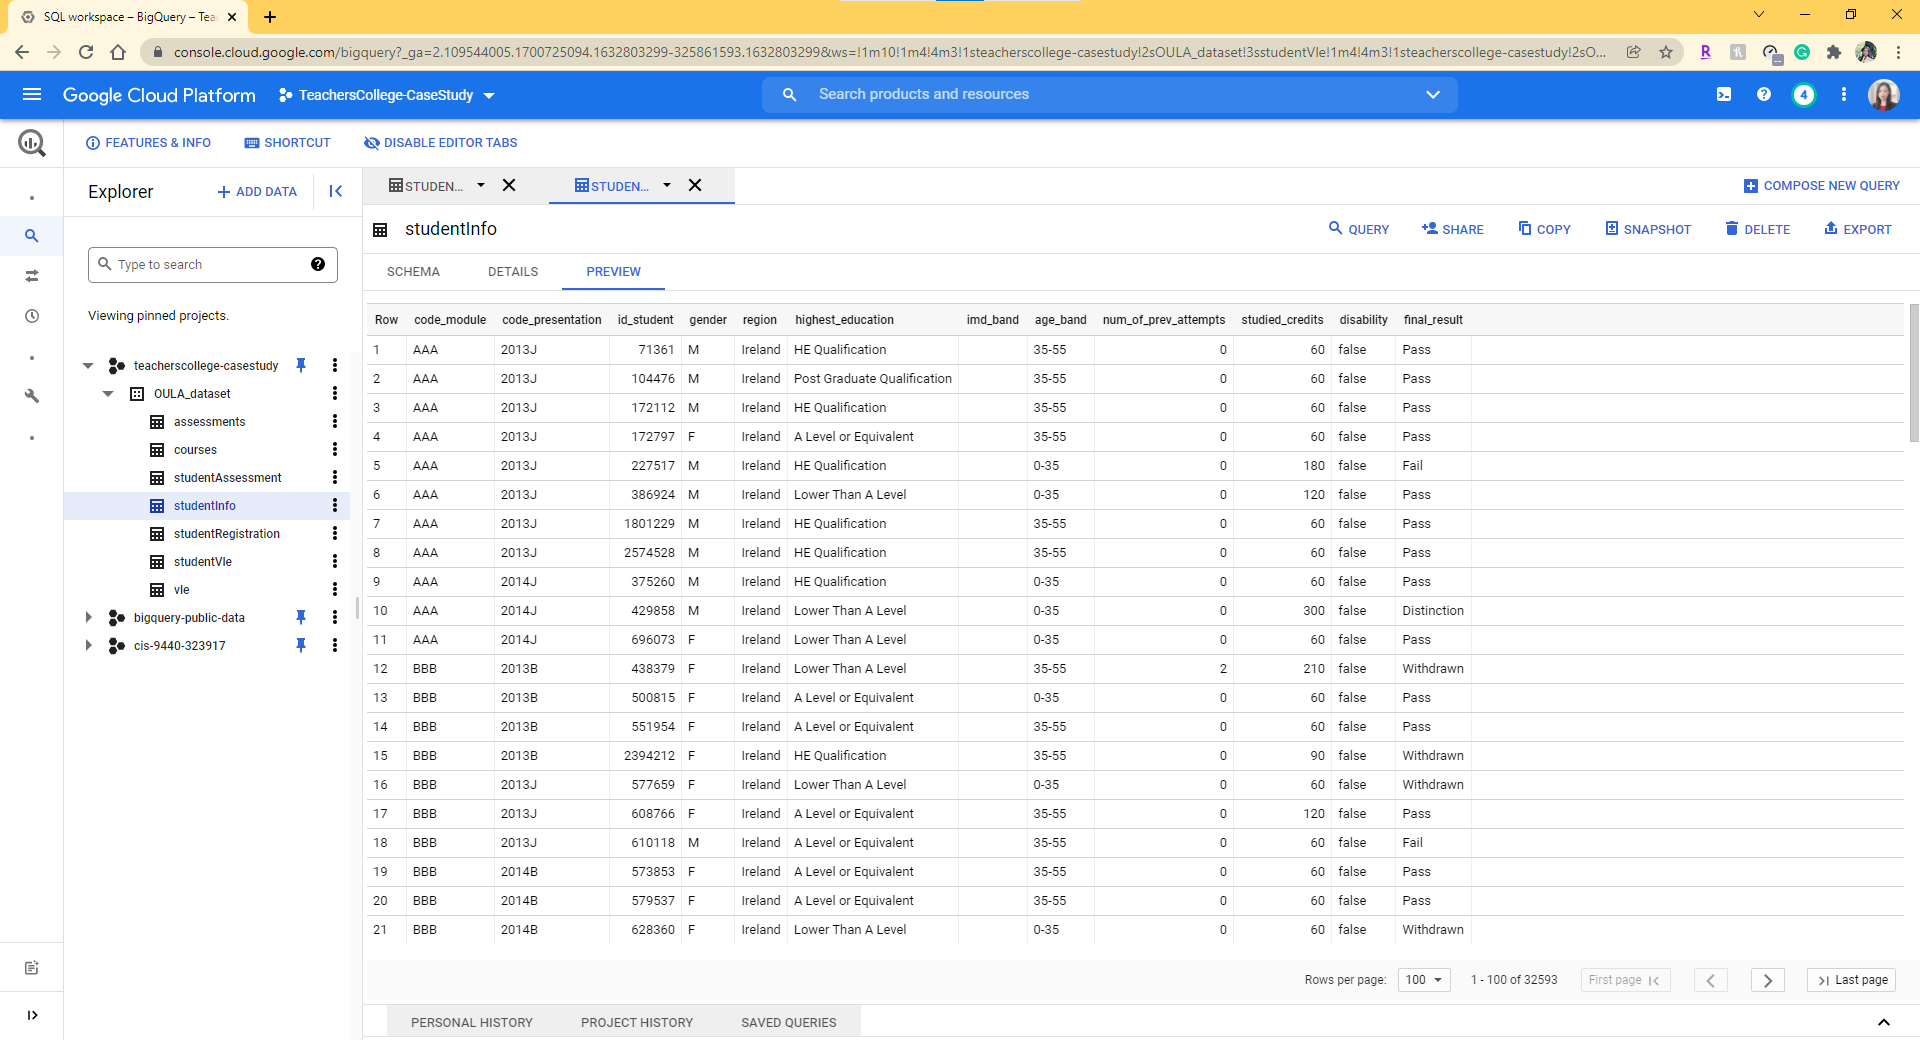
- studentInfo
- studentRegistration
- studentAssessment
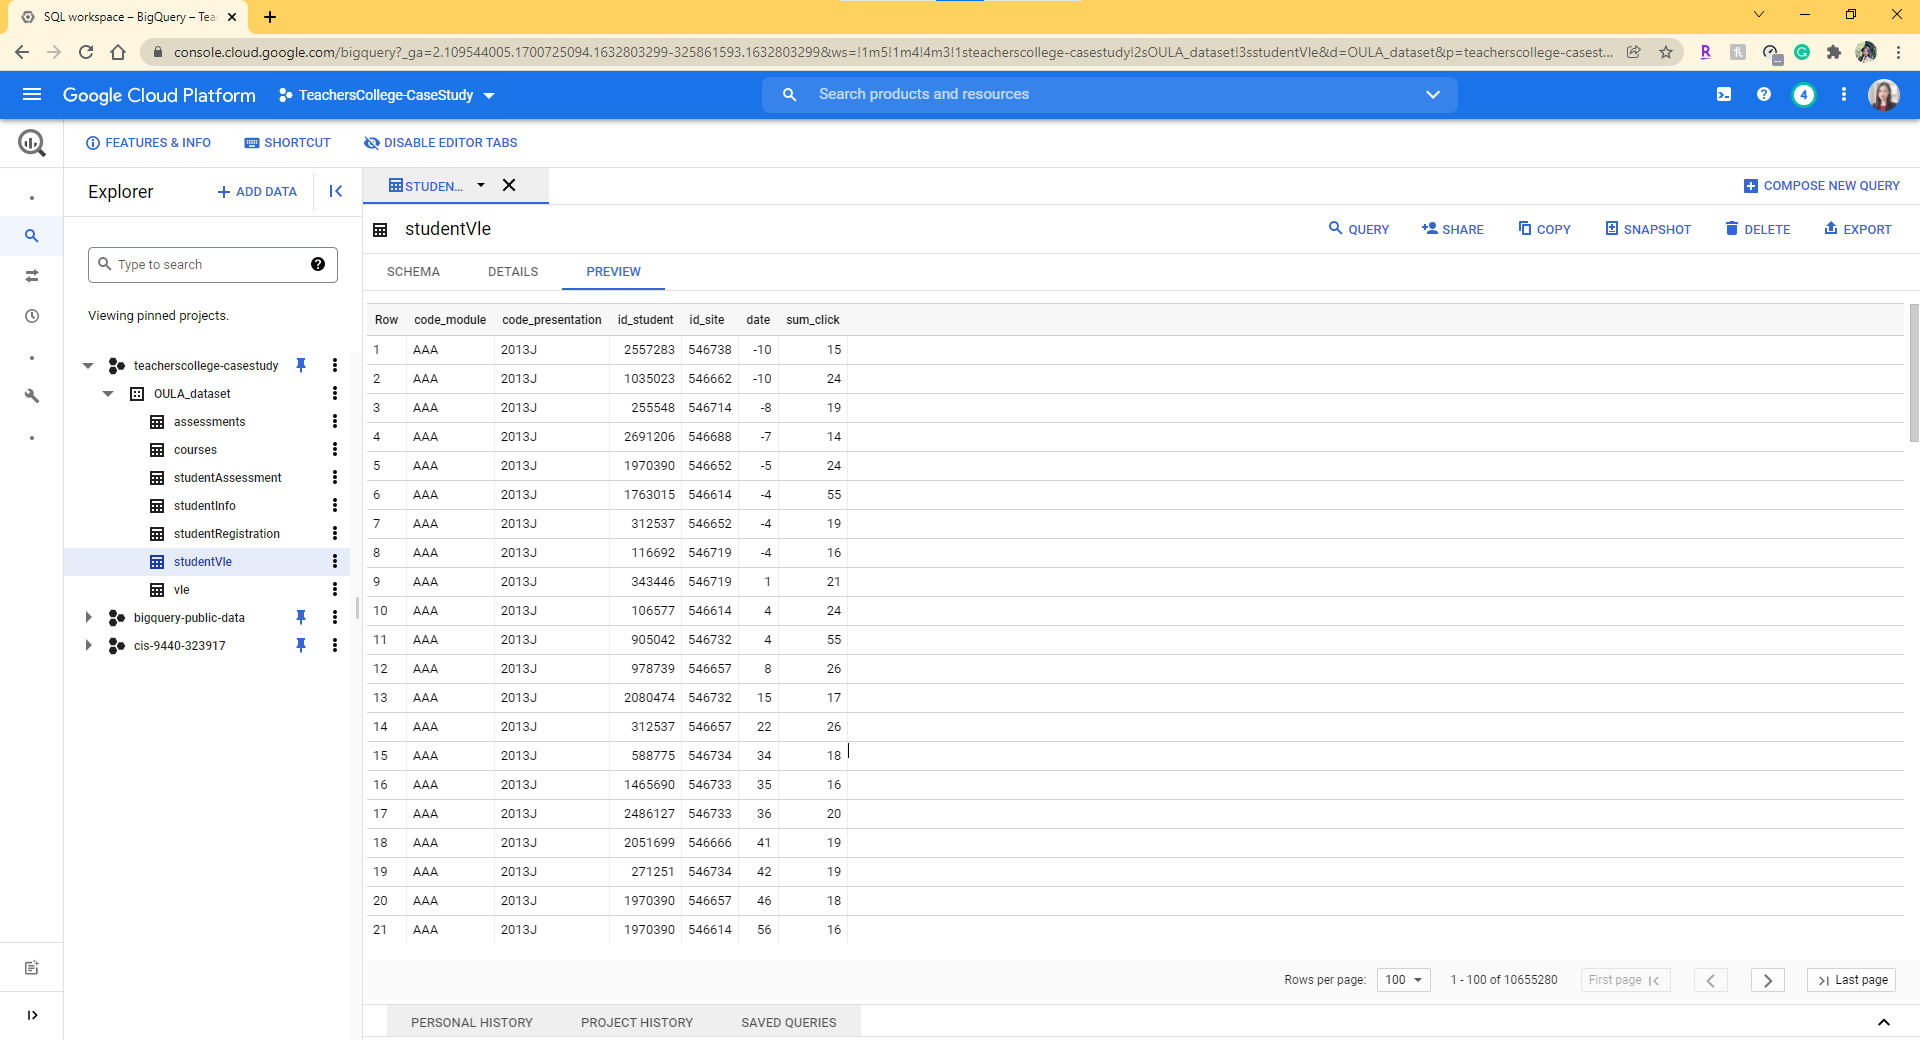
- studentVle
Screenshot of Intersurface (Any two tables)
⭐Table 01:
⭐Table 02:
SQL
- Step 4 & Step 5
Using SQL join the studentAssessment and studentInfo tables by the id_student variable. Create a summary of the mean score, summarized according to region.
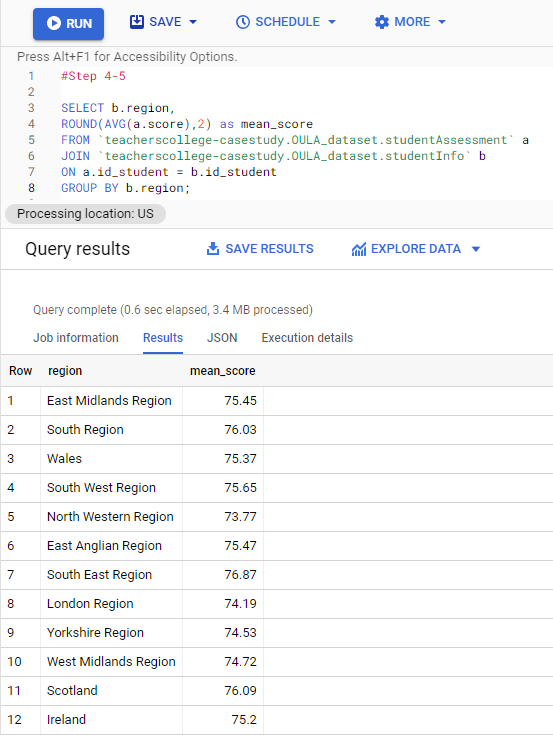
** Because of limited space, only first 12 results are shown.
- Step 6
Select all students from the studentInfo table who live in a region that has a name where the letter 'c' is the second letter
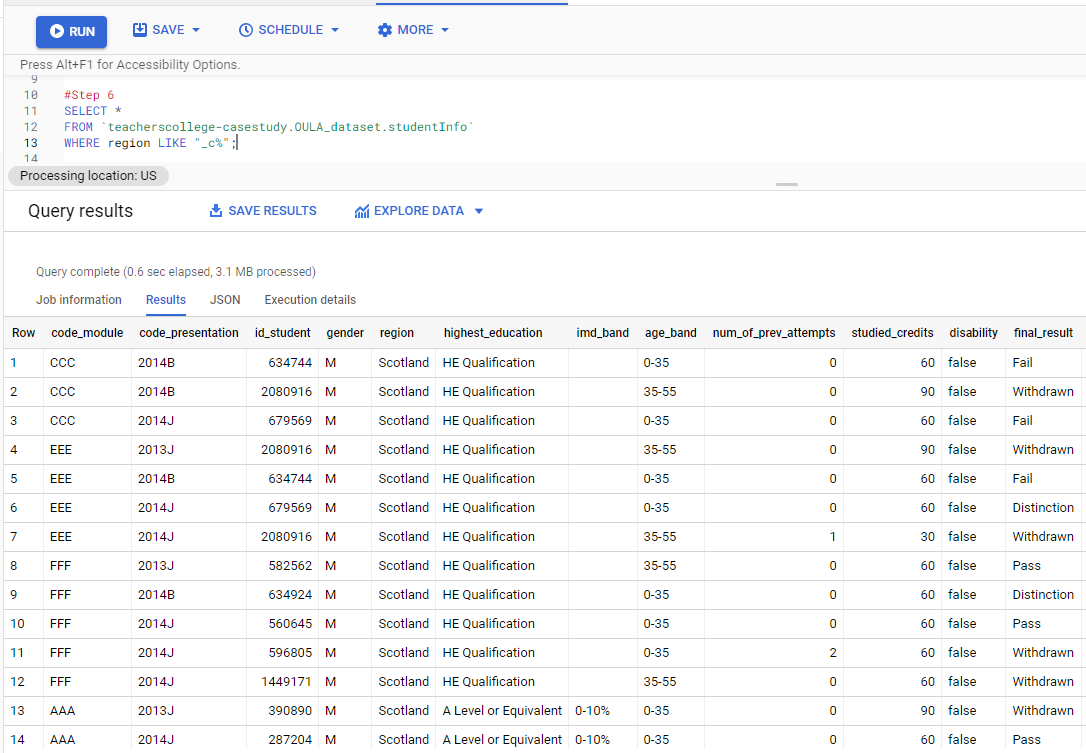
** Because of limited space, only first 14 results are shown.
Any investigation
- 7.1 Find the number of withdrawn registration per region
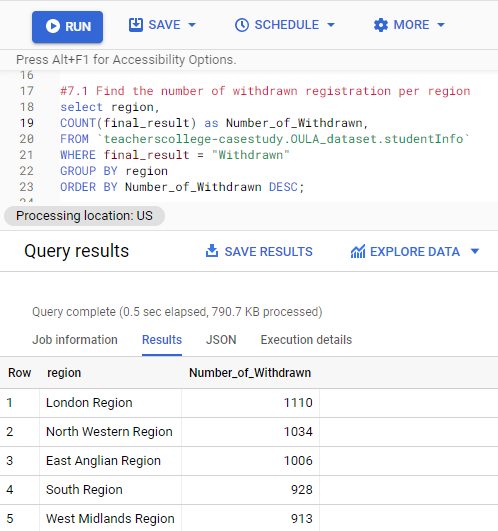
** London Region is the region has the highest student withdrawn from registration
- 7.2 Find the number of students passing different assessments type in different semester
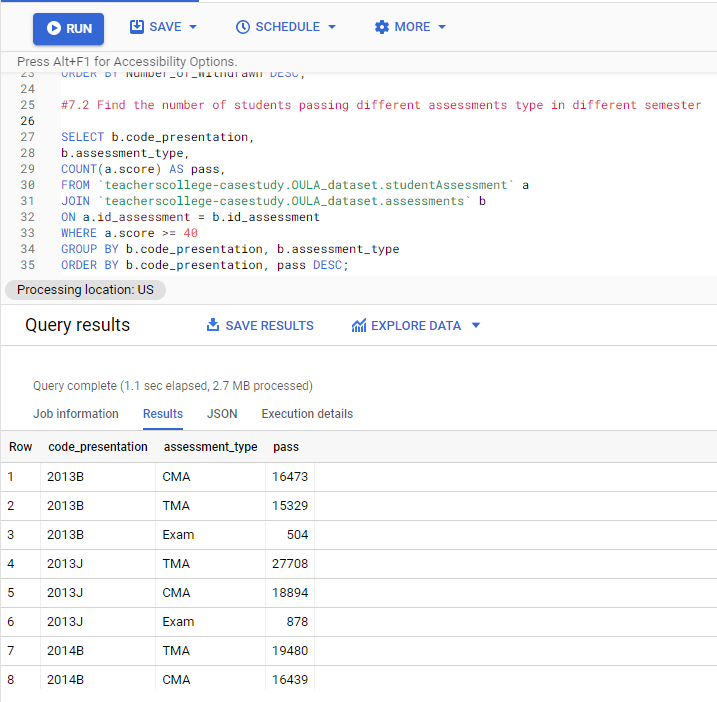
** CMA assessment has the highest number of students passed the assessment among all the presentation
- 7.3 Find the average number of times a students interacts with the material in region contains "u"
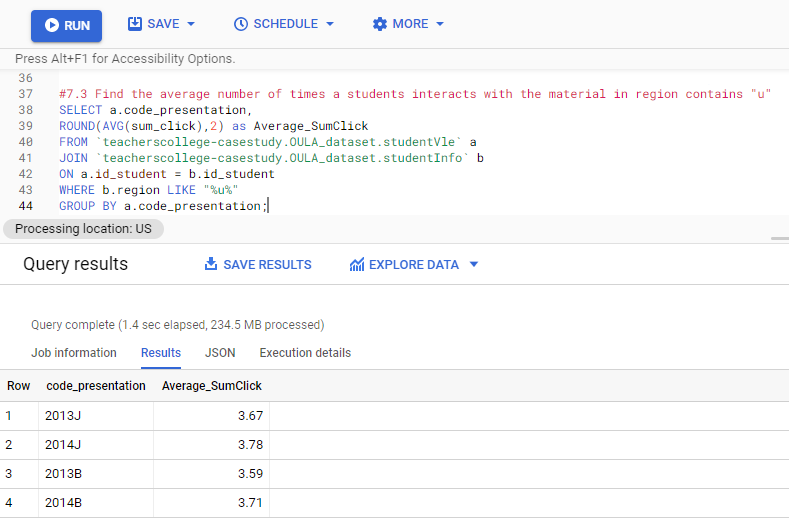
** The average number of times a students interacts with the material in region contains "u" are between 3.59 and 3.78
Visualization - Tableau
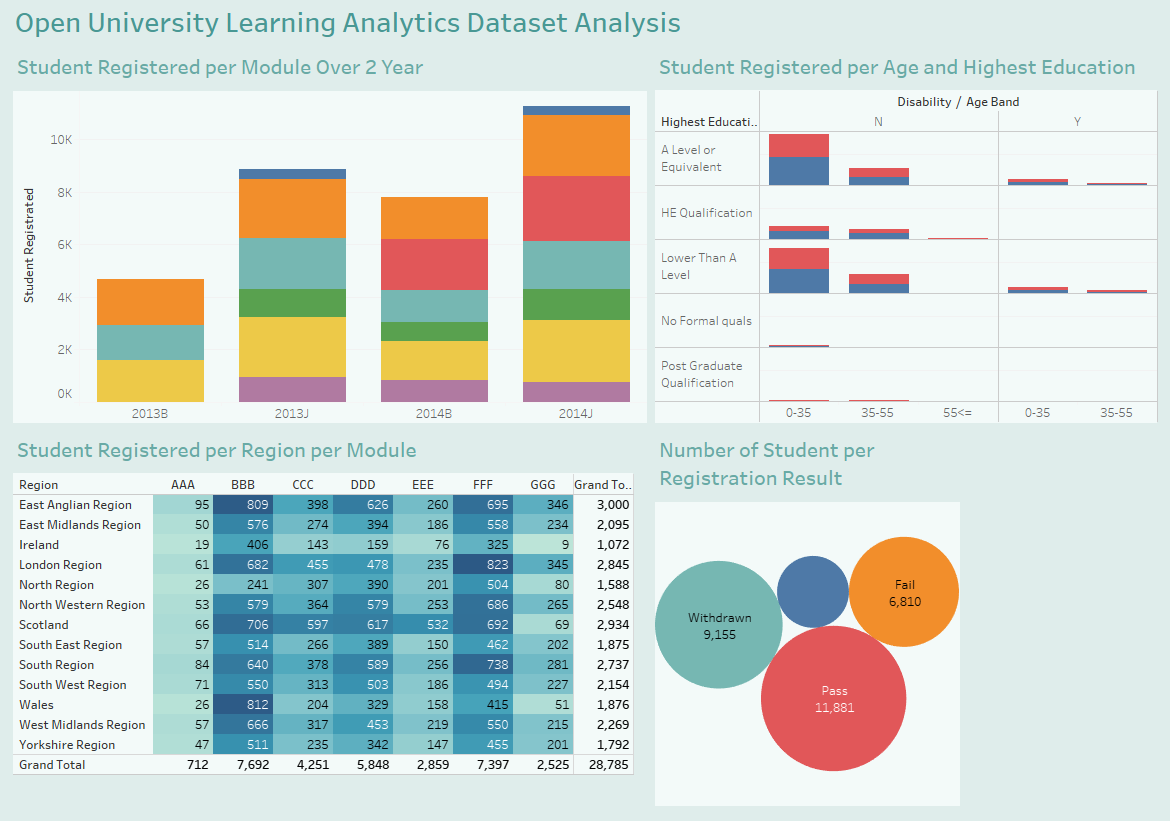
Tableau Public Link:
Please see the Explanation.md file for details of each visual.
Thank you!